
Reports
Reports
The exponential growth in the electronics industry has created significant opportunities for a host of component manufacturers. Varactor diode manufacturers have also seen demand increasing steadily in the recent past; however, reliance on quantity alone may not suffice in the long run. As devices becoming smarter and high-tech, varactor diode manufacturers are staring at a future where legacy components may become obsolete. To sustain and succeed, development of new products, through rigorous research and development, will be the key. Transparency Market Research (TMR) in its latest study, analyzes these global varactor diode market comprehensively, offering readers rare insights and analysis on how demand will evolve in the future.

The proliferation of smart devices has necessitated the need for smarter components used in the manufacturing of these devices. Component manufacturers are being hard-pressed to develop and enhance the working of varactor diodes, as they play a significant role in providing the desired capacitance changes. Device manufacturers are looking for diodes that are reliable, incur lesser cost, and generate low noise—varactor diodes more or less satisfy these requirements. Driven by their growing applicability, the varactor diode market is likely to cross US$ 800 million by the end of 2027.
The adoption of varactor diodes has substantially increased in the aerospace and defense industry too. Varactor diode manufacturers are aware of the growing opportunities, and it is highly likely that demand from aerospace and defense will translate into a larger revenue share than it does currently.
Varactor diodes mainly work on the reverse bias mode. As such, their application is limited in a few industries. On the other hand, ordinary diodes work on the forward bias mode, allowing them to have a wide range of industrial applications. Owing to this fact, varactor diode manufacturers have limited scope in which to experiment, which also limits their scope of innovation. This, in turn, is obstructing the growth of the global varactor diode market.
The semiconductor industry is keenly observing the broader developments in wireless and 5G technology. The massive investments in these technologies has already created significant opportunities for semiconductor industry in general, and varactor diode manufacturers in particular. In a bid to capitalize on these opportunities, strategic partnerships, mergers, and acquisitions are in the offing.
Recently, Movandi and NXP Semiconductors N.V. entered into a strategic partnership to collectively work on millimeter wave solutions for 5G networks. With this initiative, they will collectively deliver high-performance 5G solutions and wireless communication infrastructure for applications such as smart homes, self-driving cars, and mobile cloud-based services.
Skyworks Solutions, Inc., another prominent player in the global varactor diode market, entered into a collaboration with MediaTalk Incorporated to deliver a standard-based 5G solution.
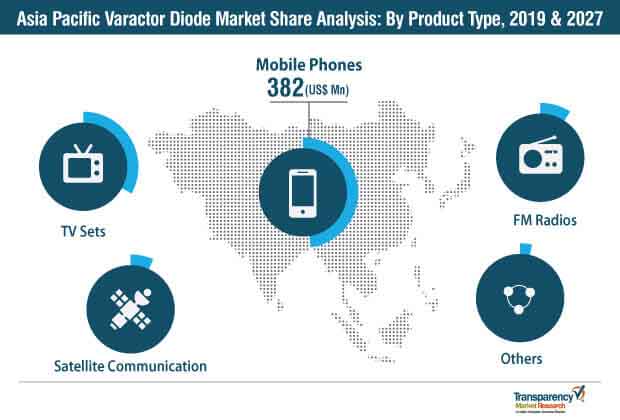
Growing demand for smartphones in China and India continue to drive demand for varactor diodes. Based on recent studies, the number of mobile phone users in Asia Pacific is projected to cross 2.8 billion by the end of 2019. Increasing Internet penetration and disposable income have meant that demand for smartphones is not going to subside anytime soon—a critical factor that can ensure sustained demand for varactor diodes in the region.
In the global varactor diode market, the competition seems moderately consolidated, as leading players in this market hold more than 50% share. However, in the coming years, the market may experience a fragmented nature due to the emergence of prominent and new players.
Key players in the market are focusing on organic and inorganic strategies that create a dynamic competitive landscape in the global varactor diode market. Innovation and geographic expansion are also some of the key focus points of players in the market. For example, Skyworks Solution Inc. acquired Avnera Corporation to expand its leadership in wireless connectivity solutions. With this acquisition, Skyworks intends to capitalize on the rapid proliferation of audio functionality and its convergence with advanced connectivity solutions.
Another example is of Infineon Technologies AG, which recently expanded its development site in Liz, Austria. With this expansion, the company will offer room for around 400 employees. Further, it will strengthen its research and development efforts in the area of high-frequency components. The company’s R&D mainly focuses on 77GHzradar chips for driver assistance systems.
Analyst Take On Varactor Diode Market Growth
Analysts of this report opine that, the global varactor diode market will experience significant growth in the coming years. The rising focus on 5G technology has opened numerous opportunities in the varactor diode market. Owing to these developments, the varactor diode market promises to stand at a higher revenue base of more than US$ 800 million by the end of 2027. Additionally, Asia Pacific and North America are likely to remain the key markets for varactor diode manufacturers, due to the high population base and development of advanced technologies, respectively. The emergence of new entrants in the market is further contributing to the diversifying growth of the varactor diode market.
Global Varactor Diode Market: Overview
A varactor diode is a semiconductor device that operates in a reverse-bias mode. A diode whose internal capacitance varies according to variations in the reverse voltage is known as a varactor diode. In a voltage-dependent device, the output of the diode depends upon the input voltage. A Varactor diode is also called a varicap diode, voltage-variable capacitance, or tuning diode. Varactor diodes are largely used in applications wherein variable capacitance is required. The global varactor diode market is anticipated to expand at a CAGR of more than 6.5% between 2019 and 2027, and reach value of more than US$ 800 Mn by the year 2027.
Varactor diodes are largely used in the filters and tuning circuits of various electronic devices such as mobile phones, TV sets, FM radios, and satellite communication equipment. These diodes are also extensively utilized in wireless system infrastructure. They play a key role in the operation of 5G technology. Varactor didoes enhance the linearity function for the high-speed applications of 5G technology. With the implementation of 5G technology and the growing use of varactor diodes in tuning circuits, the varactor diode market is estimated to expand at a significant pace during the forecast period.
The demand for varactor didoes for use in consumer electronics products such as mobile phones, TV sets, FM radios, and satellite communication equipment; and in their circuits, such as voltage-controlled oscillators, RF filters, and automatic frequency controls; is rising. This factor is expected to provide lucrative opportunities to the global varactor diode market during the forecast period. Since semiconductors form an integral part of electronic and computing products, the boom in the consumer electronics industry and the high consumption rate of mobile phones and TV sets are also driving the global varactor diode market.
Varactor diodes offer several advantages over other types of diodes. A varactor diode operates in the reverse-bias mode. In this mode, a varactor diode operates at up to 20 volts. Some diodes can operate at up to 60 volts too. Some of the key characteristics of varactor diodes are reliability (varactor diodes are more reliable than other p–n junction diodes), low noise (varactor diodes generate less noise than other diodes), low power consumption, portability (varactor diodes are small in size and easy to carry), and low price.
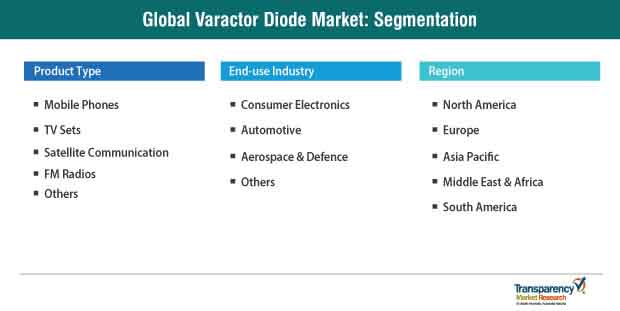
The global varactor diode market has been segmented based on product, end-use industry, and region. In terms of product, the varactor diode market has been classified into mobile phones, TV sets, FM radios, satellite communication, and others. The mobile phone segment dominated the market in 2018, due to the increasing consumption of mobile phones with varactor didoes being used in their circuits.
In terms of end-use industry, the global varactor diode market has been divided into consumer electronics, automotive, aerospace & defense, and others. The consumer electronics segment is expected to dominate the market during the forecast period, due to the increasing adoption of consumer electronic devices such as mobile phones, TV sets, and FM radios.
In terms of region, the global varactor diode market has been segmented into North America, Europe, Asia Pacific, South America, and the Middle East & Africa. Asia Pacific accounted for a major share of the global market in the year 2018. The varactor diode market in the region is driven by the strong presence of key players and high rate of adoption of consumer electronic devices in the region.
Attracted by the anticipated growth of the global varactor diode market and underlying latent demand, several players are expanding their businesses through strategic mergers and acquisitions, as well as partnerships. Some of the prominent players operating in the global varactor diode market are NXP Semiconductor, Skyworks Solution Inc., Infineon Technologies AG, Microsemi Corporation, MACOM Technology Solutions Holdings, Inc., Toshiba Corporation, On Semiconductor, ST Microelectronics, ASI Semiconductor Inc., and Murata Manufacturing Co., Ltd.
The Varactor Diode Market is studied from 2019-2027
The Varactor Diode market is projected to reach the valuation of US$ 800 million by 2027
The Varactor Diode market is expected to grow at a CAGR of 6.5% during 2019-2030
NXP Semiconductor, Skyworks Solution Inc., Infineon Technologies AG, Microsemi Corporation, MACOM Technology Solutions Holdings, Inc., Toshiba Corporation are the key vendors in the Varactor Diode market.
The key factors driving the Varactor Diode market growth are: Adoption of 5G Technology to Influence the Smarter Adoption of Varactor Diodes
1. Preface
1.1. Market Definition and Scope
1.2. Market Segmentation
1.3. Key Research Objectives
1.4. Research Highlights
2. Assumptions and Research Methodology
3. Executive Summary: Global Varactor Diode Market
4. Market Overview
4.1. Introduction
4.2. Market Dynamics
4.2.1. Drivers
4.2.2. Restraints
4.2.3. Opportunities
4.3. Key Trends Analysis
4.4. Global Varactor Diode Market Analysis and Forecast, 2017–2027
4.4.1. Market Revenue Projection (US$ Mn)
4.4.2. Market Volume Projection (Million Units)
4.5. Porter’s Five Forces Analysis - Global Varactor Diode Market
4.6. Value Chain Analysis - Global Varactor Diode Market
4.7. Market Outlook
5. Global Varactor Diode Market Analysis and Forecast, by Product
5.1. Overview and Definitions
5.2. Global Varactor Diode Market Size (US$ Mn and Million Units) Forecast, by Product, 2017–2027
5.2.1. Mobile Phones
5.2.1.1. VCOs
5.2.1.2. RF Filters
5.2.1.3. AFCs
5.2.1.4. Others
5.2.2. TV Sets
5.2.2.1. VCOs
5.2.2.2. RF Filters
5.2.2.3. AFCs
5.2.2.4. Others
5.2.3. Satellite Communication
5.2.3.1. VCOs
5.2.3.2. RF Filters
5.2.3.3. AFCs
5.2.3.4. Others
5.2.4. FM Radios
5.2.4.1. VCOs
5.2.4.2. RF Filters
5.2.4.3. AFCs
5.2.4.4. Others
5.2.5. Others
5.3. Product Comparison Matrix
5.4. Global Varactor Diode Market Attractiveness, by Product
6. Global Varactor Diode Market Analysis and Forecast, by End-use Industry
6.1. Overview and Definitions
6.2. Global Varactor Diode Market Size (US$ Mn and Million Units) Forecast, by End-use Industry, 2017–2027
6.2.1. Consumer Electronics
6.2.2. Automotive
6.2.3. Aerospace & Defense
6.2.4. Others
6.3. End-use Industry Comparison Matrix
6.4. Global Varactor Diode Market Attractiveness, by End-use Industry
7. Global Varactor Diode Market Analysis and Forecast, by Region
7.1. Key Findings
7.2. Global Varactor Diode Market Size (US$ Mn and Million Units) Forecast, by Region, 2017–2027
7.2.1. North America
7.2.2. Europe
7.2.3. Asia Pacific
7.2.4. Middle East & Africa
7.2.5. South America
7.3. Global Varactor Diode Market Attractiveness, by Region
8. North America Varactor Diode Market Analysis and Forecast
8.1. Key Findings
8.2. Key Trends
8.3. North America Varactor Diode Market Size (US$ Mn and Million Units) Forecast, by Product, 2017–2027
8.3.1. Mobile Phones
8.3.1.1. VCOs
8.3.1.2. RF Filters
8.3.1.3. AFCs
8.3.1.4. Others
8.3.2. TV Sets
8.3.2.1. VCOs
8.3.2.2. RF Filters
8.3.2.3. AFCs
8.3.2.4. Others
8.3.3. Satellite Communication
8.3.3.1. VCOs
8.3.3.2. RF Filters
8.3.3.3. AFCs
8.3.3.4. Others
8.3.4. FM Radios
8.3.4.1. VCOs
8.3.4.2. RF Filters
8.3.4.3. AFCs
8.3.4.4. Others
8.3.5. Others
8.4. North America Varactor Diode Market Size (US$ Mn and Million Units) Forecast, by End-use Industry, 2017–2027
8.4.1. Consumer Electronics
8.4.2. Automotive
8.4.3. Aerospace & Defense
8.4.4. Others
8.5. North America Varactor Diode Market Size (US$ Mn and Million Units) Forecast, by Country/Sub-region, 2017–2027
8.5.1. U.S.
8.5.2. Canada
8.5.3. Rest of North America
8.6. North America Varactor Diode Market Attractiveness Analysis
8.6.1. by Product
8.6.2. by End-use Industry
8.6.3. by Country/Sub-region
9. Europe Varactor Diode Market Analysis and Forecast
9.1. Key Findings
9.2. Key Trends
9.3. Europe Varactor Diode Market Size (US$ Mn and Million Units) Forecast, by Product, 2017–2027
9.3.1. Mobile Phones
9.3.1.1. VCOs
9.3.1.2. RF Filters
9.3.1.3. AFCs
9.3.1.4. Others
9.3.2. TV Sets
9.3.2.1. VCOs
9.3.2.2. RF Filters
9.3.2.3. AFCs
9.3.2.4. Others
9.3.3. Satellite Communication
9.3.3.1. VCOs
9.3.3.2. RF Filters
9.3.3.3. AFCs
9.3.3.4. Others
9.3.4. FM Radios
9.3.4.1. VCOs
9.3.4.2. RF Filters
9.3.4.3. AFCs
9.3.4.4. Others
9.3.5. Others
9.4. Europe Varactor Diode Market Size (US$ Mn and Million Units) Forecast, by End-use Industry, 2017–2027
9.4.1. Consumer Electronics
9.4.2. Automotive
9.4.3. Aerospace & Defense
9.4.4. Others
9.5. Europe Varactor Diode Market Size (US$ Mn and Million Units) Forecast, by Country/Sub-region, 2017–2027
9.5.1. U.K.
9.5.2. Germany
9.5.3. France
9.5.4. Rest of Europe
9.6. Europe Varactor Diode Market Attractiveness Analysis
9.6.1. by Product
9.6.2. by End-use Industry
9.6.3. by Country/Sub-region
10. Asia Pacific Varactor Diode Market Analysis and Forecast
10.1. Key Findings
10.2. Key Trends
10.3. Asia Pacific Varactor Diode Market Size (US$ Mn and Million Units) Forecast, by Product, 2017–2027
10.3.1. Mobile Phones
10.3.1.1. VCOs
10.3.1.2. RF Filters
10.3.1.3. AFCs
10.3.1.4. Others
10.3.2. TV Sets
10.3.2.1. VCOs
10.3.2.2. RF Filters
10.3.2.3. AFCs
10.3.2.4. Others
10.3.3. Satellite Communication
10.3.3.1. VCOs
10.3.3.2. RF Filters
10.3.3.3. AFCs
10.3.3.4. Others
10.3.4. FM Radios
10.3.4.1. VCOs
10.3.4.2. RF Filters
10.3.4.3. AFCs
10.3.4.4. Others
10.3.5. Others
10.4. Asia Pacific Varactor Diode Market Size (US$ Mn and Million Units) Forecast, by End-use Industry, 2017–2027
10.4.1. Consumer Electronics
10.4.2. Automotive
10.4.3. Aerospace & Defense
10.4.4. Others
10.5. Asia Pacific Varactor Diode Market Size (US$ Mn and Million Units) Forecast, by Country/Sub-region, 2017–2027
10.5.1. China
10.5.2. India
10.5.3. Japan
10.5.4. Australia
10.5.5. Rest of Asia Pacific
10.6. Asia Pacific Varactor Diode Market Attractiveness Analysis
10.6.1. by Product
10.6.2. by End-use Industry
10.6.3. by Country/Sub-region
11. Middle East & Africa (MEA) Varactor Diode Market Analysis and Forecast
11.1. Key Findings
11.2. Key Trends
11.3. Middle East & Africa (MEA) Varactor Diode Market Size (US$ Mn and Million Units) Forecast, by Product, 2017–2027
11.3.1. Mobile Phones
11.3.1.1. VCOs
11.3.1.2. RF Filters
11.3.1.3. AFCs
11.3.1.4. Others
11.3.2. TV Sets
11.3.2.1. VCOs
11.3.2.2. RF Filters
11.3.2.3. AFCs
11.3.2.4. Others
11.3.3. Satellite Communication
11.3.3.1. VCOs
11.3.3.2. RF Filters
11.3.3.3. AFCs
11.3.3.4. Others
11.3.4. FM Radios
11.3.4.1. VCOs
11.3.4.2. RF Filters
11.3.4.3. AFCs
11.3.4.4. Others
11.3.5. Others
11.4. Middle East & Africa (MEA) Varactor Diode Market Size (US$ Mn and Million Units) Forecast, by End-use Industry, 2017–2027
11.4.1. Consumer Electronics
11.4.2. Automotive
11.4.3. Aerospace & Defense
11.4.4. Others
11.5. Middle East & Africa (MEA) Varactor Diode Market Size (US$ Mn and Million Units) Forecast, by Country/Sub-region, 2017–2027
11.5.1. GCC
11.5.2. South Africa
11.5.3. Rest of Middle East & Africa
11.6. Middle East & Africa (MEA) Varactor Diode Market Attractiveness Analysis
11.6.1. by Product
11.6.2. by End-use Industry
11.6.3. by Country/Sub-region
12. South America Varactor Diode Market Analysis and Forecast
12.1. Key Findings
12.2. Key Trends
12.3. South America Varactor Diode Market Size (US$ Mn and Million Units) Forecast, by Product, 2017–2027
12.3.1. Mobile Phones
12.3.1.1. VCOs
12.3.1.2. RF Filters
12.3.1.3. AFCs
12.3.1.4. Others
12.3.2. TV Sets
12.3.2.1. VCOs
12.3.2.2. RF Filters
12.3.2.3. AFCs
12.3.2.4. Others
12.3.3. Satellite Communication
12.3.3.1. VCOs
12.3.3.2. RF Filters
12.3.3.3. AFCs
12.3.3.4. Others
12.3.4. FM Radios
12.3.4.1. VCOs
12.3.4.2. RF Filters
12.3.4.3. AFCs
12.3.5. Others
12.4. South America Varactor Diode Market Size (US$ Mn and Million Units) Forecast, by Country/Sub-region, 2017–2027
12.4.1. Brazil
12.4.2. Rest of South America
12.5. South America Varactor Diode Market Attractiveness Analysis
12.5.1. by Product
12.5.2. by End-use Industry
12.5.3. by Country/Sub-region
13. Competition Landscape
13.1. Market Players – Competition Matrix
13.2. Global Varactor Diode Market Share (%), by Company (2018)
14. Company Profiles (Details – Overview, Financials, SWOT Analysis, Strategy)
14.1. NXP Semiconductor
14.1.1. Company Description
14.1.2. Business Overview
14.1.3. Financials
14.1.4. Strategic Overview
14.2. Skyworks Solution Inc.
14.2.1. Company Description
14.2.2. Business Overview
14.2.3. Financials
14.2.4. Strategic Overview
14.3. Infineon Technologies AG
14.3.1. Company Description
14.3.2. Business Overview
14.3.3. Financials
14.3.4. Strategic Overview
14.4. Microsemi Corporation
14.4.1. Company Description
14.4.2. Business Overview
14.4.3. Financials
14.4.4. Strategic Overview
14.5. MACOM Technology Solutions Holdings, Inc.
14.5.1. Company Description
14.5.2. Business Overview
14.5.3. Financials
14.5.4. Strategic Overview
14.6. Toshiba Corporation
14.6.1. Company Description
14.6.2. Business Overview
14.6.3. Financials
14.6.4. Strategic Overview
14.7. On Semiconductor
14.7.1. Company Description
14.7.2. Business Overview
14.7.3. Financials
14.7.4. Strategic Overview
14.8. ST Microelectronics
14.8.1. Company Description
14.8.2. Business Overview
14.8.3. Financials
14.8.4. Strategic Overview
14.9. ASI Semiconductor Inc.
14.9.1. Company Description
14.9.2. Business Overview
14.9.3. Financials
14.9.4. Strategic Overview
14.10. Murata Manufacturing Co., Ltd
14.10.1. Company Details
14.10.2. Company Description
14.10.3. Business Overview
14.10.4. Financials
14.10.5. Strategic Overview
15. Key Takeaways
List of Table
Table 01: Global Varactor Diode Market Revenue (US$ Mn) Forecast, by Product, 2017–2027
Table 02: Global Varactor Diode Market Volume (Million Units) Forecast, by Product, 2017–2027
Table 03: Global Varactor Diode Market Revenue (US$ Mn) Forecast, by Product, Mobile Phones, 2017–2027
Table 04: Global Varactor Diode Market Volume (Million Units) Forecast, by Product, Mobile Phones, 2017–2027
Table 05: Global Varactor Diode Market Revenue (US$ Mn) Forecast, by Product, TV Sets, 2017–2027
Table 06: Global Varactor Diode Market Volume (Million Units) Forecast, by Product, TV Sets, 2017–2027
Table 07: Global Varactor Diode Market Revenue (US$ Mn) Forecast, by Product, Satellite Communication, 2017–2027
Table 08: Global Varactor Diode Market Volume (Million Units) Forecast, by Product, Satellite Communication, 2017–2027
Table 09: Global Varactor Diode Market Revenue (US$ Mn) Forecast, by Product, FM Radios, 2017–2027
Table 10: Global Varactor Diode Market Volume (Million Units) Forecast, by Product, FM Radios, 2017–2027
Table 11: Global Varactor Diode Market Revenue (US$ Mn) Forecast, by End-use Industry, 2017–2027
Table 12: Global Varactor Diode Market Volume (Million Units) Forecast, by End-use Industry, 2017–2027
Table 13: Global Varactor Diode Market Revenue (US$ Mn) Forecast, by Region, 2017–2027
Table 14: Global Varactor Diode Market Volume (Million Units) Forecast, by Region, 2017–2027
Table 15: North America Varactor Diode Market Revenue (US$ Mn) Forecast, by Product, 2017–2027
Table 16: North America Varactor Diode Market Volume (Million Units) Forecast, by Product, 2017–2027
Table 17: North America Varactor Diode Market Revenue (US$ Mn) Forecast, by Product, Mobile Phones, 2017–2027
Table 18: North America Varactor Diode Market Volume (Million Units) Forecast, by Product, Mobile Phones, 2017–2027
Table 19: North America Varactor Diode Market Revenue (US$ Mn) Forecast, by Product, TV Sets, 2017–2027
Table 20: North America Varactor Diode Market Volume (Million Units) Forecast, by Product, TV Sets, 2017–2027
Table 21: North America Varactor Diode Market Revenue (US$ Mn) Forecast, by Product, Satellite Communication, 2017–2027
Table 22: North America Varactor Diode Market Volume (Million Units) Forecast, by Product, Satellite Communication, 2017–2027
Table 23: North America Varactor Diode Market Revenue (US$ Mn) Forecast, by Product, FM Radios, 2017–2027
Table 24: North America Varactor Diode Market Volume (Million Units) Forecast, by Product, FM Radios, 2017–2027
Table 25: North America Varactor Diode Market Revenue (US$ Mn) Forecast, by End-use Industry, 2017–2027
Table 26: North America Varactor Diode Market Volume (Million Units) Forecast, by End-use Industry, 2017–2027
Table 27: North America Varactor Diode Market Revenue (US$ Mn) Forecast, by Country/Sub-region, 2017–2027
Table 28: North America Varactor Diode Market Volume (Million Units) Forecast, by Country/Sub-region, 2017–2027
Table 29: Europe Varactor Diode Market Revenue (US$ Mn) Forecast, by Product, 2017–2027
Table 30: Europe Varactor Diode Market Volume (Million Units) Forecast, by Product, 2017–2027
Table 31: Europe Varactor Diode Market Revenue (US$ Mn) Forecast, by Product, Mobile Phones, 2017–2027
Table 32: Europe Varactor Diode Market Volume (Million Units) Forecast, by Product, Mobile Phones, 2017–2027
Table 33: Europe Varactor Diode Market Revenue (US$ Mn) Forecast, by Product, TV Sets, 2017–2027
Table 34: Europe Varactor Diode Market Volume (Million Units) Forecast, by Product, TV Sets, 2017–2027
Table 35: Europe Varactor Diode Market Revenue (US$ Mn) Forecast, by Product, Satellite Communication, 2017–2027
Table 36: Europe Varactor Diode Market Volume (Million Units) Forecast, by Product, Satellite Communication, 2017–2027
Table 37: Europe Varactor Diode Market Revenue (US$ Mn) Forecast, by Product, FM Radios, 2017–2027
Table 38: Europe Varactor Diode Market Volume (Million Units) Forecast, by Product, FM Radios, 2017–2027
Table 39: Europe Varactor Diode Market Revenue (US$ Mn) Forecast, by End-use Industry, 2017–2027
Table 40: Europe Varactor Diode Market Volume (Million Units) Forecast, by End-use Industry, 2017–2027
Table 41: Europe Varactor Diode Market Revenue (US$ Mn) Forecast, by Country/Sub-region, 2017–2027
Table 42: Europe Varactor Diode Market Volume (Million Units) Forecast, by Country/Sub-region, 2017–2027
Table 43: Asia Pacific Varactor Diode Market Revenue (US$ Mn) Forecast, by Product, 2017–2027
Table 44: Asia Pacific Varactor Diode Market Volume (Million Units) Forecast, by Product, 2017–2027
Table 45: Asia Pacific Varactor Diode Market Revenue (US$ Mn) Forecast, by Product, Mobile Phones, 2017–2027
Table 46: Asia Pacific Varactor Diode Market Volume (Million Units) Forecast, by Product, Mobile Phones, 2017–2027
Table 47: Asia Pacific Varactor Diode Market Revenue (US$ Mn) Forecast, by Product, TV Sets, 2017–2027
Table 48: Asia Pacific Varactor Diode Market Volume (Million Units) Forecast, by Product, TV Sets, 2017–2027
Table 49: Asia Pacific Varactor Diode Market Revenue (US$ Mn) Forecast, by Product, Satellite Communication, 2017–2027
Table 50: Asia Pacific Varactor Diode Market Volume (Million Units) Forecast, by Product, Satellite Communication, 2017–2027
Table 51: Asia Pacific Varactor Diode Market Revenue (US$ Mn) Forecast, by Product, FM Radios, 2017–2027
Table 52: Asia Pacific Varactor Diode Market Volume (Million Units) Forecast, by Product, FM Radios, 2017–2027
Table 53: Asia Pacific Varactor Diode Market Revenue (US$ Mn) Forecast, by End-use Industry, 2017–2027
Table 54: Asia Pacific Varactor Diode Market Volume (Million Units) Forecast, by End-use Industry, 2017–2027
Table 55: Asia Pacific Varactor Diode Market Revenue (US$ Mn) Forecast, by Country/Sub-region, 2017–2027
Table 56: Asia Pacific Varactor Diode Market Volume (Million Units) Forecast, by Country/Sub-region, 2017–2027
Table 57: Middle East & Africa Varactor Diode Market Revenue (US$ Mn) Forecast, by Product, 2017–2027
Table 58: Middle East & Africa Varactor Diode Market Volume (Million Units) Forecast, by Product, 2017–2027
Table 59: Middle East & Africa Varactor Diode Market Revenue (US$ Mn) Forecast, by Product, Mobile Phones, 2017–2027
Table 60: Middle East & Africa Varactor Diode Market Volume (Million Units) Forecast, by Product, Mobile Phones, 2017–2027
Table 61: Middle East & Africa Varactor Diode Market Revenue (US$ Mn) Forecast, by Product, TV Sets, 2017–2027
Table 62: Middle East & Africa Varactor Diode Market Volume (Million Units) Forecast, by Product, TV Sets, 2017–2027
Table 63: Middle East & Africa Varactor Diode Market Revenue (US$ Mn) Forecast, by Product, Satellite Communication, 2017–2027
Table 64: Middle East & Africa Varactor Diode Market Volume (Million Units) Forecast, by Product, Satellite Communication, 2017–2027
Table 65: Middle East & Africa Varactor Diode Market Revenue (US$ Mn) Forecast, by Product, FM Radios, 2017–2027
Table 66: Middle East & Africa Varactor Diode Market Volume (Million Units) Forecast, by Product, FM Radios, 2017–2027
Table 67: Middle East & Africa Varactor Diode Market Revenue (US$ Mn) Forecast, by End-use Industry, 2017–2027
Table 68: Middle East & Africa Varactor Diode Market Volume (Million Units) Forecast, by End-use Industry, 2017–2027
Table 69: Middle East & Africa Varactor Diode Market Revenue (US$ Mn) Forecast, by Country/Sub-region, 2017–2027
Table 70: Middle East & Africa Varactor Diode Market Volume (Million Units) Forecast, by Country/Sub-region, 2017–2027
Table 71: South America Varactor Diode Market Revenue (US$ Mn) Forecast, by Product, 2017–2027
Table 72: South America Varactor Diode Market Volume (Million Units) Forecast, by Product, 2017–2027
Table 73: South America Varactor Diode Market Revenue (US$ Mn) Forecast, by Product, Mobile Phones, 2017–2027
Table 74: South America Varactor Diode Market Volume (Million Units) Forecast, by Product, Mobile Phones, 2017–2027
Table 75: South America Varactor Diode Market Revenue (US$ Mn) Forecast, by Product, TV Sets, 2017–2027
Table 76: South America Varactor Diode Market Volume (Million Units) Forecast, by Product, TV Sets, 2017–2027
Table 77: South America Varactor Diode Market Revenue (US$ Mn) Forecast, by Product, Satellite Communication, 2017–2027
Table 78: South America Varactor Diode Market Volume (Million Units) Forecast, by Product, Satellite Communication, 2017–2027
Table 79: South America Varactor Diode Market Revenue (US$ Mn) Forecast, by Product, FM Radios, 2017–2027
Table 80: South America Varactor Diode Market Volume (Million Units) Forecast, by Product, FM Radios, 2017–2027
Table 81: South America Varactor Diode Market Revenue (US$ Mn) Forecast, by End-use Industry, 2017–2027
Table 82: South America Varactor Diode Market Volume (Million Units) Forecast, by End-use Industry, 2017–2027
Table 83: South America Varactor Diode Market Revenue (US$ Mn) Forecast, by Country/Sub-region, 2017–2027
Table 84: South America Varactor Diode Market Volume (Million Units) Forecast, by Country/Sub-region, 2017–2027
List of Figure
Figure 01: Global Varactor Diode Market Revenue (US$ Mn) Forecast and Y-o-Y Growth Projection, 2017–2027
Figure 02: Global Varactor Diode Market Volume (Million Units) Forecast and Y-o-Y Growth Projection, 2017–2027
Figure 03: Porter’s Five Forces Analysis
Figure 04: Value Chain Analysis
Figure 05: Global Varactor Diode Market Revenue (US$ Mn)
Figure 06: Global Varactor Diode Market, by Product (2019)
Figure 07: Global Varactor Diode Market, by End-use Industry (2019)
Figure 08: Global Varactor Diode Market Value Share Analysis, by Product, 2019 and 2027
Figure 09: Global Varactor Diode Market, by Product, Mobile Phones
Figure 10: Global Varactor Diode Market, by Product, TV Sets
Figure 11: Global Varactor Diode Market, by Product, Satellite Communication
Figure 12: Global Varactor Diode Market, by Product, FM Radios
Figure 13: Global Varactor Diode Market, by Product, Others
Figure 14: Segment Growth Matrix, 2019–2027 (%)
Figure 15: Segment Revenue Contribution, 2019–2027 (%)
Figure 16: Segment Compounded Growth Matrix (CAGR %)
Figure 17: Global Varactor Diode Market Attractiveness Analysis, by Product
Figure 18: Global Varactor Diode Market Value Share Analysis, by End-use Industry, 2019 and 2027
Figure 19: Global Varactor Diode Market, by End-use Industry, Consumer Electronics
Figure 20: Global Varactor Diode Market, by End-use Industry, Automotive
Figure 21: Global Varactor Diode Market, by End-use Industry, Aerospace & Defense
Figure 22: Global Varactor Diode Market, by End-use Industry, Others
Figure 23: Segment Growth Matrix, 2019–2027 (%)
Figure 24: Segment Revenue Contribution, 2019–2027 (%)
Figure 25: Segment Compounded Growth Matrix (CAGR %)
Figure 26: Global Varactor Diode Market Attractiveness Analysis, by End-use Industry
Figure 27: Global Varactor Diode Market, by Region, North America
Figure 28: Global Varactor Diode Market, by Region, Europe
Figure 29: Global Varactor Diode Market, by Region, Asia Pacific
Figure 30: Global Varactor Diode Market, by Region, Middle East & Africa
Figure 31: Global Varactor Diode Market, by Region, South America
Figure 32: Global Varactor Diode Market Attractiveness Analysis, by Region
Figure 33: North America Varactor Diode Market Revenue (US$ Mn) Forecast, 2017–2027
Figure 34: North America Varactor Diode Market Revenue Y-o-Y Growth Projection, 2017–2027
Figure 35: North America Varactor Diode Market Volume (Million Units) Forecast, 2017–2027
Figure 36: North America Varactor Diode Market Volume Y-o-Y Growth Projection, 2017–2027
Figure 37: North America Varactor Diode Market Value Share Analysis, by Product, 2019 and 2027
Figure 38: North America Varactor Diode Market Value Share Analysis, by End-use Industry, 2019 and 2027
Figure 39: North America Varactor Diode Market Value Share Analysis, by Country/Sub-region, 2018 and 2026
Figure 40: North America Varactor Diode Market Attractiveness Analysis, by Product
Figure 41: North America Varactor Diode Market Attractiveness Analysis, by End-use Industry
Figure 42: North America Varactor Diode Market Attractiveness Analysis, by Country/Sub-region
Figure 43: Europe Varactor Diode Market Revenue (US$ Mn) Forecast, 2017–2027
Figure 44: Europe Varactor Diode Market Revenue Y-o-Y Growth Projection, 2017–2027
Figure 45: Europe Varactor Diode Market Volume (Million Units) Forecast, 2017–2027
Figure 46: Europe Varactor Diode Market Volume Y-o-Y Growth Projection, 2017–2027
Figure 47: Europe Varactor Diode Market Value Share Analysis, by Product, 2019 and 2027
Figure 48: Europe Varactor Diode Market Value Share Analysis, by End-use Industry, 2019 and 2027
Figure 49: Europe Varactor Diode Market Value Share Analysis, by Country/Sub-region, 2018 and 2026
Figure 50: Europe Varactor Diode Market Attractiveness Analysis, by Product
Figure 51: Europe Varactor Diode Market Attractiveness Analysis, by End-use Industry
Figure 52: Europe Varactor Diode Market Attractiveness Analysis, by Country/Sub-region
Figure 53: Asia Pacific Varactor Diode Market Revenue (US$ Mn) Forecast, 2017–2027
Figure 54: Asia Pacific Varactor Diode Market Revenue Y-o-Y Growth Projection, 2017–2027
Figure 55: Asia Pacific Varactor Diode Market Volume (Million Units) Forecast, 2017–2027
Figure 56: Asia Pacific Varactor Diode Market Volume Y-o-Y Growth Projection, 2017–2027
Figure 57: Asia Pacific Varactor Diode Market Value Share Analysis, by Product, 2019 and 2027
Figure 58: Asia Pacific Varactor Diode Market Value Share Analysis, by End-use Industry, 2019 and 2027
Figure 59: Asia Pacific Varactor Diode Market Value Share Analysis, by Country/Sub-region, 2018 and 2026
Figure 60: Asia Pacific Varactor Diode Market Attractiveness Analysis, by Product
Figure 61: Asia Pacific Varactor Diode Market Attractiveness Analysis, by End-use Industry
Figure 62: Asia Pacific Varactor Diode Market Attractiveness Analysis, by Country/Sub-region Product
Figure 63: Middle East & Africa Varactor Diode Market Revenue (US$ Mn) Forecast, 2017–2027
Figure 64: Middle East & Africa Varactor Diode Market Revenue Y-o-Y Growth Projection, 2017–2027
Figure 65: Middle East & Africa Varactor Diode Market Volume (Million Units) Forecast, 2017–2027
Figure 66: Middle East & Africa Varactor Diode Market Volume Y-o-Y Growth Projection, 2017–2027
Figure 67: Middle East & Africa Varactor Diode Market Value Share Analysis, by Product, 2019 and 2027
Figure 68: Middle East & Africa Varactor Diode Market Value Share Analysis, by End-use Industry, 2019 and 2027
Figure 69: Middle East & Africa Varactor Diode Market Value Share Analysis, by Country/Sub-region, 2018 and 2026
Figure 70: Middle East & Africa Varactor Diode Market Attractiveness Analysis, by Product
Figure 71: Middle East & Africa Varactor Diode Market Attractiveness Analysis, by End-use Industry
Figure 72: Middle East & Africa Varactor Diode Market Attractiveness Analysis, by Country/Sub-region
Figure 73: South America Varactor Diode Market Revenue (US$ Mn) Forecast, 2017–2027
Figure 74: South America Varactor Diode Market Revenue Y-o-Y Growth Projection, 2017–2027
Figure 75: South America Varactor Diode Market Volume (Million Units) Forecast, 2017–2027
Figure 76: South America Varactor Diode Market Volume Y-o-Y Growth Projection, 2017–2027
Figure 77: South America Varactor Diode Market Value Share Analysis, by Product, 2019 and 2027
Figure 78: South America Varactor Diode Market Value Share Analysis, by End-use Industry, 2019 and 2027
Figure 79: South America Varactor Diode Market Value Share Analysis, by Country/Sub-region, 2018 and 2026
Figure 80: South America Varactor Diode Market Attractiveness Analysis, by Product
Figure 81: South America Varactor Diode Market Attractiveness Analysis, by End-use Industry
Figure 82: South America Varactor Diode Market Attractiveness Analysis, by Country/Sub-region Product
Figure 83: Global Varactor Diode Market Share Analysis, by Company
Copyright © Transparency Market Research, Inc. All Rights reserved
Trust Online

Varactor Diode Market