
Reports
Reports
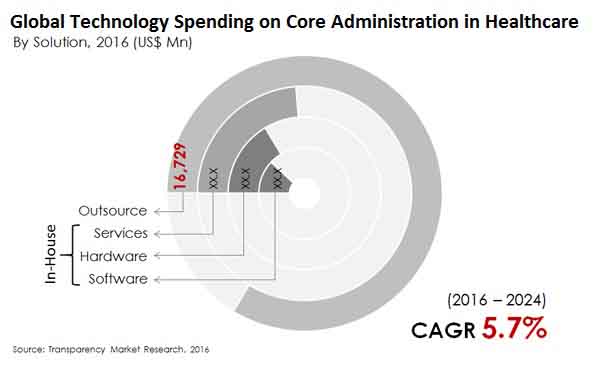
Global Technology Spending on Core Administration in Healthcare: Snapshot
The healthcare industry has witnessed a huge transformation from principally paper-based and manually-operated procedures to digitally-enabled connected processes and operations in the past few years. Factors such as growing government interventions to encourage technology-driven affordable healthcare services and improving healthcare infrastructure across developing countries have led to a vast rise in the money spent on making core administration in the healthcare sector technologically-rich and more effective. Moreover, rising patient-base across the globe and increasing healthcare spending will drive the need to outsource IT solutions for optimal healthcare management and a greater focus on core administrative operations.
Transparency Market Research states that in terms of value, the global technology spending on core administration in healthcare will increase at a CAGR of over 5.7% during the period between 2016 and 2024.
Healthcare Payers Take Lion’s Share in Global Spending on Technology on Core Administration
On the basis of end users, the global technology spending on core administration in healthcare market is segmented into payers and providers. The payer segment is further divided into insurance companies, and government whereas the provider segment is further segmented into hospitals and other providers.
The payers segment accounted for the larger chunk of spending on core administration in healthcare, holding a nearly 88% of the overall market in 2015. The segment is also expected to remain the most lucrative end-user segment over the forecast period, with the segment expected to exhibit a 5.9% CAGR over the period between 2016 and 2024. The usage of a variety of data management and processing solutions for core administrative services such as fraud detection, claim management, and research and development has significantly increased across private and public insurance companies and government agencies in the past years.
The trend is expected to remain strong over the forecast period as well, with the payer end-use segment accounting for over 89% of the total spending on technology for core administration across the healthcare sector over the forecast period. Spending on technology for core administration across healthcare providers such as hospitals is expected to expand at a 4.4% CAGR from 2016 through 2024.
North America to Continue to Remain Leading Spender
Geographically, North America is the leading spender on technology for core administration in healthcare. Of the total funds devoted for making core administration technology-rich in the healthcare industry, over 50% were spent in North America. The region is expected to remain ahead of other regional markets in terms of technology spending the core administration in the healthcare sector over the forecast period as well. Factors such as rising scarcity of resources for undertaking patient-centric processes and the lack of technologically skilled healthcare staff for managing administrative processes will play a key role in highlighting the need for technological optimization of healthcare processes in the region.
North America is a steadily growing market, but will continue to account for a bigger stake compared to other regional markets, expanding at a 5.7% CAGR from 2016 through 2024. Asia Pacific will emerge as the most promising investment destination for technology in core administration for the healthcare industry over the said period. Technology spending in this area will swell at a promising 6.7% CAGR from 2016 to 2024 in Asia Pacific.
The region has emerged as the IT outsourcing destination due to growing public–private funding structures and low in-house expertise for healthcare IT. The robust and active medical tourism industry, rising spending power of the consumer on technologically advanced services, and rising international investments in the healthcare industry will continue to drive spending on technology in the Asia Pacific healthcare sector.
Some of the players in the global core administration system in healthcare are Plexis Healthcare Systems, DST Systems, Inc., HealthEdge Software, Inc., ikaSystems Corporation, TriZetto Corporation, Health Solutions Plus, Inc., Aldera Holdings, Inc., Wonderbox Technologies, UPP Technology, Inc., and HealthAxis Group, LLC.
High Investment on Technology in the Healthcare Sector to Benefit Technology Spending on Core Administration in Healthcare Market
Over the next few years, the global demand for technology investment on healthcare core administration is projected to expand at a healthy pace. In recent years, the healthcare sector has undergone major changes, and a range of measures have been initiated to keep the industry afloat. Technology advances have assisted in the development of many countries' healthcare metrics. It is clear that advances in healthcare have resulted from a wide range of improvements in the sector's infrastructure, institutional structure, and technical environment. As disease rates rise, better administrative facilities are becoming increasingly important for managing large groups of patients. Clinics and hospitals are eager to implement hacks that are likely to assist them in successfully treating patients. This is a critical point for the growth of the global technology spending on core administration in healthcare market, thereby fuelling demand for the same in the years to come. The increasing healthcare spending and burgeoning population have necessitated a versatile IT infrastructure capable of managing the industry's operations, which is predicted to work in favor of the global technology spending on core administration in healthcare market in near future.
Shift from Volume-based Model to Value-based Model to Leave Positive Impact on the Market
The amount of information available about patients' wellbeing and other aspects of the healthcare industry is enormous. It is essential for health care industry to handle all of this information in order to better medical treatments and facilities. As a result, the requirement for IT outsourcing for data processing has arisen, and many healthcare centres choose to store their data at IT solution hubs. This has increased consumer demand and provided market participants with potential for advancement. In addition, there have been significant changes in the reimbursement policies for medical treatments, which necessitate a robust core administration. Consumers are more and more reliant on digital technology in the contemporary situation, which is also a trend in healthcare industry. The insurance companies are making every effort to persuade the healthcare industry to move from a volume model to a value-based model for reimbursement in a high price competition scenario. This is likely to expose healthcare providers to financial threats, pushing up demand for core administration. These factors are likely to work in favor of the global technology spending on core administration in healthcare market in years to come.
Technology spending on core administration in healthcare market was valued at US$25,900 mn in 2015 and is estimated to attain US$42,317 mn by 2024
Technology spending on core administration in healthcare market will increase at a CAGR of over 5.7% during the period between 2016 and 2024
Technology spending on core administration in healthcare market is driven by rising patient-base across the globe and increasing healthcare spending
North America dominates the technology spending on core administration in healthcare market and is expected to lead along the forecast period
key players in the global technology spending on core administration in healthcare market include Plexis Healthcare Systems, HealthEdge Software, Inc., DST Systems, Inc., ikaSystems Corporation, Health Solutions Plus, Inc., and TriZetto Corporation
1. Preface
1.1. Market Definition and Scope
1.2. Market Segmentation
1.3. Key Research Objectives
1.4. Research Highlights
2. Assumptions and Research Methodology
3. Executive Summary : Global Technology Spending on Core Administration in Healthcare
4. Market Overview
4.1. Introduction
4.1.1. Solution Definition
4.1.2. Industry Evolution / Developments
4.2. Overview
4.3. Key Indicators
4.4. Key Industry Developments
4.5. Market Opportunity Map
4.6. Market Dynamics
4.6.1. Drivers
4.6.2. Restraints
4.6.3. Opportunity
4.7. Global Technology Spending on Core Administration in Healthcare Analysis and Forecasts, 2016–2024
4.7.1. Market Revenue Projections (US$ Mn)
4.8. Porter’s Five Force Analysis
4.9. Core Administration: Workflow
4.10.Market Outlook
5. Global Technology Spending on Core Administration in Healthcare Analysis and Forecasts, By Solution
5.1. Introduction & Definition
5.2. Key Findings / Developments
5.3. Key Trends
5.4. Market Value Forecast By Solution, 2016–2024
5.4.1. In-House
5.4.1.1. Hardware
5.4.1.2. Software
5.4.1.3. Services
5.4.2. Outsource
5.5. Solution Comparison Matrix
5.6. Market Attractiveness By Solution
6. Global Technology Spending on Core Administration in Healthcare Analysis and Forecasts, By End User
6.1. Introduction & Definition
6.2. Key Findings / Developments
6.3. Market Value Forecast By End User, 2016–2024
6.3.1. Payer
6.3.1.1. Insurance Companies
6.3.1.2. Government
6.3.1.3. Others
6.3.2. Provider
6.3.2.1. Hospitals
6.3.2.2. Others
6.4. End User Comparison Matrix
6.5. Market Attractiveness By End User
7. Global Technology Spending on Core Administration in Healthcare Analysis and Forecasts, By Deployment
7.1. Introduction & Definition
7.2. Key Findings / Developments
7.3. Market Value Forecast By Deployment, 2016–2024
7.3.1. Cloud-Based
7.3.2. On-Premise
7.4. Deployment Comparison Matrix
7.5. Market Attractiveness By Deployment
8. Global Technology Spending on Core Administration in Healthcare Analysis and Forecasts, By Region
8.1. Key Findings
8.2. Policies and Regulations
8.3. Market Value Forecast By Region
8.3.1. North America
8.3.2. Latin America
8.3.3. Asia Pacific
8.3.4. Europe
8.3.5. Middle East and Africa
8.4. Market Attractiveness By Country
9. North America Technology Spending on Core Administration in Healthcare Analysis and Forecast
9.1. Introduction
9.1.1. Key Findings
9.1.2. Policies and Regulations
9.1.3. Price Trend Analysis
9.2. Market Value Forecast By Solution, 2016–2024
9.2.1. In-House
9.2.1.1. Hardware
9.2.1.2. Software
9.2.1.3. Services
9.2.2. Outsource
9.3. Market Value Forecast By End User, 2016–2024
9.3.1. Payer
9.3.1.1. Insurance Companies
9.3.1.2. Government
9.3.1.3. Others
9.3.2. Provider
9.3.2.1. Hospitals
9.3.2.2. Others
9.4. Market Value Forecast By Deployment, 2016–2024
9.4.1. Cloud-Based
9.4.2. On-Premise
9.5. Market Value Forecast By Country, 2016–2024
9.5.1. US
9.5.2. Canada
9.6. Market Attractiveness Analysis
9.6.1. By Solution
9.6.2. By End User
9.6.3. By Deployment
9.6.4. By Country
10. Latin America Technology Spending on Core Administration in Healthcare Analysis and Forecast
10.1.Introduction
10.1.1. Key Findings
10.1.2. Policies and Regulations
10.1.3. Price Trend Analysis
10.2.Market Value Forecast By Solution, 2016–2024
10.2.1. In-House
10.2.1.1. Hardware
10.2.1.2. Software
10.2.1.3. Services
10.2.2. Outsource
10.3.Market Value Forecast By End User, 2016–2024
10.3.1. Payer
10.3.1.1. Insurance Companies
10.3.1.2. Government
10.3.1.3. Others
10.3.2. Provider
10.3.2.1. Hospitals
10.3.2.2. Others
10.4.Market Value Forecast By Deployment, 2016–2024
10.4.1. Cloud-Based
10.4.2. On-Premise
10.5.Market Value Forecast By Country, 2016–2024
10.5.1. Brazil
10.5.2. Mexico
10.5.3. Rest of Latin America
10.6. Market Attractiveness Analysis
10.6.1. By Solution
10.6.2. By End User
10.6.3. By Deployment
10.6.4. By Country
11. Asia Pacific Technology Spending on Core Administration in Healthcare Analysis and Forecast
11.1.Introduction
11.1.1. Key Findings
11.1.2. Policies and Regulations
11.1.3. Price Trend Analysis
11.2.Market Value Forecast By Solution, 2016–2024
11.2.1. In-House
11.2.1.1. Hardware
11.2.1.2. Software
11.2.1.3. Services
11.2.2. Outsource
11.3.Market Value Forecast By End User, 2016–2024
11.3.1. Payer
11.3.1.1. Insurance Companies
11.3.1.2. Government
11.3.1.3. Others
11.3.2. Provider
11.3.2.1. Hospitals
11.3.2.2. Others
11.4.Market Value Forecast By Deployment, 2016–2024
11.4.1. Cloud-Based
11.4.2. On-Premise
11.5.Market Value Forecast By Country, 2016–2024
11.5.1. Japan
11.5.2. China
11.5.3. India
11.5.4. Australia
11.5.5. New Zealand
11.5.6. Rest of Asia Pacific
11.6. Market Attractiveness Analysis
11.6.1. By Solution
11.6.2. By End User
11.6.3. By Deployment
11.6.4. By Country
12. Europe Technology Spending on Core Administration in Healthcare Analysis and Forecast
12.1.Introduction
12.1.1. Key Findings
12.1.2. Policies and Regulations
12.1.3. Price Trend Analysis
12.2.Market Value Forecast By Solution, 2016–2024
12.2.1. In-House
12.2.1.1. Hardware
12.2.1.2. Software
12.2.1.3. Services
12.2.2. Outsource
12.3.Market Value Forecast By End User, 2016–2024
12.3.1. Payer
12.3.1.1. Insurance Companies
12.3.1.2. Government
12.3.1.3. Others
12.3.2. Provider
12.3.2.1. Hospitals
12.3.2.2. Others
12.4.Market Value Forecast By Deployment, 2016–2024
12.4.1. Cloud-Based
12.4.2. On-Premise
12.5.Market Value Forecast By Country, 2016–2024
12.5.1. Germany
12.5.2. UK
12.5.3. France
12.5.4. Italy
12.5.5. Spain
12.5.6. Rest of Europe
12.6. Market Attractiveness Analysis
12.6.1. By Solution
12.6.2. By End User
12.6.3. By Deployment
12.6.4. By Country
13. Middle East and Africa Technology Spending on Core Administration in Healthcare Analysis and Forecast
13.1.Introduction
13.1.1. Key Findings
13.1.2. Policies and Regulations
13.1.3. Price Trend Analysis
13.2.Market Value Forecast By Solution, 2016–2024
13.2.1. In-House
13.2.1.1. Hardware
13.2.1.2. Software
13.2.1.3. Services
13.2.2. Outsource
13.3.Market Value Forecast By End User, 2016–2024
13.3.1. Payer
13.3.1.1. Insurance Companies
13.3.1.2. Government
13.3.1.3. Others
13.3.2. Provider
13.3.2.1. Hospitals
13.3.2.2. Others
13.4.Market Value Forecast By Deployment, 2016–2024
13.4.1. Cloud-Based
13.4.2. On-Premise
13.5.Market Value Forecast By Country, 2016–2024
13.5.1. Saudi Arabia
13.5.2. UAE
13.5.3. RSA
13.5.4. Rest of Middle East and Africa
13.6. Market Attractiveness Analysis
13.6.1. By Solution
13.6.2. By End User
13.6.3. By Deployment
13.6.4. By Country
14. Competition Landscape
14.1.Market Player – Competition Matrix (By Tier and Size of companies)
14.2.Major Licenses and Contracts
14.3.Company Profiles (Details – Overview, Financials, Recent Developments, Strategy)
14.3.1. Plexis Healthcare Systems
14.3.1.1 Overview
14.3.1.2 Financials
14.3.1.3 SWOT Analysis
14.3.1.4 Strategic Overview
14.3.2. DST Systems, Inc.
14.3.2.1 Overview
14.3.2.2 Financials
14.3.2.3 SWOT Analysis
14.3.2.4 Strategic Overview
14.3.3. HealthEdge Software, Inc.
14.3.3.1 Overview
14.3.3.2 Financials
14.3.3.3 SWOT Analysis
14.3.3.4 Strategic Overview
14.3.4. ikaSystems Corporation
14.3.4.1 Overview
14.3.4.2 Financials
14.3.4.3 SWOT Analysis
14.3.4.4 Strategic Overview
14.3.5. TriZetto Corporation
14.3.5.1 Overview
14.3.5.2 Financials
14.3.5.3 SWOT Analysis
14.3.5.4 Strategic Overview
14.3.6. Health Solutions Plus, Inc.
14.3.6.1 Overview
14.3.6.2 Financials
14.3.6.3 SWOT Analysis
14.3.6.4 Strategic Overview
14.3.7. Aldera Holdings, Inc.
14.3.7.1 Overview
14.3.7.2 Financials
14.3.7.3 SWOT Analysis
14.3.7.4 Strategic Overview
14.3.8. Wonderbox Technologies
14.3.8.1 Overview
14.3.8.2 Financials
14.3.8.3 SWOT Analysis
14.3.8.4 Strategic Overview
14.3.9. HealthAxis Group, LLC.
14.3.9.1 Overview
14.3.9.2 Financials
14.3.9.3 SWOT Analysis
14.3.9.4 Strategic Overview
14.3.10. UPP Technology, Inc.
14.3.10.1 Overview
14.3.10.2 Financials
14.3.10.3 SWOT Analysis
14.3.10.4 Strategic Overview
List of Tables
Table 01: Global Technology Spending on Core Administration in Healthcare (US$ Mn) Forecast, By Solution, 2016–2024
Table 02: Global Technology Spending on Core Administration in Healthcare (US$ Mn) Forecast, By Solution (In-House), 2016–2024
Table 03: Global Technology Spending on Core Administration in Healthcare (US$ Mn) Forecast, By Deployment, 2016–2024
Table 04: Global Technology Spending on Core Administration in Healthcare (US$ Mn) Forecast, By End User, 2016–2024
Table 05: Global Technology Spending on Core Administration in Healthcare (US$ Mn) Forecast, By End User (Payer), 2016–2024
Table 06: Global Technology Spending on Core Administration in Healthcare (US$ Mn) Forecast, By End User (Provider), 2016–2024
Table 07: Global Technology Spending on Core Administration in Healthcare (US$ Mn) Forecast, By Region, 2016–2024
Table 08: North America Technology Spending on Core Administration in Healthcare (US$ Mn) Forecast, By Solution, 2016–2024
Table 09: North America Technology Spending on Core Administration in Healthcare (US$ Mn) Forecast, By Solution (In-House), 2016–2024
Table 10: North America Technology Spending on Core Administration in Healthcare (US$ Mn) Forecast, By Deployment 2016–2024
Table 11: North America Technology Spending on Core Administration in Healthcare (US$ Mn) Forecast, By End User 2016–2024
Table 12: North America Technology Spending on Core Administration in Healthcare (US$ Mn) Forecast, By, End User (Payer) 2016–2024
Table 13: North America Technology Spending on Core Administration in Healthcare (US$ Mn) Forecast, By End User (Provider) 2016–2024
Table 14: North America Technology Spending on Core Administration in Healthcare (US$ Mn) Forecast, By Country, 2016–2024
Table 15: Europe Technology Spending on Core Administration in Healthcare (US$ Mn) Forecast, By Solution, 2016–2024
Table 16: Europe Technology Spending on Core Administration in Healthcare (US$ Mn) Forecast, By Solution (In-House), 2016–2024
Table 17: Europe Technology Spending on Core Administration in Healthcare (US$ Mn) Forecast, By Deployment, 2016–2024
Table 18: Europe Technology Spending on Core Administration in Healthcare (US$ Mn) Forecast, By End User, 2016–2024
Table 19: Europe Technology Spending on Core Administration in Healthcare (US$ Mn) Forecast, By End User (Payer), 2016–2024
Table 20: Europe Technology Spending on Core Administration in Healthcare (US$ Mn) Forecast, By End User (Provider), 2016–2024
Table 21: Europe Technology Spending on Core Administration in Healthcare (US$ Mn) Forecast, By Country, 2016–2024
Table 22: Asia Pacific Technology Spending on Core Administration in Healthcare (US$ Mn) Forecast, By Solution, 2016–2024
Table 23: Asia Pacific Technology Spending on Core Administration in Healthcare (US$ Mn) Forecast, By Solution (In-House), 2016–2024
Table 24: Asia Pacific Technology Spending on Core Administration in Healthcare (US$ Mn) Forecast, By Deployment, 2016–2024
Table 25: Asia Pacific Technology Spending on Core Administration in Healthcare (US$ Mn) Forecast, By End User, 2016–2024
Table 26: Asia Pacific Technology Spending on Core Administration in Healthcare (US$ Mn) Forecast, By End User (Payer), 2016–2024
Table 27: Asia Pacific Technology Spending on Core Administration in Healthcare (US$ Mn) Forecast, By End User (Provider), 2016–2024
Table 28: Asia Pacific Technology Spending on Core Administration in Healthcare (US$ Mn) Forecast, By Country, 2016–2024
Table 29: Latin America Technology Spending on Core Administration in Healthcare (US$ Mn) Forecast, By Solution, 2016–2024
Table 30: Latin America Technology Spending on Core Administration in Healthcare (US$ Mn) Forecast, By Solution (In-House), 2016–2024
Table 31: Latin America Technology Spending on Core Administration in Healthcare (US$ Mn) Forecast, By Deployment, 2016–2024
Table 32: Latin America Technology Spending on Core Administration in Healthcare (US$ Mn) Forecast, By End User, 2016–2024
Table 33: Latin America Technology Spending on Core Administration in Healthcare (US$ Mn) Forecast, By End User (Payer), 2016–2024
Table 34: Latin America Technology Spending on Core Administration in Healthcare (US$ Mn) Forecast, By End User (Provider), 2016–2024
Table 35: Latin America Technology Spending on Core Administration in Healthcare (US$ Mn) Forecast, By Country, 2016–2024
Table 36: Middle East and Africa Technology Spending on Core Administration in Healthcare (US$ Mn) Forecast, By Solution, 2016–2024
Table 37: Middle East and Africa Technology Spending on Core Administration in Healthcare (US$ Mn) Forecast, By Solution (In-House), 2016–2024
Table 38: Middle East and Africa Technology Spending on Core Administration in Healthcare (US$ Mn) Forecast, By Deployment, 2016–2024
Table 39: Middle East and Africa Technology Spending on Core Administration in Healthcare (US$ Mn) Forecast, By End User, 2016–2024
Table 40: Middle East and Africa Technology Spending on Core Administration in Healthcare (US$ Mn) Forecast, By End User (Payer), 2016–2024
Table 41: Middle East and Africa Technology Spending on Core Administration in Healthcare (US$ Mn) Forecast, By End User (Provider), 2016–2024
Table 42: Middle East and Africa Technology Spending on Core Administration in Healthcare (US$ Mn) Forecast, By Country, 2016–2024
List of Figures
Figure 1: Global Technology Spending on Core Administration in Healthcare (US$ Mn) Forecast, 2016–2024
Figure 2: Global Technology Spending on Core Administration in Healthcare Value Share Analysis By Solutions, 2016 and 2024
Figure 3: Global Technology Spending on In-House Core Administration Solution in Healthcare Value (US$ Mn) and Y-o-Y Growth (%), 2016–2024
Figure 4: Global Technology Spending on Outsource Core Administration Solution in Healthcare Value (US$ Mn) and Y-o-Y Growth (%), 2016–2024
Figure 5: Global Technology Spending on Core Administration in Healthcare Attractiveness Analysis By Solution
Figure 6: Global Technology Spending on Hardware Value (US$ Mn) and Y-o-Y Growth (%), 2016–2024
Figure 7: Global Technology Spending on Software Value (US$ Mn) and Y-o-Y Growth (%), 2016–2024
Figure 8: Global Technology Spending on Services Value (US$ Mn) and Y-o-Y Growth (%), 2016–2024
Figure 9: Global Technology Spending on Core Administration in Healthcare Attractiveness Analysis By In-House Solutions
Figure 10: Global Technology Spending on Core Administration in Healthcare Value Share Analysis By Deployment, 2016 and 2024
Figure 11: Global Technology Spending on Cloud-Based Core Administration Deployment in Healthcare Value (US$ Mn) and Y-o-Y Growth (%), 2016–2024
Figure 12: Global Technology Spending on On-Premise Core Administration Deployment in Healthcare Value (US$ Mn) and Y-o-Y Growth (%), 2016–2024
Figure 13: Global Technology Spending on Core Administration in Healthcare Attractiveness Analysis By Deployment
Figure 14: Global Technology Spending on Core Administration in Healthcare Value Share Analysis By End User, 2016 and 2024
Figure 15: Global Technology Spending on Core Administration in Healthcare By Payer Value (US$ Mn) and Y-o-Y Growth (%), 2016–2024
Figure 16: Global Technology Spending on Core Administration in Healthcare By Provider Value (US$ Mn) and Y-o-Y Growth (%), 2016–2024
Figure 17: Global Technology Spending on Core Administration in Healthcare Attractiveness Analysis By End User
Figure 18: Global Technology Spending By Insurance Companies Value (US$ Mn) and Y-o-Y Growth (%), 2016–2024
Figure 19: Global Technology Spending By Government Value (US$ Mn) and Y-o-Y Growth (%), 2016–2024
Figure 20: Global Technology Spending By Others Value (US$ Mn) and Y-o-Y Growth (%), 2016–2024
Figure 21: Global Technology Spending on Core Administration in Healthcare Attractiveness Analysis By Payer
Figure 22: Global Technology Spending By Hospital Value (US$ Mn) and Y-o-Y Growth (%), 2016–2024
Figure 23: Global Technology Spending By Others Value (US$ Mn) and Y-o-Y Growth (%), 2016–2024
Figure 24: Global Technology Spending on Core Administration in Healthcare Attractiveness Analysis By Provider
Figure 25: Global Technology Spending on Core Administration in Healthcare Value Share Analysis By Region, 2016 and 2024
Figure 26: Global Technology Spending on Core Administration in Healthcare Attractiveness Analysis, By Region
Figure 27: North America Technology Spending on Core Administration in Healthcare (US$ Mn) Forecast, 2016–2024
Figure 28: North America Technology Spending on Core Administration in Healthcare Attractiveness Analysis By Country
Figure 29: North America Technology Spending on Core Administration in Healthcare Value Share Analysis By Solution, 2016 and 2024
Figure 30: North America Technology Spending on Core Administration in Healthcare Value Share Analysis By Deployment, 2016 and 2024
Figure 31: North America Technology Spending on Core Administration in Healthcare Value Share Analysis By End User, 2016 and 2024
Figure 32: North America Technology Spending on Core Administration in Healthcare Value Share Analysis By Country, 2016 and 2024
Figure 33: U.S. Technology Spending on Core Administration in Healthcare (US$ Mn) Forecast, 2016–2024
Figure 34: U.S. Technology Spending on Core Administration in Healthcare Absolute $ Opportunity (US$ Mn), 2016-2024
Figure 35: Canada Technology Spending on Core Administration in Healthcare (US$ Mn) Forecast, 2016–2024
Figure 36: Canada Technology Spending on Core Administration in Healthcare Absolute $ Opportunity (US$ Mn), 2016-2024
Figure 37: North America Technology Spending on Core Administration in Healthcare Attractiveness Analysis by Solution
Figure 38: North America Technology Spending on Core Administration in Healthcare Attractiveness Analysis by Deployment
Figure 39: North America Technology Spending on Core Administration in Healthcare Attractiveness Analysis by End User
Figure 40: Europe Technology Spending on Core Administration in Healthcare (US$ Mn) Forecast, 2016–2024
Figure 41: Europe Technology Spending on Core Administration in Healthcare Attractiveness Analysis By Country
Figure 42: Europe Technology Spending on Core Administration in Healthcare Value Share Analysis By Solution, 2016 and 2024
Figure 43: Europe Technology Spending on Core Administration in Healthcare Value Share Analysis By Deployment, 2016 and 2024
Figure 44: Europe Technology Spending on Core Administration in Healthcare Value Share Analysis By End User, 2016 and 2024
Figure 45: Europe Technology Spending on Core Administration in Healthcare Value Share Analysis By Country, 2016 and 2024
Figure 46: Germany Technology Spending on Core Administration in Healthcare (US$ Mn) Forecast, 2016–2024
Figure 47: Germany Technology Spending on Core Administration in Healthcare Absolute $ Opportunity (US$ Mn), 2016-2024
Figure 48: UK Technology Spending on Core Administration in Healthcare (US$ Mn) Forecast, 2016–2024
Figure 49: UK Technology Spending on Core Administration in Healthcare Absolute $ Opportunity (US$ Mn), 2016-2024
Figure 50: France Technology Spending on Core Administration in Healthcare (US$ Mn) Forecast, 2016–2024
Figure 51: France Technology Spending on Core Administration in Healthcare Absolute $ Opportunity (US$ Mn), 2016-2024
Figure 52: Italy Technology Spending on Core Administration in Healthcare (US$ Mn) Forecast, 2016–2024
Figure 53: Italy Technology Spending on Core Administration in Healthcare Absolute $ Opportunity (US$ Mn), 2016-2024
Figure 54: Spain Technology Spending on Core Administration in Healthcare (US$ Mn) Forecast, 2016–2024
Figure 55: Spain Technology Spending on Core Administration in Healthcare Absolute $ Opportunity (US$ Mn), 2016-2024
Figure 56: Rest of Europe Technology Spending on Core Administration in Healthcare (US$ Mn) Forecast, 2016–2024
Figure 57: Rest of Europe Technology Spending on Core Administration in Healthcare Absolute $ Opportunity (US$ Mn), 2016-2024
Figure 58: Europe Technology Spending on Core Administration in Healthcare Attractiveness Analysis by Solution
Figure 59: Europe Technology Spending on Core Administration in Healthcare Attractiveness Analysis by Deployment
Figure 60: Europe Technology Spending on Core Administration in Healthcare Attractiveness Analysis by End User
Figure 61: Asia Pacific Technology Spending on Core Administration in Healthcare (US$ Mn) Forecast, 2016–2024
Figure 62: Asia Pacific Technology Spending on Core Administration in Healthcare Attractiveness Analysis By Country
Figure 63: Asia Pacific Technology Spending on Core Administration in Healthcare Value Share Analysis By Solution, 2016 and 2024
Figure 64: Asia Pacific Core Administration in Healthcare Value Share Analysis By Deployment, 2016 and 2024
Figure 65: Asia Pacific Core Administration in Healthcare Value Share Analysis By End User, 2016 and 2024
Figure 66: Asia Pacific Technology Spending on Core Administration in Healthcare Value Share Analysis By Country, 2016 and 2024
Figure 67: China Technology Spending on Core Administration in Healthcare (US$ Mn) Forecast, 2016–2024
Figure 68: China Technology Spending on Core Administration in Healthcare Absolute $ Opportunity (US$ Mn), 2016-2024
Figure 69: Japan Technology Spending on Core Administration in Healthcare (US$ Mn) Forecast, 2016–2024
Figure 70: Japan Technology Spending on Core Administration in Healthcare Absolute $ Opportunity (US$ Mn), 2016-2024
Figure 71: India Technology Spending on Core Administration in Healthcare (US$ Mn) Forecast, 2016–2024
Figure 72: India Technology Spending on Core Administration in Healthcare Absolute $ Opportunity (US$ Mn), 2016-2024
Figure 73: Australia Technology Spending on Core Administration in Healthcare (US$ Mn) Forecast, 2016–2024
Figure 74: Australia Technology Spending on Core Administration in Healthcare Absolute $ Opportunity (US$ Mn), 2016-2024
Figure 75: New Zealand Technology Spending on Core Administration in Healthcare (US$ Mn) Forecast, 2016–2024
Figure 76: New Zealand Technology Spending on Core Administration in Healthcare Absolute $ Opportunity (US$ Mn), 2016-2024
Figure 77: Rest of Asia Pacific Technology Spending on Core Administration in Healthcare (US$ Mn) Forecast, 2016–2024
Figure 78: Rest of Asia Pacific Technology Spending on Core Administration in Healthcare Absolute $ Opportunity (US$ Mn), 2016-2024
Figure 79: Asia Pacific Technology Spending on Core Administration in Healthcare Attractiveness Analysis by Solution
Figure 80: Asia Pacific Technology Spending on Core Administration in Healthcare Attractiveness Analysis by Deployment
Figure 81: Asia Pacific Technology Spending on Core Administration in Healthcare Attractiveness Analysis by End User
Figure 82: Latin America Technology Spending on Core Administration in Healthcare (US$ Mn) Forecast, 2016–2024
Figure 83: Latin America Technology Spending on Core Administration in Healthcare Attractiveness Analysis By Country
Figure 84: Latin America Technology Spending on Core Administration in Healthcare Value Share Analysis By Solution, 2016 and 2024
Figure 85: Latin America Technology Spending on Core Administration in Healthcare Value Share Analysis By Deployment, 2016 and 2024
Figure 86: Latin America Technology Spending on Core Administration in Healthcare Value Share Analysis By End User, 2016 and 2024
Figure 87: Latin America Technology Spending on Core Administration in Healthcare Value Share Analysis By Country, 2016 and 2024
Figure 88: Brazil Technology Spending on Core Administration in Healthcare (US$ Mn) Forecast, 2016–2024
Figure 89: Brazil Technology Spending on Core Administration in Healthcare Absolute $ Opportunity (US$ Mn), 2016-2024
Figure 90: Mexico Technology Spending on Core Administration in Healthcare (US$ Mn) Forecast, 2016–2024
Figure 91: Mexico Technology Spending on Core Administration in Healthcare Absolute $ Opportunity (US$ Mn), 2016-2024
Figure 92: Rest of LATAM Technology Spending on Core Administration in Healthcare (US$ Mn) Forecast, 2016–2024
Figure 93: Rest of LATAM Technology Spending on Core Administration in Healthcare Absolute $ Opportunity (US$ Mn), 2016-2024
Figure 94: Latin America Technology Spending on Core Administration in Healthcare Attractiveness Analysis by Solution
Figure 95: Latin America Technology Spending on Core Administration in Healthcare Attractiveness Analysis by Deployment
Figure 96: Latin America Technology Spending on Core Administration in Healthcare Attractiveness Analysis by End User
Figure 97: Middle East and Africa Technology Spending on Core Administration in Healthcare (US$ Mn Forecast, 2016–2024
Figure 98: Middle East and Africa Technology Spending on Core Administration in Healthcare Attractiveness Analysis By Country
Figure 99: Middle East and Africa Technology Spending on Core Administration in Healthcare Value Share Analysis By Solution, 2016 and 2024
Figure 100: Middle East and Africa Technology Spending on Core Administration in Healthcare Value Share Analysis By Deployment, 2016 and 2024
Figure 101: Middle East and Africa Technology Spending on Core Administration in Healthcare Value Share Analysis By End User, 2016 and 2024
Figure 102: Middle East and Africa Technology Spending on Core Administration in Healthcare Value Share Analysis By Country, 2016 and 2024
Figure 103: Saudi Arabia Technology Spending on Core Administration in Healthcare (US$ Mn) Forecast, 2016–2024
Figure 104: Saudi Arabia Technology Spending on Core Administration in Healthcare Absolute $ Opportunity (US$ Mn), 2016-2024
Figure 105: UAE Technology Spending on Core Administration in Healthcare (US$ Mn) Forecast, 2016–2024
Figure 106: UAE Technology Spending on Core Administration in Healthcare Absolute $ Opportunity (US$ Mn), 2016-2024
Figure 107: RSA Technology Spending on Core Administration in Healthcare (US$ Mn) Forecast, 2016–2024
Figure 108: RSA Technology Spending on Core Administration in Healthcare Absolute $ Opportunity (US$ Mn), 2016-2024
Figure 109: Rest of Middle East and Africa Technology Spending on Core Administration in Healthcare (US$ Mn) Forecast, 2016–2024
Figure 110: Rest of Middle East and Africa Technology Spending on Core Administration in Healthcare Absolute $ Opportunity (US$ Mn), 2016-202
Figure 111: Middle East & Africa Technology Spending on Core Administration in Healthcare Attractiveness Analysis by Solution
Figure 112: Middle East & Africa Technology Spending on Core Administration in Healthcare Attractiveness Analysis by Deployment
Figure 113: Middle East & Africa Technology Spending on Core Administration in Healthcare Attractiveness Analysis by End User
Copyright © Transparency Market Research, Inc. All Rights reserved
Trust Online

Technology Spending on Core Administration in Healthcare Market Insights, 2016-2024