
Reports
Reports
The systemic inflammatory response syndrome treatment market is anticipated to grow from ~US$ 9.8 Bn in 2019 to ~US$ 17.8 Bn by 2027, and this healthy growth is attributable to government initiatives taken towards reducing the mortality rate of patients diagnosed with sepsis. Advancements in SIRS therapeutics are further brought in due to investment firms established in developed countries, who fund numerous clinical development programs that possess the capability of formulating effective drugs.
According to the World Health Organization, 7/100 hospitalized patients are highly susceptible to infections, which can cause sepsis. The patient-susceptibility rate in developing countries exceeds even this seven-one-hundred ratio, which signifies profitable opportunities for the systemic inflammatory response syndrome treatment market, as consumers tend to gain financial lucidity along with health consciousness.
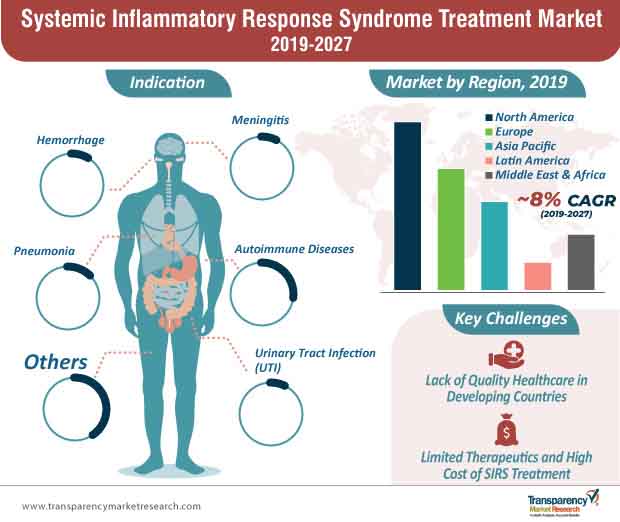
The TMR study finds that, revenue from the treatment of urinary tract infection will increase at a CAGR of ~8%, as dehydration, menopause, high consumption of birth control pills, and frequent involvement in sexual activities are leading causes of UTI. According to medical studies, a female’s body has a shorter urethra than a male’s body, which shortens the distance for bacteria to reach the bladder. This makes women more prone to UTI infections as compared to men, and the participation of women in availing SIRS treatment is also high. However, infections caused by unhygienic conditions that lead to the prevalence of autoimmune diseases are likely to hold significant value in the systemic inflammatory response syndrome treatment market during the forecast period.
As concerns regarding the gravity of sepsis increase, market players operate within the range of innovation to develop effective drugs and therapeutics. Among other therapies, CytoSorb®, a specific extracorporeal cytokine adsorber, is emerging as an effective therapy to reduce inflammation and control the failure of vital organs, such as the lungs, kidneys, heart, and brain. Also, as demand for the initial-stage diagnosis of sepsis becomes more prominent, biomarkers were introduced for early detection, treatment, and disposition of the condition.
Besides therapies, ample efforts backed by central and private funding are leading to the development of numerous pipeline drugs. For instance,
Adrenomed AG introduced Adrecizmab, which is deemed effective for the treatment of septic shock. The drug also holds efficiency in preventing vascular damage and keeping intact ideal vascular functions. Led by efficiency, therapeutics and pipeline drugs are projected to uphold demand in the systemic inflammatory response syndrome treatment market.
Since developed countries remain at the forefront for the development of advanced therapies and drugs, given their sound technical knowledge, partnerships with players in developing countries are seen as a strategic move to gain a reciprocal advantage in the SIRS market. For instance, CytoSorbents Corporation collaborated with Biocon Ltd. to create a huge market for the sales of CytoSorb in overseas territories.
Analysts’ View
Authors of the report infer that, the growth of the systemic inflammatory response syndrome treatment market will be upheld by the technology-intensive approach taken by manufacturers toward the development of sepsis treatment. Extracorporeal blood purification techniques for immunomodulation are gaining momentum in the SIRS treatment market as a potential therapy, while biomarkers and antibody-modified conduits are growing in importance as effective therapeutics.
Leading on the technological scale, North America is anticipated to remain a key investor in the systemic inflammatory response syndrome treatment market. Also, well-established infrastructure, coupled with magnified focus on the sterility of operation units in the healthcare sector of the region, further complements market growth. However, increasing medical tourism and substantial improvements in the healthcare quality of developing countries in Asia Pacific will bring profitable deals for players in the SIRS market.
Rise in Prevalence of SIRS: A Key Driver
Systemic Inflammatory Response Syndrome Treatment Market: Novel Treatment Approaches
Limited Availability of Therapeutics for SIRS Hampers Market
Systemic Inflammatory Response Syndrome Treatment Market: Competitive Landscape
Systemic Inflammatory Response Syndrome Treatment Market: Key Developments
Key players in the global systemic inflammatory response syndrome treatment market are engaged in the development of new products, mergers & acquisitions, collaborations, and integration. These strategies by industry players are likely to fuel the growth of the systemic inflammatory response syndrome treatment market. Some of the growth strategies adopted by the players are:
In the global systemic inflammatory response syndrome treatment market report, we have discussed individual strategies, followed by company profiles of manufacturers of SIRS treatment options. The ‘competitive landscape’ section is included in the SIRS treatment report to provide readers with a dashboard view and a company market share analysis of key players operating in the global systemic inflammatory response syndrome treatment market.
Systemic inflammatory response syndrome treatment market is expected to reach to ~US$ 17.8 Bn by 2027
Systemic inflammatory response syndrome treatment market is expected to expand at a CAGR of ~8% from 2019 to 2027
Systemic inflammatory response syndrome treatment market is driven rise in the prevalence of systemic inflammatory response syndrome (SIRS)
North America accounted for a major share of the global systemic inflammatory response syndrome treatment market
Key players in the global SIRS treatment market include CytoSorbents Corporation, RegeneRx Biopharmaceuticals, Inc., Endacea, Inc., Adrenomed AG, GlaxoSmithKline plc
1. Preface
1.1. Market Definition and Scope
1.2. Market Segmentation
1.3. Key Research Objectives
1.4. Research Highlights
2. Assumptions and Research Methodology
3. Executive Summary: Global Systemic Inflammatory Response Syndrome Treatment Market
4. Market Overview
4.1. Introduction
4.1.1. Indication Definition
4.1.2. Industry Evolution / Developments
4.2. Overview
4.3. Market Dynamics
4.3.1. Drivers
4.3.2. Restraints
4.3.3. Opportunities
4.4. Global Systemic Inflammatory Response Syndrome Treatment Market Analysis and Forecasts, 2017–2027
4.4.1. Market Revenue Projections (US$ Mn)
4.5. Porter’s Five Force Analysis
5. Market Outlook
5.1. Technological Advancements
5.2. Key Industry Events (Mergers, Acquisitions, Collaborations, Launch & Approvals, etc.)
5.3. Regulatory Scenario, by Region/Country
5.4. Pipeline Analysis
5.5. Key product/brand Analysis
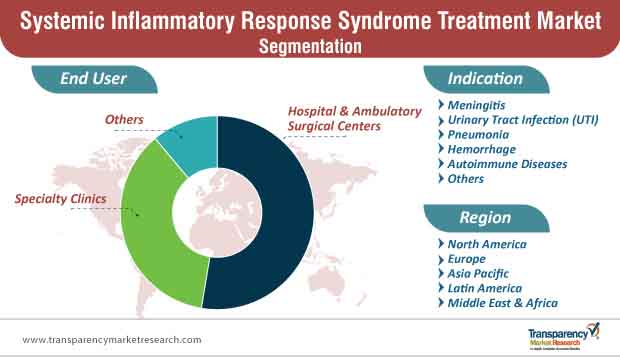
6. Global Systemic Inflammatory Response Syndrome Treatment Market Analysis and Forecasts, by Indication
6.1. Introduction & Definition
6.2. Key Findings / Developments
6.3. Market Value Forecast, by Indication, 2017–2027
6.3.1. Meningitis
6.3.2. Urinary Tract Infection (UTI)
6.3.3. Pneumonia
6.3.4. Hemorrhage
6.3.5. Autoimmune Diseases
6.3.6. Others
6.4. Market Attractiveness, by Indication
7. Global Systemic Inflammatory Response Syndrome Treatment Market Analysis and Forecasts, by End-user
7.1. Introduction & Definition
7.2. Key Findings / Developments
7.3. Market Value Forecast, by End-user, 2017–2027
7.3.1. Hospital & Ambulatory Surgical Centers
7.3.2. Specialty Clinics
7.3.3. Others
7.4. Market Attractiveness, by End-user
8. Global Systemic Inflammatory Response Syndrome Treatment Market Analysis and Forecasts, by Region
8.1. Key Findings
8.2. Market Value Forecast, by Region
8.2.1. North America
8.2.2. Europe
8.2.3. Asia Pacific
8.2.4. Latin America
8.2.5. Middle East & Africa
8.3. Market Attractiveness, by Country/Region
9. North America Systemic Inflammatory Response Syndrome Treatment Market Analysis and Forecast
9.1. Introduction
9.1.1. Key Findings
9.2. Market Value Forecast, by Indication, 2017–2027
9.2.1. Meningitis
9.2.2. Urinary Tract Infection (UTI)
9.2.3. Pneumonia
9.2.4. Hemorrhage
9.2.5. Autoimmune Diseases
9.2.6. Others
9.3. Market Value Forecast, by End-user, 2017–2027
9.3.1. Hospital & Ambulatory Surgical Centers
9.3.2. Specialty Clinics
9.3.3. Others
9.4. Market Value Forecast, by Country, 2017–2027
9.4.1. U.S.
9.4.2. Canada
9.5. Market Attractiveness Analysis
9.5.1. By Indication
9.5.2. By End-user
9.5.3. By Country
10. Europe Systemic Inflammatory Response Syndrome Treatment Market Analysis and Forecast
10.1. Introduction
10.1.1. Key Findings
10.2. Market Value Forecast, by Indication, 2017–2027
10.2.1. Meningitis
10.2.2. Urinary Tract Infection (UTI)
10.2.3. Pneumonia
10.2.4. Hemorrhage
10.2.5. Autoimmune Diseases
10.2.6. Others
10.3. Market Value Forecast, by End-user, 2017–2027
10.3.1. Hospital & Ambulatory Surgical Centers
10.3.2. Specialty Clinics
10.3.3. Others
10.4. Market Value Forecast, by Country/Sub-region, 2017–2027
10.4.1. Germany
10.4.2. U.K.
10.4.3. France
10.4.4. Spain
10.4.5. Italy
10.4.6. Russia
10.4.7. Rest of Europe
10.5. Market Attractiveness Analysis
10.5.1. By Indication
10.5.2. By End-user
10.5.3. By Country/Sub-region
11. Asia Pacific Systemic Inflammatory Response Syndrome Treatment Market Analysis and Forecast
11.1. Introduction
11.1.1. Key Findings
11.2. Market Value Forecast, by Indication, 2017–2027
11.2.1. Meningitis
11.2.2. Urinary Tract Infection (UTI)
11.2.3. Pneumonia
11.2.4. Hemorrhage
11.2.5. Autoimmune Diseases
11.2.6. Others
11.3. Market Value Forecast, by End-user, 2017–2027
11.3.1. Hospital & Ambulatory Surgical Centers
11.3.2. Specialty Clinics
11.3.3. Others
11.4. Market Value Forecast, by Country/Sub-region, 2017–2027
11.4.1. China
11.4.2. Japan
11.4.3. India
11.4.4. Australia & New Zealand
11.4.5. Rest of Asia Pacific
11.5. Market Attractiveness Analysis
11.5.1. By Indication
11.5.2. By End-user
11.5.3. By Country/Sub-region
12. Latin America Systemic Inflammatory Response Syndrome Treatment Market Analysis and Forecast
12.1. Introduction
12.1.1. Key Findings
12.2. Market Value Forecast, by Indication, 2017–2027
12.2.1. Meningitis
12.2.2. Urinary Tract Infection (UTI)
12.2.3. Pneumonia
12.2.4. Hemorrhage
12.2.5. Autoimmune Diseases
12.2.6. Others
12.3. Market Value Forecast, by End-user, 2017–2027
12.3.1. Hospital & Ambulatory Surgical Centers
12.3.2. Specialty Clinics
12.3.3. Others
12.4. Market Value Forecast, by Country/Sub-region, 2017–2027
12.4.1. Brazil
12.4.2. Mexico
12.4.3. Rest of Latin America
12.5. Market Attractiveness Analysis
12.5.1. By Indication
12.5.2. By End-user
12.5.3. By Country/Sub-region
13. Middle East & Africa Systemic Inflammatory Response Syndrome Treatment Market Analysis and Forecast
13.1. Introduction
13.1.1. Key Findings
13.2. Market Value Forecast, by Indication, 2017–2027
13.2.1. Meningitis
13.2.2. Urinary Tract Infection (UTI)
13.2.3. Pneumonia
13.2.4. Hemorrhage
13.2.5. Autoimmune Diseases
13.2.6. Others
13.3. Market Value Forecast, by End-user, 2017–2027
13.3.1. Hospital & Ambulatory Surgical Centers
13.3.2. Specialty Clinics
13.3.3. Others
13.4. Market Value Forecast, by Country/Sub-region, 2017–2027
13.4.1. GCC Countries
13.4.2. South Africa
13.4.3. Israel
13.4.4. Rest of Middle East & Africa
13.5. Market Attractiveness Analysis
13.5.1. By Indication
13.5.2. By End-user
13.5.3. By Country/Sub-region
14. Competition Landscape
14.1. Market Player - Competition Matrix (By Tier and Size of companies)
14.2. Market Share Analysis, by Company, 2018
14.3. Company Profiles
14.3.1. CytoSorbents Corporation
14.3.1.1. Overview (HQ, Employee Strength, Business Segments)
14.3.1.2. Financials
14.3.1.3. Recent Developments
14.3.1.4. Strategy
14.3.2. RegeneRx Biopharmaceuticals, Inc.
14.3.2.1. Overview (HQ, Employee Strength, Business Segments)
14.3.2.2. Financials
14.3.2.3. Recent Developments
14.3.2.4. Strategy
14.3.3. Endacea, Inc.
14.3.3.1. Overview (HQ, Employee Strength, Business Segments)
14.3.3.2. Strategy
14.3.4. Adrenomed AG
14.3.4.1. Overview (HQ, Employee Strength, Business Segments)
14.3.4.2. Recent Developments
14.3.4.3. Strategy
14.3.5. GlaxoSmithKline plc
14.3.5.1. Overview (HQ, Employee Strength, Business Segments)
14.3.5.2. Financials
14.3.5.3. Recent Developments
14.3.5.4. Strategy
14.3.6. Asahi Kasei Corporation
14.3.6.1. Overview (HQ, Employee Strength, Business Segments)
14.3.6.2. Financials
14.3.6.3. Recent Developments
14.3.6.4. Strategy
14.3.7. Cardinal Health
14.3.7.1. Overview (HQ, Employee Strength, Business Segments)
14.3.7.2. Financials
14.3.7.3. Recent Developments
14.3.7.4. Strategy
14.3.8. Smith & Nephew plc
14.3.8.1. Overview (HQ, Employee Strength, Business Segments)
14.3.8.2. Financials
14.3.8.3. Recent Developments
14.3.8.4. Strategy
14.3.9. ConvaTec, Inc.
14.3.9.1. Overview (HQ, Employee Strength, Business Segments)
14.3.9.2. Financials
14.3.9.3. Recent Developments
14.3.9.4. Strategy
14.3.10. AstraZeneca
14.3.10.1. Overview (HQ, Employee Strength, Business Segments)
14.3.10.2. Financials
14.3.10.3. Recent Developments
14.3.10.4. Strategy
14.3.11. Orion Corporation
14.3.11.1. Overview (HQ, Employee Strength, Business Segments)
14.3.11.2. Financials
14.3.11.3. Recent Developments
14.3.11.4. Strategy
14.3.12. CHIESI Farmaceutici S.p.A.
14.3.12.1. Overview (HQ, Employee Strength, Business Segments)
14.3.12.2. Financials
14.3.12.3. Recent Developments
14.3.12.4. Strategy
14.3.13. Mylan N.V.
14.3.13.1. Overview (HQ, Employee Strength, Business Segments)
14.3.13.2. Financials
14.3.13.3. Recent Developments
14.3.13.4. Strategy
*Note: Financial details of companies that do not report this information in public domain might not have been captured
List of Tables
Table 1Global Systemic Inflammatory Response Syndrome Treatment Market Value (US$ Mn) Forecast, by Indication, 2017–2027
Table 2 Global Systemic Inflammatory Response Syndrome Treatment Market Value (US$ Mn) Forecast, by End-user, 2017–2027
Table 3 Global Systemic Inflammatory Response Syndrome Treatment Market Value (US$ Mn) Forecast, by Region, 2017–2027
Table 4 North America Systemic Inflammatory Response Syndrome Treatment Market Value (US$ Mn) Forecast, by Indication, 2017–2027
Table 5 North America Systemic Inflammatory Response Syndrome Treatment Market Value (US$ Mn) Forecast, by End-user, 2017–2027
Table 6 North America Systemic Inflammatory Response Syndrome Treatment Market Value (US$ Mn) Forecast, by Country, 2017–2027
Table 7 Europe Systemic Inflammatory Response Syndrome Treatment Market Value (US$ Mn) Forecast, by Indication, 2017–2027
Table 8 Europe Systemic Inflammatory Response Syndrome Treatment Market Value (US$ Mn) Forecast, by End-user, 2017–2027
Table 9 Europe Systemic Inflammatory Response Syndrome Treatment Market Value (US$ Mn) Forecast, by Country/Sub-region, 2017–2027
Table 10 Asia Pacific Systemic Inflammatory Response Syndrome Treatment Market Value (US$ Mn) Forecast, by End-user, 2017–202
Table 11 Asia Pacific Systemic Inflammatory Response Syndrome Treatment Market Value (US$ Mn) Forecast, by Country/Sub-region, 2017–2027
Table 12 Latin America Systemic Inflammatory Response Syndrome Treatment Market Size (US$ Mn) Forecast, by Indication, 2017–2027
Table 13 Latin America Systemic Inflammatory Response Syndrome Treatment Market Size (US$ Mn) Forecast, by End-user, 2017–2027
Table 14 Latin America Systemic Inflammatory Response Syndrome Treatment Market Size (US$ Mn) Forecast, by Country/Sub-region, 2017–2027
Table 15 Middle East & Africa Systemic Inflammatory Response Syndrome Treatment Market Value (US$ Mn) Forecast, by Indication, 2017–2027
Table 16 Middle East & Africa Systemic Inflammatory Response Syndrome Treatment Market Value (US$ Mn) Forecast, by End-user, 2017–2027
Table 17 Middle East & Africa Systemic Inflammatory Response Syndrome Treatment Market Value (US$ Mn) Forecast, by Country/Sub-region, 2017–2027
Table 18 Asia Pacific Systemic Inflammatory Response Syndrome Treatment Market Value (US$ Mn) Forecast, by End-user, 2017–2027
List of Figures
Figure 1 Global Systemic Inflammatory Response Syndrome Treatment Market Value (US$ Mn), by Indication, 2018
Figure 2 Global Systemic Inflammatory Response Syndrome Treatment Market Share, Top Trends, by Indication, 2018
Figure 3 Global Systemic Inflammatory Response Syndrome Treatment Market Share, by Region, 2018
Figure 4 Global Systemic Inflammatory Response Syndrome Treatment Market Share Analysis, by Region
Figure 5 Porter’s Five Forces Analysis
Figure 6 Global Systemic Inflammatory Response Syndrome Treatment Market Value (US$ Mn) and Forecast, 2019–2027
Figure 7 Global Systemic Inflammatory Response Syndrome Treatment Market Value Share, by Indication, 2018
Figure 8 Global Systemic Inflammatory Response Syndrome Treatment Market Value Share, by End-user, 2018
Figure 9 Global Systemic Inflammatory Response Syndrome Treatment Market Value Share Analysis, by Indication, 2018 and 2027
Figure 10 Global Systemic Inflammatory Response Syndrome Market Value (US$ Mn) and Y-o-Y Growth (%), by Meningitis, 2017–2027
Figure 11 Global Systemic Inflammatory Response Syndrome Market Value (US$ Mn) and Y-o-Y Growth (%), by Urinary Tract Infection (UTI), 2017–2027
Figure 12 Global Systemic Inflammatory Response Syndrome Market Value (US$ Mn) and Y-o-Y Growth (%), by Pneumonia, 2017–2027
Figure 13 Global Systemic Inflammatory Response Syndrome Market Value (US$ Mn) and Y-o-Y Growth (%), by Hemorrhage, 2017–2027
Figure 14 Global Systemic Inflammatory Response Syndrome Market Value (US$ Mn) and Y-o-Y Growth (%), by Autoimmune Diseases, 2017–2027
Figure 15 Global Systemic Inflammatory Response Syndrome Market Value (US$ Mn) and Y-o-Y Growth (%), by Others, 2017–2027
Figure 16 Global Systemic Inflammatory Response Syndrome Treatment Market Attractiveness Analysis, by Indication, 2019–2027
Figure 17 Global Systemic Inflammatory Response Syndrome Treatment Market Value Share Analysis, by End-user, 2018 and 2027
Figure 18 Global Systemic Inflammatory Response Syndrome Treatment Market Value (US$ Mn) and Y-o-Y Growth (%), Hospitals & Ambulatory Surgical Centers, 2017–2027
Figure 19 Global Systemic Inflammatory Response Syndrome Treatment Market Value (US$ Mn) and Y-o-Y Growth (%), by Specialty Clinics, 2017–2027
Figure 20 Global Systemic Inflammatory Response Syndrome Treatment Market Value (US$ Mn) and Y-o-Y Growth (%), by Others, 2017–2027
Figure 21 Global Systemic Inflammatory Response Syndrome Treatment Market Attractiveness Analysis, by End-user, 2019–2027
Figure 22 Global Systemic Inflammatory Response Syndrome Treatment Market Value Share Analysis, by Region, 2018 and 2027
Figure 23 Global Systemic Inflammatory Response Syndrome Treatment Market Attractiveness Analysis, by Region, 2019–2027
Figure 24 North America Systemic Inflammatory Response Syndrome Treatment Market Value (US$ Mn) Forecast, 2017–2027
Figure 25 North America Systemic Inflammatory Response Syndrome Treatment Market Attractiveness Analysis, by Country, 2019–2027
Figure 26 North America Systemic Inflammatory Response Syndrome Treatment Market Value Share Analysis, by Indication, 2018 and 2027
Figure 27 North America Systemic Inflammatory Response Syndrome Treatment Market Value Share Analysis, by End-user, 2018 and 2027
Figure 28 North America Systemic Inflammatory Response Syndrome Treatment Market Value Share Analysis, by Country, 2018 and 2027
Figure 29 North America Systemic Inflammatory Response Syndrome Treatment Market Attractiveness Analysis, by Indication, 2019–2027
Figure 30 North America Systemic Inflammatory Response Syndrome Treatment Market Attractiveness Analysis, by End-user, 2019–2027
Figure 31 Europe Systemic Inflammatory Response Syndrome Treatment Market Value (US$ Mn) Forecast, 2017–2027
Figure 32 Europe Systemic Inflammatory Response Syndrome Treatment Market Attractiveness Analysis, by Country/Sub-region, 2019–2027
Figure 33 Europe Systemic Inflammatory Response Syndrome Treatment Market Value Share Analysis, by Indication, 2018 and 2027
Figure 34 Europe Systemic Inflammatory Response Syndrome Treatment Market Value Share Analysis, by End-user, 2018 and 2027
Figure 35 Europe Systemic Inflammatory Response Syndrome Treatment Market Value Share Analysis, by Country/Sub-region, 2018 and 2027
Figure 36 Europe Systemic Inflammatory Response Syndrome Treatment Market Attractiveness Analysis, by Indication, 2019–2027
Figure 37 Europe Systemic Inflammatory Response Syndrome Treatment Market Attractiveness Analysis, by End-user, 2019–2027
Figure 38 Asia Pacific Systemic Inflammatory Response Syndrome Treatment Market Value (US$ Mn) Forecast, 2017–2027
Figure 39 Asia Pacific Systemic Inflammatory Response Syndrome Treatment Market Attractiveness Analysis, by Country/Sub-region, 2018–2027
Figure 40 Asia Pacific Systemic Inflammatory Response Syndrome Treatment Market Value Share Analysis, by Indication, 2018 and 2027
Figure 41 Asia Pacific Systemic Inflammatory Response Syndrome Treatment Market Value Share Analysis, by End-user, 2018 and 2027
Figure 42 Asia Pacific Systemic Inflammatory Response Syndrome Treatment Market Value Share Analysis, by Country/Sub-region, 2018 and 2027
Figure 43 Asia Pacific Systemic Inflammatory Response Syndrome Treatment Market Attractiveness Analysis, by Indication, 2018-2027
Figure 44 Asia Pacific Europe Systemic Inflammatory Response Syndrome Treatment Market Attractiveness Analysis, by End-user, 2019–2027
Figure 45 Latin America Systemic Inflammatory Response Syndrome Treatment Market Value (US$ Mn) Forecast, 2017–2027
Figure 46 Latin America Systemic Inflammatory Response Syndrome Treatment Market Attractiveness Analysis, by Country/Sub-region, 2019–2027
Figure 47 Latin America Systemic Inflammatory Response Syndrome Treatment Market Value Share Analysis, by Indication, 2018 and 2027
Figure 48 Latin America Systemic Inflammatory Response Syndrome Treatment Market Value Share Analysis, by End-user, 2018 and 2027
Figure 49 Latin America Systemic Inflammatory Response Syndrome Treatment Market Value Share Analysis, by Country/Sub-region, 2018 and 2027
Figure 50 Latin America Systemic Inflammatory Response Syndrome Treatment Market Attractiveness Analysis, by Indication, 2019–2027
Figure 51 Latin America Europe Systemic Inflammatory Response Syndrome Treatment Market Attractiveness Analysis, by End-user, 2019–2027
Figure 52 Middle East & Africa Systemic Inflammatory Response Syndrome Treatment Market Value (US$ Mn) Forecast, 2017–2027
Figure 53 Middle East & Africa Systemic Inflammatory Response Syndrome Treatment Market Attractiveness Analysis, by Country/Sub-region, 2017–2027
Figure 54 Middle East & Africa Systemic Inflammatory Response Syndrome Treatment Market Value Share Analysis, by Indication, 2018 and 2027
Figure 55 Middle East & Africa Systemic Inflammatory Response Syndrome Treatment Market Value Share Analysis, by End-user, 2018 and 2027
Figure 56 Middle East & Africa Systemic Inflammatory Response Syndrome Treatment Market Value Share Analysis, by Country/Sub-region, 2018 and 2027
Figure 57 Middle East & Africa Systemic Inflammatory Response Syndrome Treatment Market Attractiveness Analysis, by Indication, 2019–2027
Figure 58 Middle East & Africa Europe Systemic Inflammatory Response Syndrome Treatment Market Attractiveness Analysis, by End-user, 2019–2027
Figure 59 CytoSorbents Corporation R&D Expense (US$ Mn), 2016–2018
Figure 60 CytoSorbents Corporation Revenue (US$ Mn) and Y-o-Y Growth (%), 2014–2018
Figure 61 CytoSorbents Corporation Breakdown of Net Sales, by Region, 2018
Figure 62 RegeneRx Biopharmaceuticals, Inc. Revenue (US$ Mn) and Y-o-Y Growth (%), 2017–2018
Figure 63 RegeneRx Biopharmaceuticals, Inc. R&D Expenses (US$ Mn) and Y-o-Y Growth (%), 2017–2018
Figure 64 GlaxoSmithKline plc Revenue (US$ Mn) and Y-o-Y Growth (%), 2015–2018
Figure 65 GlaxoSmithKline plc Breakdown of Net Sales (%), by Business Segment, 2018
Figure 66 GlaxoSmithKline plc Breakdown of Net Sales (%), by Geography, 2018
Figure 67 GlaxoSmithKline plc R&D Expenses (US$ Mn) and Y-o-Y Growth (%), 2015–2018
Figure 68 Asahi Kasei Corporation Revenue (US$ Bn) and Y-o-Y Growth (%), 2014–2018
Figure 69 Asahi Kasei Corporation R&D Expenses (US$ Mn) and Y-o-Y Growth (%), 2014–2018
Figure 70 Asahi Kasei Corporation Breakdown of Net Sales (%), by Business Segment, 2018
Figure 71 Cardinal Health Revenue (US$ Bn) and Y-o-Y Growth (%), 2015–2019
Figure 72 Cardinal Health Medical Business Segment Revenue (US$ Mn) and Y-o-Y Growth (%), 2014–2017
Figure 73 Smith & Nephew plc Revenue (US$ Mn) and Y-o-Y Growth (%), 2014–2018
Figure 74 Smith & Nephew plc R&D Expenses (US$ Mn), 2015–2018
Figure 75 Smith & Nephew plc Breakdown of Net Sales (%), by Region, 2018
Figure 76 Smith & Nephew plc Breakdown of Net Sales (%), by Business Segment, Advanced Wound Devices, 2018
Figure 77 ConvaTec, Inc. Revenue (US$ Mn) and Y-o-Y Growth (%), 2014–2018
Figure 78 ConvaTec, Inc. Breakdown of Net Sales (%), by Region, 2018
Figure 79 ConvaTec, Inc. Breakdown of Net Sales (%), by Business Segments, 2018
Figure 80 AstraZeneca Respiratory Segment Revenue (US$ Mn) and Y-o-Y Growth (%), 2016–2018
Figure 81 AstraZeneca Breakdown of Net Sales (%), by Region, 2018
Figure 82 AstraZeneca R&D Expenses (US$ Mn) and Y-o-Y Growth (%), 2016–2018
Figure 83 AstraZeneca Breakdown of Net Sales (%), by Product Segment, 2018
Figure 84 Orion Corporation Pharmaceuticals Segment Revenue (US$ Mn) and Y-o-Y Growth (%), 2016–2018
Figure 85 Orion Corporation Breakdown of Net Sales (%), by Geography, 2018
Figure 86 Orion Corporation R&D Expenses (US$ Mn) and Y-o-Y Growth (%), 2016–2018
Figure 87 Orion Corporation Breakdown of Net Sales (%), by Business Segment, 2018
Figure 88 CHIESI Farmaceutici S.p.A. Revenue (US$ Mn) and Y-o-Y Growth (%), 2016–2018
Figure 89 CHIESI Farmaceutici S.p.A. Breakdown of Net Sales (%), by Geography, 2018
Figure 90 CHIESI Farmaceutici S.p.A. R&D Expenses (US$ Mn) and Y-o-Y Growth (%), 2016–2018
Figure 91 CHIESI Farmaceutici S.p.A. Breakdown of Net Sales (%), by Therapeutic Area (Business Segment), 2018
Figure 92 Mylan N.V. Revenue (US$ Mn) and Y-o-Y Growth (%), 2015–2018
Figure 93 Mylan N.V. R&D Expenses (US$ Mn), 2017 and 2018
Figure 94 Mylan N.V. Breakdown of Net Sales, by Geography, 2018
Copyright © Transparency Market Research, Inc. All Rights reserved
Trust Online

Systemic Inflammatory Response Syndrome Treatment Market