
Reports
Reports
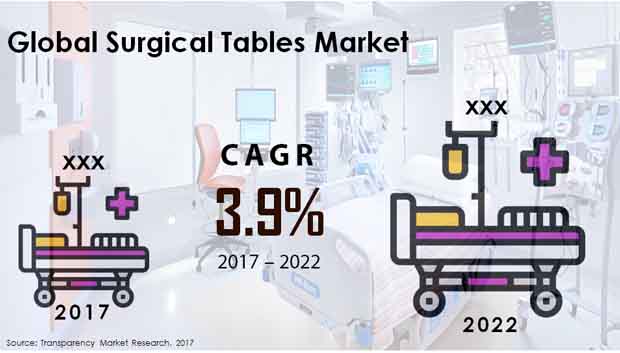
Global Surgical Tables Market: Snapshot
Surgical tables comprise one of the first requirements of a modern healthcare system and thus are likely to be in constant demand over the near future. The global surgical tables market has benefited significantly from the rising investment in the healthcare sector across the world regardless of the economic state of the country. Developed countries have led the way in modernizing their healthcare sectors and incorporating major technological advances, but healthcare agencies in developing regions such as the Middle East, Japan, Asia Pacific, and Latin America are also likely to become major players in the global healthcare sector. This is likely to drive the global surgical tables market at a steady rate in the 2017-2022 forecast period. The increasing acknowledgment of the need to improve the surgical area to maximize its utility and comfort is likely to drive the global surgical tables market.
According to Transparency Market Research, the global surgical tables market was valued at US$837.1 mn in 2017 and is expected to rise to US$1,014.3 mn by 2022 at a steady 4.1% CAGR therein.
North America to Dominate Global Surgical Tables Market
Geographically, North America is likely to be the leading contributor to the global surgical tables market in the coming years. The North America market is driven by the steady rise in demand from the surgical tables market in the U.S., where the healthcare sector is highly developed. The North America surgical tables market is expected to rise to a valuation of US$301.5 by 2022, expanding upon its 2017 valuation of US$246.9 mn at a strong CAGR of 4.1% between 2017 and 2022.
Rising Investment in Developing Regions Crucial for Surgical Tables Market
Despite the dominant role of Western countries in the technological development of the healthcare sector, emerging countries such as China, India, Thailand, Indonesia, Malaysia, Singapore, Brazil, Argentina, the UAE, and Saudi Arabia are likely to be vital to the global surgical tables market in the coming years. Several of these countries house rapidly growing healthcare sectors that are receiving significant government funding as well as private investment. This has enabled steady growth of the growth of component industries such as the surgical tables market. The increasing spending power of healthcare agencies in these regions is also likely to lead to growing demand for surgical tables and other such hospital implements.
Innovation in Developed Regions to Boost Surgical Tables Market
Developed countries such as the U.S., the U.K., France, and Germany are home to flourishing surgical tables markets that are likely to undergo smooth growth in the coming years due to the steady backing for healthcare innovation in the region. Widespread regulatory support for incorporation of technological advances in the healthcare sector is likely to help the surgical tables market achieve steady growth in Europe in the coming years. Despite being likely to lose some BPS over the forecast period, Europe accounted for 27.8% of the global surgical tables market in 2017 and is likely to remain a dominant contributor in the coming years.
Hospitals to Remain Dominant Contributor amid Growing Demand from ASCs
By end use, hospitals are likely to dominate the global surgical tables market. Hospitals have been the conventional leader in the surgical tables market and are likely to exhibit steady growth in demand over the coming years. Nevertheless, ambulatory surgical centers (ASCs) are becoming an important part of the healthcare sector in developed countries and are likely to contribute consistently to the surgical tables market in the coming years.
Competitive Dynamics
Key companies examined in the report include AMTAI Medical Equipment, Inc., Allengers Medical Systems Limited, C-RAD AB, Getinge AB, Skytron Inc., STERIS, Elekta AB, Span America Medical System Inc., and Stryker Corporation. New players could also enter the surgical tables market in the coming years due to the lucrative opportunity on offer in the market, leading to intense competition.
Rising Number of Surgical Procedures expands vistas of Surgical Tables Market
The surge in the number of surgeries for health conditions, accidents, and child-birth is creating opportunities for the surgical tables market. Key end users of surgical tables are hospitals, clinics, and ambulatory surgical centers, of which, hospitals account for leading share in the surgical tables market.
Modernization of healthcare infrastructure in developing economies is a key factor fuelling the surgical tables market. Governments of several developing economies are investing heavily for the upgrade of medical services in public hospitals. This is fuelling demand for surgical tables, thereby benefitting the surgical tables market. Besides this, expert advice of medical consultants that are executed by hospital administration to improve the surgical area and maximize its comfort and utility is leading to replacing outdated surgical tables with modern ones. This bolsters the surgical tables market.
North America is at the fore among other key regions in the surgical tables market. A highly modern healthcare infrastructure in the U.S. and Canada provides ample opportunities to the surgical tables market in the region. Europe holds substantial share in the surgical tables market due to the modern healthcare infrastructure in some developed economies of the region. Consistent efforts of governments in developed economies of the region to incorporate avant-garde medical equipment, especially in state-run healthcare institutions is expanding the surgical tables market in the region.
On the other hand, economic growth in emerging economies of Asia Pacific is indirectly fueling the surgical tables market in the region. Emergence of privately-run multispecialty and super specialty hospitals in emerging economies of Asia Pacific to serve the rising upper middle-class populations in these economies is creating opportunities for the surgical tables market in the region.
Key product segments of the surgical tables market are powered surgical tables and non-powered surgical tables. General surgery surgical tables and specialty surgery surgical tables are the key segments the surgical tables market is divided on the basis of surgery type.
Surgical tables market is expected to rise to US$1,014.3 mn by 2022
Surgical tables market to expand at a CAGR of 3.9% during the forecast period
Surgical tables market is driven by increasing acknowledgment of the need to improve the surgical area to maximize its utility and comfort
North America accounted for a major share of the global surgical tables market
Key players that operate within the surgical tables market are Elekta AB, Stryker Corporation, Span America Medical System Inc., AMTAI Medical Equipment, Inc., Allengers Medical Systems Limited
1. Global Surgical Tables Market - Executive Summary
2. Global Surgical Tables Market Overview
2.1. Introduction
2.1.1. Global Surgical Tables Market Taxonomy
2.1.2. Global Surgical Tables Market Definition
2.2. Global Surgical Tables Market Size (US$ Mn) and Forecast, 2012-2022
2.2.1. Global Surgical Tables Market Y-o-Y Growth
2.3. Global Surgical Tables Market Dynamics
2.4. Supply Chain
2.5. Cost Structure
2.6. Pricing Analysis
2.7. Raw Material Sourcing Strategy and Analysis
2.8. Supplier List
2.9. Key Participants Market Presence (Intensity Map) By Region
3. Global Surgical Tables Market Analysis and Forecast By Product Type
3.1. Global Surgical Tables Market Size and Forecast By Product Type, 2012-2022
3.1.1. Powered Surgical Tables Surgical Tables Market Size and Forecast, 2012-2022
3.1.1.1. Revenue (US$ Mn) Comparison, By Region
3.1.1.2. Market Share Comparison, By Region
3.1.1.3. Y-o-Y growth Comparison, By Region
3.1.2. Non-powered Surgical Tables Surgical Tables Market Size and Forecast, 2012-2022
3.1.2.1. Revenue (US$ Mn) Comparison, By Region
3.1.2.2. Market Share Comparison, By Region
3.1.2.3. Y-o-Y growth Comparison, By Region
4. Global Surgical Tables Market Analysis and Forecast By End User
4.1. Global Surgical Tables Market Size and Forecast By End User, 2012-2022
4.1.1. Hospitals Surgical Tables Market Size and Forecast, 2012-2022
4.1.1.1. Revenue (US$ Mn) Comparison, By Region
4.1.1.2. Market Share Comparison, By Region
4.1.1.3. Y-o-Y growth Comparison, By Region
4.1.2. ASCs Surgical Tables Market Size and Forecast, 2012-2022
4.1.2.1. Revenue (US$ Mn) Comparison, By Region
4.1.2.2. Market Share Comparison, By Region
4.1.2.3. Y-o-Y growth Comparison, By Region
4.1.3. Clinics Surgical Tables Market Size and Forecast, 2012-2022
4.1.3.1. Revenue (US$ Mn) Comparison, By Region
4.1.3.2. Market Share Comparison, By Region
4.1.3.3. Y-o-Y growth Comparison, By Region
5. Global Surgical Tables Market Analysis and Forecast By Surgery Type
5.1. Global Surgical Tables Market Size and Forecast By Surgery Type, 2012-2022
5.1.1. General Surgery Surgical Tables Market Size and Forecast, 2012-2022
5.1.1.1. Revenue (US$ Mn) Comparison, By Region
5.1.1.2. Market Share Comparison, By Region
5.1.1.3. Y-o-Y growth Comparison, By Region
5.1.2. Specialty Surgery Surgical Tables Market Size and Forecast, 2012-2022
5.1.2.1. Revenue (US$ Mn) Comparison, By Region
5.1.2.2. Market Share Comparison, By Region
5.1.2.3. Y-o-Y growth Comparison, By Region
6. Global Surgical Tables Market Analysis and Forecast By Region
6.1. Global Surgical Tables Market Size and Forecast, 2012-2022
6.1.1. North America Surgical Tables Market Size and Forecast, 2012-2022
6.1.1.1. Revenue (US$ Mn) Comparison, By Product Type
6.1.1.2. Revenue (US$ Mn) Comparison, By End User
6.1.1.3. Revenue (US$ Mn) Comparison, By Surgery Type
6.1.2. Latin America Surgical Tables Market Size and Forecast, 2012-2022
6.1.2.1. Revenue (US$ Mn) Comparison, By Product Type
6.1.2.2. Revenue (US$ Mn) Comparison, By End User
6.1.2.3. Revenue (US$ Mn) Comparison, By Surgery Type
6.1.3. Europe Surgical Tables Market Size and Forecast, 2012-2022
6.1.3.1. Revenue (US$ Mn) Comparison, By Product Type
6.1.3.2. Revenue (US$ Mn) Comparison, By End User
6.1.3.3. Revenue (US$ Mn) Comparison, By Surgery Type
6.1.4. Japan Surgical Tables Market Size and Forecast, 2012-2022
6.1.4.1. Revenue (US$ Mn) Comparison, By Product Type
6.1.4.2. Revenue (US$ Mn) Comparison, By End User
6.1.4.3. Revenue (US$ Mn) Comparison, By Surgery Type
6.1.5. APEJ Surgical Tables Market Size and Forecast, 2012-2022
6.1.5.1. Revenue (US$ Mn) Comparison, By Product Type
6.1.5.2. Revenue (US$ Mn) Comparison, By End User
6.1.5.3. Revenue (US$ Mn) Comparison, By Surgery Type
6.1.6. MEA Surgical Tables Market Size and Forecast, 2012-2022
6.1.6.1. Revenue (US$ Mn) Comparison, By Product Type
6.1.6.2. Revenue (US$ Mn) Comparison, By End User
6.1.6.3. Revenue (US$ Mn) Comparison, By Surgery Type
7. North America Surgical Tables Market Analysis and Forecast, By Country, 2012-2022
7.1. US Surgical Tables Market Size and Forecast, 2012-2022
7.1.1. Revenue (US$ Mn) Comparison, By Product Type
7.1.2. Revenue (US$ Mn) Comparison, By End User
7.1.3. Revenue (US$ Mn) Comparison, By Surgery Type
7.2. Canada Surgical Tables Market Size and Forecast, 2012-2022
7.2.1. Revenue (US$ Mn) Comparison, By Product Type
7.2.2. Revenue (US$ Mn) Comparison, By End User
7.2.3. Revenue (US$ Mn) Comparison, By Surgery Type
8. Latin America Surgical Tables Market Analysis and Forecast, By Country, 2012-2022
8.1. Brazil Surgical Tables Market Size and Forecast, 2012-2022
8.1.1. Revenue (US$ Mn) Comparison, By Product Type
8.1.2. Revenue (US$ Mn) Comparison, By End User
8.1.3. Revenue (US$ Mn) Comparison, By Surgery Type
8.2. Mexico Surgical Tables Market Size and Forecast, 2012-2022
8.2.1. Revenue (US$ Mn) Comparison, By Product Type
8.2.2. Revenue (US$ Mn) Comparison, By End User
8.2.3. Revenue (US$ Mn) Comparison, By Surgery Type
8.3. Argentina Surgical Tables Market Size and Forecast, 2012-2022
8.3.1. Revenue (US$ Mn) Comparison, By Product Type
8.3.2. Revenue (US$ Mn) Comparison, By End User
8.3.3. Revenue (US$ Mn) Comparison, By Surgery Type
9. Europe Surgical Tables Market Analysis and Forecast, By Country, 2012-2022
9.1. Germany Surgical Tables Market Size and Forecast, 2012-2022
9.1.1. Revenue (US$ Mn) Comparison, By Product Type
9.1.2. Revenue (US$ Mn) Comparison, By End User
9.1.3. Revenue (US$ Mn) Comparison, By Surgery Type
9.2. UK Surgical Tables Market Size and Forecast, 2012-2022
9.2.1. Revenue (US$ Mn) Comparison, By Product Type
9.2.2. Revenue (US$ Mn) Comparison, By End User
9.2.3. Revenue (US$ Mn) Comparison, By Surgery Type
9.3. France Surgical Tables Market Size and Forecast, 2012-2022
9.3.1. Revenue (US$ Mn) Comparison, By Product Type
9.3.2. Revenue (US$ Mn) Comparison, By End User
9.3.3. Revenue (US$ Mn) Comparison, By Surgery Type
9.4. Spain Surgical Tables Market Size and Forecast, 2012-2022
9.4.1. Revenue (US$ Mn) Comparison, By Product Type
9.4.2. Revenue (US$ Mn) Comparison, By End User
9.4.3. Revenue (US$ Mn) Comparison, By Surgery Type
9.5. Italy Surgical Tables Market Size and Forecast, 2012-2022
9.5.1. Revenue (US$ Mn) Comparison, By Product Type
9.5.2. Revenue (US$ Mn) Comparison, By End User
9.5.3. Revenue (US$ Mn) Comparison, By Surgery Type
9.6. Nordic Surgical Tables Market Size and Forecast, 2012-2022
9.6.1. Revenue (US$ Mn) Comparison, By Product Type
9.6.2. Revenue (US$ Mn) Comparison, By End User
9.6.3. Revenue (US$ Mn) Comparison, By Surgery Type
10. Japan Surgical Tables Market Analysis and Forecast, By Country, 2012-2022
10.1. Japan Surgical Tables Market Size and Forecast, 2012-2022
10.1.1. Revenue (US$ Mn) Comparison, By Product Type
10.1.2. Revenue (US$ Mn) Comparison, By End User
10.1.3. Revenue (US$ Mn) Comparison, By Surgery Type
11. APEJ Surgical Tables Market Analysis and Forecast, By Country, 2012-2022
11.1. China Surgical Tables Market Size and Forecast, 2012-2022
11.1.1. Revenue (US$ Mn) Comparison, By Product Type
11.1.2. Revenue (US$ Mn) Comparison, By End User
11.1.3. Revenue (US$ Mn) Comparison, By Surgery Type
11.2. India Surgical Tables Market Size and Forecast, 2012-2022
11.2.1. Revenue (US$ Mn) Comparison, By Product Type
11.2.2. Revenue (US$ Mn) Comparison, By End User
11.2.3. Revenue (US$ Mn) Comparison, By Surgery Type
11.3. Malaysia Surgical Tables Market Size and Forecast, 2012-2022
11.3.1. Revenue (US$ Mn) Comparison, By Product Type
11.3.2. Revenue (US$ Mn) Comparison, By End User
11.3.3. Revenue (US$ Mn) Comparison, By Surgery Type
11.4. Thailand Surgical Tables Market Size and Forecast, 2012-2022
11.4.1. Revenue (US$ Mn) Comparison, By Product Type
11.4.2. Revenue (US$ Mn) Comparison, By End User
11.4.3. Revenue (US$ Mn) Comparison, By Surgery Type
11.5. Singapore Surgical Tables Market Size and Forecast, 2012-2022
11.5.1. Revenue (US$ Mn) Comparison, By Product Type
11.5.2. Revenue (US$ Mn) Comparison, By End User
11.5.3. Revenue (US$ Mn) Comparison, By Surgery Type
11.6. Australia Surgical Tables Market Size and Forecast, 2012-2022
11.6.1. Revenue (US$ Mn) Comparison, By Product Type
11.6.2. Revenue (US$ Mn) Comparison, By End User
11.6.3. Revenue (US$ Mn) Comparison, By Surgery Type
12. MEA Surgical Tables Market Analysis and Forecast, By Country, 2012-2022
12.1. GCC Countries Surgical Tables Market Size and Forecast, 2012-2022
12.1.1. Revenue (US$ Mn) Comparison, By Product Type
12.1.2. Revenue (US$ Mn) Comparison, By End User
12.1.3. Revenue (US$ Mn) Comparison, By Surgery Type
12.2. South Africa Surgical Tables Market Size and Forecast, 2012-2022
12.2.1. Revenue (US$ Mn) Comparison, By Product Type
12.2.2. Revenue (US$ Mn) Comparison, By End User
12.2.3. Revenue (US$ Mn) Comparison, By Surgery Type
12.3. Nigeria Surgical Tables Market Size and Forecast, 2012-2022
12.3.1. Revenue (US$ Mn) Comparison, By Product Type
12.3.2. Revenue (US$ Mn) Comparison, By End User
12.3.3. Revenue (US$ Mn) Comparison, By Surgery Type
12.4. Israel Surgical Tables Market Size and Forecast, 2012-2022
12.4.1. Revenue (US$ Mn) Comparison, By Product Type
12.4.2. Revenue (US$ Mn) Comparison, By End User
12.4.3. Revenue (US$ Mn) Comparison, By Surgery Type
13. Global Surgical Tables Market Company Share, Competition Landscape and Company Profiles
13.1. Company Share Analysis
13.2. Competition Landscape
13.3. Company Profiles
13.3.1. Allengers Medical Systems Limited
13.3.2. AMTAI Medical Equipment, Inc.
13.3.3. C-RAD AB
13.3.4. Elekta AB
13.3.5. Getinge AB
13.3.6. Hill-Rom Holdings, Inc.
13.3.7. Invacare Corp
13.3.8. Leoni AG
13.3.9. Medtronic Plc.
13.3.10. Skytron llc.
13.3.11. Span America Medical System, Inc.
13.3.12. STERIS
13.3.13. Stryker Corporation
13.3.14.Transmotion Medical, Inc.
14. Research Methodology
15. Secondary and Primary Sources
16. Assumptions and Acronyms
17. Disclaimer
List of Tables
TABLE 1 Global Surgical Tables Market Value (US$ Mn), 2012-2016
TABLE 2 Global Surgical Tables Market Value (US$ Mn), 2017-2022
TABLE 3 Global Surgical Tables Market Value (US$ Mn) and Y-o-Y, 2015-2022
TABLE 4 Global Powered Surgical Tables Segment Value (US$ Mn), By Region 2012-2016
TABLE 5 Global Powered Surgical Tables Segment Value (US$ Mn), By Region 2017-2022
TABLE 6 Global Powered Surgical Tables Segment Market Share, By Region 2012-2016
TABLE 7 Global Powered Surgical Tables Segment Market Share, By Region 2017-2022
TABLE 8 Global Powered Surgical Tables Segment Y-o-Y, By Region 2015-2022
TABLE 9 Global Non-powered Surgical Tables Segment Value (US$ Mn), By Region 2012-2016
TABLE 10 Global Non-powered Surgical Tables Segment Value (US$ Mn), By Region 2017-2022
TABLE 11 Global Non-powered Surgical Tables Segment Market Share, By Region 2012-2016
TABLE 12 Global Non-powered Surgical Tables Segment Market Share, By Region 2017-2022
TABLE 13 Global Non-powered Surgical Tables Segment Y-o-Y, By Region 2015-2022
TABLE 14 Global Hospitals Segment Value (US$ Mn), By Region 2012-2016
TABLE 15 Global Hospitals Segment Value (US$ Mn), By Region 2017-2022
TABLE 16 Global Hospitals Segment Market Share, By Region 2012-2016
TABLE 17 Global Hospitals Segment Market Share, By Region 2017-2022
TABLE 18 Global Hospitals Segment Y-o-Y, By Region 2015-2022
TABLE 19 Global ASCs Segment Value (US$ Mn), By Region 2012-2016
TABLE 20 Global ASCs Segment Value (US$ Mn), By Region 2017-2022
TABLE 21 Global ASCs Segment Market Share, By Region 2012-2016
TABLE 22 Global ASCs Segment Market Share, By Region 2017-2022
TABLE 23 Global ASCs Segment Y-o-Y, By Region 2015-2022
TABLE 24 Global Clinics Segment Value (US$ Mn), By Region 2012-2016
TABLE 25 Global Clinics Segment Value (US$ Mn), By Region 2017-2022
TABLE 26 Global Clinics Segment Market Share, By Region 2012-2016
TABLE 27 Global Clinics Segment Market Share, By Region 2017-2022
TABLE 28 Global Clinics Segment Y-o-Y, By Region 2015-2022
TABLE 29 Global General Surgery Segment Value (US$ Mn), By Region 2012-2016
TABLE 30 Global General Surgery Segment Value (US$ Mn), By Region 2017-2022
TABLE 31 Global General Surgery Segment Market Share, By Region 2012-2016
TABLE 32 Global General Surgery Segment Market Share, By Region 2017-2022
TABLE 33 Global General Surgery Segment Y-o-Y, By Region 2015-2022
TABLE 34 Global Specialty Surgery Segment Value (US$ Mn), By Region 2012-2016
TABLE 35 Global Specialty Surgery Segment Value (US$ Mn), By Region 2017-2022
TABLE 36 Global Specialty Surgery Segment Market Share, By Region 2012-2016
TABLE 37 Global Specialty Surgery Segment Market Share, By Region 2017-2022
TABLE 38 Global Specialty Surgery Segment Y-o-Y, By Region 2015-2022
TABLE 39 North America Surgical Tables Market Value (US$ Mn), By Product Type 2012-2016
TABLE 40 North America Surgical Tables Market Value (US$ Mn), By Product Type 2017-2022
TABLE 41 North America Surgical Tables Market Value (US$ Mn), By End User 2012-2016
TABLE 42 North America Surgical Tables Market Value (US$ Mn), By End User 2017-2022
TABLE 43 North America Surgical Tables Market Value (US$ Mn), By Surgery Type 2012-2016
TABLE 44 North America Surgical Tables Market Value (US$ Mn), By Surgery Type 2017-2022
TABLE 45 Latin America Surgical Tables Market Value (US$ Mn), By Product Type 2012-2016
TABLE 46 Latin America Surgical Tables Market Value (US$ Mn), By Product Type 2017-2022
TABLE 47 Latin America Surgical Tables Market Value (US$ Mn), By End User 2012-2016
TABLE 48 Latin America Surgical Tables Market Value (US$ Mn), By End User 2017-2022
TABLE 49 Latin America Surgical Tables Market Value (US$ Mn), By Surgery Type 2012-2016
TABLE 50 Latin America Surgical Tables Market Value (US$ Mn), By Surgery Type 2017-2022
TABLE 51 Europe Surgical Tables Market Value (US$ Mn), By Product Type 2012-2016
TABLE 52 Europe Surgical Tables Market Value (US$ Mn), By Product Type 2017-2022
TABLE 53 Europe Surgical Tables Market Value (US$ Mn), By End User 2012-2016
TABLE 54 Europe Surgical Tables Market Value (US$ Mn), By End User 2017-2022
TABLE 55 Europe Surgical Tables Market Value (US$ Mn), By Surgery Type 2012-2016
TABLE 56 Europe Surgical Tables Market Value (US$ Mn), By Surgery Type 2017-2022
TABLE 57 Japan Surgical Tables Market Value (US$ Mn), By Product Type 2012-2016
TABLE 58 Japan Surgical Tables Market Value (US$ Mn), By Product Type 2017-2022
TABLE 59 Japan Surgical Tables Market Value (US$ Mn), By End User 2012-2016
TABLE 60 Japan Surgical Tables Market Value (US$ Mn), By End User 2017-2022
TABLE 61 Japan Surgical Tables Market Value (US$ Mn), By Surgery Type 2012-2016
TABLE 62 Japan Surgical Tables Market Value (US$ Mn), By Surgery Type 2017-2022
TABLE 63 APEJ Surgical Tables Market Value (US$ Mn), By Product Type 2012-2016
TABLE 64 APEJ Surgical Tables Market Value (US$ Mn), By Product Type 2017-2022
TABLE 65 APEJ Surgical Tables Market Value (US$ Mn), By End User 2012-2016
TABLE 66 APEJ Surgical Tables Market Value (US$ Mn), By End User 2017-2022
TABLE 67 APEJ Surgical Tables Market Value (US$ Mn), By Surgery Type 2012-2016
TABLE 68 APEJ Surgical Tables Market Value (US$ Mn), By Surgery Type 2017-2022
TABLE 69 MEA Surgical Tables Market Value (US$ Mn), By Product Type 2012-2016
TABLE 70 MEA Surgical Tables Market Value (US$ Mn), By Product Type 2017-2022
TABLE 71 MEA Surgical Tables Market Value (US$ Mn), By End User 2012-2016
TABLE 72 MEA Surgical Tables Market Value (US$ Mn), By End User 2017-2022
TABLE 73 MEA Surgical Tables Market Value (US$ Mn), By Surgery Type 2012-2016
TABLE 74 MEA Surgical Tables Market Value (US$ Mn), By Surgery Type 2017-2022
TABLE 75 US Surgical Tables Market Value (US$ Mn), By Product Type 2012-2016
TABLE 76 US Surgical Tables Market Value (US$ Mn), By Product Type 2017-2022
TABLE 77 US Surgical Tables Market Value (US$ Mn), By End User 2012-2016
TABLE 78 US Surgical Tables Market Value (US$ Mn), By End User 2017-2022
TABLE 79 US Surgical Tables Market Value (US$ Mn), By Surgery Type 2012-2016
TABLE 80 US Surgical Tables Market Value (US$ Mn), By Surgery Type 2017-2022
TABLE 81 Canada Surgical Tables Market Value (US$ Mn), By Product Type 2012-2016
TABLE 82 Canada Surgical Tables Market Value (US$ Mn), By Product Type 2017-2022
TABLE 83 Canada Surgical Tables Market Value (US$ Mn), By End User 2012-2016
TABLE 84 Canada Surgical Tables Market Value (US$ Mn), By End User 2017-2022
TABLE 85 Canada Surgical Tables Market Value (US$ Mn), By Surgery Type 2012-2016
TABLE 86 Canada Surgical Tables Market Value (US$ Mn), By Surgery Type 2017-2022
TABLE 87 Brazil Surgical Tables Market Value (US$ Mn), By Product Type 2012-2016
TABLE 88 Brazil Surgical Tables Market Value (US$ Mn), By Product Type 2017-2022
TABLE 89 Brazil Surgical Tables Market Value (US$ Mn), By End User 2012-2016
TABLE 90 Brazil Surgical Tables Market Value (US$ Mn), By End User 2017-2022
TABLE 91 Brazil Surgical Tables Market Value (US$ Mn), By Surgery Type 2012-2016
TABLE 92 Brazil Surgical Tables Market Value (US$ Mn), By Surgery Type 2017-2022
TABLE 93 Mexico Surgical Tables Market Value (US$ Mn), By Product Type 2012-2016
TABLE 94 Mexico Surgical Tables Market Value (US$ Mn), By Product Type 2017-2022
TABLE 95 Mexico Surgical Tables Market Value (US$ Mn), By End User 2012-2016
TABLE 96 Mexico Surgical Tables Market Value (US$ Mn), By End User 2017-2022
TABLE 97 Mexico Surgical Tables Market Value (US$ Mn), By Surgery Type 2012-2016
TABLE 98 Mexico Surgical Tables Market Value (US$ Mn), By Surgery Type 2017-2022
TABLE 99 Argentina Surgical Tables Market Value (US$ Mn), By Product Type 2012-2016
TABLE 100 Argentina Surgical Tables Market Value (US$ Mn), By Product Type 2017-2022
TABLE 101 Argentina Surgical Tables Market Value (US$ Mn), By End User 2012-2016
TABLE 102 Argentina Surgical Tables Market Value (US$ Mn), By End User 2017-2022
TABLE 103 Argentina Surgical Tables Market Value (US$ Mn), By Surgery Type 2012-2016
TABLE 104 Argentina Surgical Tables Market Value (US$ Mn), By Surgery Type 2017-2022
TABLE 105 Germany Surgical Tables Market Value (US$ Mn), By Product Type 2012-2016
TABLE 106 Germany Surgical Tables Market Value (US$ Mn), By Product Type 2017-2022
TABLE 107 Germany Surgical Tables Market Value (US$ Mn), By End User 2012-2016
TABLE 108 Germany Surgical Tables Market Value (US$ Mn), By End User 2017-2022
TABLE 109 Germany Surgical Tables Market Value (US$ Mn), By Surgery Type 2012-2016
TABLE 110 Germany Surgical Tables Market Value (US$ Mn), By Surgery Type 2017-2022
TABLE 111 UK Surgical Tables Market Value (US$ Mn), By Product Type 2012-2016
TABLE 112 UK Surgical Tables Market Value (US$ Mn), By Product Type 2017-2022
TABLE 113 UK Surgical Tables Market Value (US$ Mn), By End User 2012-2016
TABLE 114 UK Surgical Tables Market Value (US$ Mn), By End User 2017-2022
TABLE 115 UK Surgical Tables Market Value (US$ Mn), By Surgery Type 2012-2016
TABLE 116 UK Surgical Tables Market Value (US$ Mn), By Surgery Type 2017-2022
TABLE 117 France Surgical Tables Market Value (US$ Mn), By Product Type 2012-2016
TABLE 118 France Surgical Tables Market Value (US$ Mn), By Product Type 2017-2022
TABLE 119 France Surgical Tables Market Value (US$ Mn), By End User 2012-2016
TABLE 120 France Surgical Tables Market Value (US$ Mn), By End User 2017-2022
TABLE 121 France Surgical Tables Market Value (US$ Mn), By Surgery Type 2012-2016
TABLE 122 France Surgical Tables Market Value (US$ Mn), By Surgery Type 2017-2022
TABLE 123 Spain Surgical Tables Market Value (US$ Mn), By Product Type 2012-2016
TABLE 124 Spain Surgical Tables Market Value (US$ Mn), By Product Type 2017-2022
TABLE 125 Spain Surgical Tables Market Value (US$ Mn), By End User 2012-2016
TABLE 126 Spain Surgical Tables Market Value (US$ Mn), By End User 2017-2022
TABLE 127 Spain Surgical Tables Market Value (US$ Mn), By Surgery Type 2012-2016
TABLE 128 Spain Surgical Tables Market Value (US$ Mn), By Surgery Type 2017-2022
TABLE 129 Italy Surgical Tables Market Value (US$ Mn), By Product Type 2012-2016
TABLE 130 Italy Surgical Tables Market Value (US$ Mn), By Product Type 2017-2022
TABLE 131 Italy Surgical Tables Market Value (US$ Mn), By End User 2012-2016
TABLE 132 Italy Surgical Tables Market Value (US$ Mn), By End User 2017-2022
TABLE 133 Italy Surgical Tables Market Value (US$ Mn), By Surgery Type 2012-2016
TABLE 134 Italy Surgical Tables Market Value (US$ Mn), By Surgery Type 2017-2022
TABLE 135 Nordic Surgical Tables Market Value (US$ Mn), By Product Type 2012-2016
TABLE 136 Nordic Surgical Tables Market Value (US$ Mn), By Product Type 2017-2022
TABLE 137 Nordic Surgical Tables Market Value (US$ Mn), By End User 2012-2016
TABLE 138 Nordic Surgical Tables Market Value (US$ Mn), By End User 2017-2022
TABLE 139 Nordic Surgical Tables Market Value (US$ Mn), By Surgery Type 2012-2016
TABLE 140 Nordic Surgical Tables Market Value (US$ Mn), By Surgery Type 2017-2022
TABLE 141 Japan Surgical Tables Market Value (US$ Mn), By Product Type 2012-2016
TABLE 142 Japan Surgical Tables Market Value (US$ Mn), By Product Type 2017-2022
TABLE 143 Japan Surgical Tables Market Value (US$ Mn), By End User 2012-2016
TABLE 144 Japan Surgical Tables Market Value (US$ Mn), By End User 2017-2022
TABLE 145 Japan Surgical Tables Market Value (US$ Mn), By Surgery Type 2012-2016
TABLE 146 Japan Surgical Tables Market Value (US$ Mn), By Surgery Type 2017-2022
TABLE 147 China Surgical Tables Market Value (US$ Mn), By Product Type 2012-2016
TABLE 148 China Surgical Tables Market Value (US$ Mn), By Product Type 2017-2022
TABLE 149 China Surgical Tables Market Value (US$ Mn), By End User 2012-2016
TABLE 150 China Surgical Tables Market Value (US$ Mn), By End User 2017-2022
TABLE 151 China Surgical Tables Market Value (US$ Mn), By Surgery Type 2012-2016
TABLE 152 China Surgical Tables Market Value (US$ Mn), By Surgery Type 2017-2022
TABLE 153 India Surgical Tables Market Value (US$ Mn), By Product Type 2012-2016
TABLE 154 India Surgical Tables Market Value (US$ Mn), By Product Type 2017-2022
TABLE 155 India Surgical Tables Market Value (US$ Mn), By End User 2012-2016
TABLE 156 India Surgical Tables Market Value (US$ Mn), By End User 2017-2022
TABLE 157 India Surgical Tables Market Value (US$ Mn), By Surgery Type 2012-2016
TABLE 158 India Surgical Tables Market Value (US$ Mn), By Surgery Type 2017-2022
TABLE 159 Malaysia Surgical Tables Market Value (US$ Mn), By Product Type 2012-2016
TABLE 160 Malaysia Surgical Tables Market Value (US$ Mn), By Product Type 2017-2022
TABLE 161 Malaysia Surgical Tables Market Value (US$ Mn), By End User 2012-2016
TABLE 162 Malaysia Surgical Tables Market Value (US$ Mn), By End User 2017-2022
TABLE 163 Malaysia Surgical Tables Market Value (US$ Mn), By Surgery Type 2012-2016
TABLE 164 Malaysia Surgical Tables Market Value (US$ Mn), By Surgery Type 2017-2022
TABLE 165 Thailand Surgical Tables Market Value (US$ Mn), By Product Type 2012-2016
TABLE 166 Thailand Surgical Tables Market Value (US$ Mn), By Product Type 2017-2022
TABLE 167 Thailand Surgical Tables Market Value (US$ Mn), By End User 2012-2016
TABLE 168 Thailand Surgical Tables Market Value (US$ Mn), By End User 2017-2022
TABLE 169 Thailand Surgical Tables Market Value (US$ Mn), By Surgery Type 2012-2016
TABLE 170 Thailand Surgical Tables Market Value (US$ Mn), By Surgery Type 2017-2022
TABLE 171 Singapore Surgical Tables Market Value (US$ Mn), By Product Type 2012-2016
TABLE 172 Singapore Surgical Tables Market Value (US$ Mn), By Product Type 2017-2022
TABLE 173 Singapore Surgical Tables Market Value (US$ Mn), By End User 2012-2016
TABLE 174 Singapore Surgical Tables Market Value (US$ Mn), By End User 2017-2022
TABLE 175 Singapore Surgical Tables Market Value (US$ Mn), By Surgery Type 2012-2016
TABLE 176 Singapore Surgical Tables Market Value (US$ Mn), By Surgery Type 2017-2022
TABLE 177 Australia Surgical Tables Market Value (US$ Mn), By Product Type 2012-2016
TABLE 178 Australia Surgical Tables Market Value (US$ Mn), By Product Type 2017-2022
TABLE 179 Australia Surgical Tables Market Value (US$ Mn), By End User 2012-2016
TABLE 180 Australia Surgical Tables Market Value (US$ Mn), By End User 2017-2022
TABLE 181 Australia Surgical Tables Market Value (US$ Mn), By Surgery Type 2012-2016
TABLE 182 Australia Surgical Tables Market Value (US$ Mn), By Surgery Type 2017-2022
TABLE 183 GCC Countries Surgical Tables Market Value (US$ Mn), By Product Type 2012-2016
TABLE 184 GCC Countries Surgical Tables Market Value (US$ Mn), By Product Type 2017-2022
TABLE 185 GCC Countries Surgical Tables Market Value (US$ Mn), By End User 2012-2016
TABLE 186 GCC Countries Surgical Tables Market Value (US$ Mn), By End User 2017-2022
TABLE 187 GCC Countries Surgical Tables Market Value (US$ Mn), By Surgery Type 2012-2016
TABLE 188 GCC Countries Surgical Tables Market Value (US$ Mn), By Surgery Type 2017-2022
TABLE 189 South Africa Surgical Tables Market Value (US$ Mn), By Product Type 2012-2016
TABLE 190 South Africa Surgical Tables Market Value (US$ Mn), By Product Type 2017-2022
TABLE 191 South Africa Surgical Tables Market Value (US$ Mn), By End User 2012-2016
TABLE 192 South Africa Surgical Tables Market Value (US$ Mn), By End User 2017-2022
TABLE 193 South Africa Surgical Tables Market Value (US$ Mn), By Surgery Type 2012-2016
TABLE 194 South Africa Surgical Tables Market Value (US$ Mn), By Surgery Type 2017-2022
TABLE 195 Nigeria Surgical Tables Market Value (US$ Mn), By Product Type 2012-2016
TABLE 196 Nigeria Surgical Tables Market Value (US$ Mn), By Product Type 2017-2022
TABLE 197 Nigeria Surgical Tables Market Value (US$ Mn), By End User 2012-2016
TABLE 198 Nigeria Surgical Tables Market Value (US$ Mn), By End User 2017-2022
TABLE 199 Nigeria Surgical Tables Market Value (US$ Mn), By Surgery Type 2012-2016
TABLE 200 Nigeria Surgical Tables Market Value (US$ Mn), By Surgery Type 2017-2022
TABLE 201 Israel Surgical Tables Market Value (US$ Mn), By Product Type 2012-2016
TABLE 202 Israel Surgical Tables Market Value (US$ Mn), By Product Type 2017-2022
TABLE 203 Israel Surgical Tables Market Value (US$ Mn), By End User 2012-2016
TABLE 204 Israel Surgical Tables Market Value (US$ Mn), By End User 2017-2022
TABLE 205 Israel Surgical Tables Market Value (US$ Mn), By Surgery Type 2012-2016
TABLE 206 Israel Surgical Tables Market Value (US$ Mn), By Surgery Type 2017-2022
List of Figures
FIG. 1 Global Surgical Tables Market Value (US$ Mn), 2012-2016
FIG. 2 Global Surgical Tables Market Value (US$ Mn) Forecast, 2017-2022
FIG. 3 Global Surgical Tables Market Value (US$ Mn) and Y-o-Y, 2015-2022
FIG. 4 Global Powered Surgical Tables Segment Market Value (US$ Mn) By Region, 2012-2016
FIG. 5 Global Powered Surgical Tables Segment Market Value (US$ Mn) By Region, 2017-2022
FIG. 6 Global Powered Surgical Tables Segment Y-o-Y Growth Rate, By Region, 2015-2022
FIG. 7 Global Non-powered Surgical Tables Segment Market Value (US$ Mn) By Region, 2012-2016
FIG. 8 Global Non-powered Surgical Tables Segment Market Value (US$ Mn) By Region, 2017-2022
FIG. 9 Global Non-powered Surgical Tables Segment Y-o-Y Growth Rate, By Region, 2015-2022
FIG. 10 Global Hospitals Segment Market Value (US$ Mn) By Region, 2012-2016
FIG. 11 Global Hospitals Segment Market Value (US$ Mn) By Region, 2017-2022
FIG. 12 Global Hospitals Segment Y-o-Y Growth Rate, By Region, 2015-2022
FIG. 13 Global ASCs Segment Market Value (US$ Mn) By Region, 2012-2016
FIG. 14 Global ASCs Segment Market Value (US$ Mn) By Region, 2017-2022
FIG. 15 Global ASCs Segment Y-o-Y Growth Rate, By Region, 2015-2022
FIG. 16 Global Clinics Segment Market Value (US$ Mn) By Region, 2012-2016
FIG. 17 Global Clinics Segment Market Value (US$ Mn) By Region, 2017-2022
FIG. 18 Global Clinics Segment Y-o-Y Growth Rate, By Region, 2015-2022
FIG. 19 Global General Surgery Segment Market Value (US$ Mn) By Region, 2012-2016
FIG. 20 Global General Surgery Segment Market Value (US$ Mn) By Region, 2017-2022
FIG. 21 Global General Surgery Segment Y-o-Y Growth Rate, By Region, 2015-2022
FIG. 22 Global Specialty Surgery Segment Market Value (US$ Mn) By Region, 2012-2016
FIG. 23 Global Specialty Surgery Segment Market Value (US$ Mn) By Region, 2017-2022
FIG. 24 Global Specialty Surgery Segment Y-o-Y Growth Rate, By Region, 2015-2022
FIG. 25 North America Surgical Tables Market Value (US$ Mn), By Product Type 2012-2016
FIG. 26 North America Surgical Tables Market Value (US$ Mn), By Product Type 2017-2022
FIG. 27 North America Surgical Tables Market Value (US$ Mn), By End User 2012-2016
FIG. 28 North America Surgical Tables Market Value (US$ Mn), By End User 2017-2022
FIG. 29 North America Surgical Tables Market Value (US$ Mn), By Surgery Type 2012-2016
FIG. 30 North America Surgical Tables Market Value (US$ Mn), By Surgery Type 2017-2022
FIG. 31 Latin America Surgical Tables Market Value (US$ Mn), By Product Type 2012-2016
FIG. 32 Latin America Surgical Tables Market Value (US$ Mn), By Product Type 2017-2022
FIG. 33 Latin America Surgical Tables Market Value (US$ Mn), By End User 2012-2016
FIG. 34 Latin America Surgical Tables Market Value (US$ Mn), By End User 2017-2022
FIG. 35 Latin America Surgical Tables Market Value (US$ Mn), By Surgery Type 2012-2016
FIG. 36 Latin America Surgical Tables Market Value (US$ Mn), By Surgery Type 2017-2022
FIG. 37 Europe Surgical Tables Market Value (US$ Mn), By Product Type 2012-2016
FIG. 38 Europe Surgical Tables Market Value (US$ Mn), By Product Type 2017-2022
FIG. 39 Europe Surgical Tables Market Value (US$ Mn), By End User 2012-2016
FIG. 40 Europe Surgical Tables Market Value (US$ Mn), By End User 2017-2022
FIG. 41 Europe Surgical Tables Market Value (US$ Mn), By Surgery Type 2012-2016
FIG. 42 Europe Surgical Tables Market Value (US$ Mn), By Surgery Type 2017-2022
FIG. 43 Japan Surgical Tables Market Value (US$ Mn), By Product Type 2012-2016
FIG. 44 Japan Surgical Tables Market Value (US$ Mn), By Product Type 2017-2022
FIG. 45 Japan Surgical Tables Market Value (US$ Mn), By End User 2012-2016
FIG. 46 Japan Surgical Tables Market Value (US$ Mn), By End User 2017-2022
FIG. 47 Japan Surgical Tables Market Value (US$ Mn), By Surgery Type 2012-2016
FIG. 48 Japan Surgical Tables Market Value (US$ Mn), By Surgery Type 2017-2022
FIG. 49 APEJ Surgical Tables Market Value (US$ Mn), By Product Type 2012-2016
FIG. 50 APEJ Surgical Tables Market Value (US$ Mn), By Product Type 2017-2022
FIG. 51 APEJ Surgical Tables Market Value (US$ Mn), By End User 2012-2016
FIG. 52 APEJ Surgical Tables Market Value (US$ Mn), By End User 2017-2022
FIG. 53 APEJ Surgical Tables Market Value (US$ Mn), By Surgery Type 2012-2016
FIG. 54 APEJ Surgical Tables Market Value (US$ Mn), By Surgery Type 2017-2022
FIG. 55 MEA Surgical Tables Market Value (US$ Mn), By Product Type 2012-2016
FIG. 56 MEA Surgical Tables Market Value (US$ Mn), By Product Type 2017-2022
FIG. 57 MEA Surgical Tables Market Value (US$ Mn), By End User 2012-2016
FIG. 58 MEA Surgical Tables Market Value (US$ Mn), By End User 2017-2022
FIG. 59 MEA Surgical Tables Market Value (US$ Mn), By Surgery Type 2012-2016
FIG. 60 MEA Surgical Tables Market Value (US$ Mn), By Surgery Type 2017-2022
Copyright © Transparency Market Research, Inc. All Rights reserved
Trust Online

Surgical Tables Market Trends, 2017-2022