
Reports
Reports
A surface disinfectant is an anti-microbial agent used to remove any micro-organisms or viruses, present on different surfaces.
The global surface disinfectant market is projected to grow at a compound annual growth rate (CAGR) of 10.4% during the forecast period between 2016 and 2024. The market was valued at US $ 0.8 Bn in 2016 and is estimated to reach a valuation of US $ 1.7 Bn by 2024-end.
A rise in chronic disorders and an increasing geriatric population are anticipated to play a key role in the growth and development of the surface disinfectant market.
In addition to this, a rising number of products and an ever-expanding application base are estimated to propel the global surface disinfectant market.
The rising awareness among a large percentage of the population, particularly in developing economies, about maintaining a high level of hygiene could fuel the surface disinfectant demand.
As a result of these factors, the global surface disinfectant market is projected to grow at a steady rate in future.
A surface disinfectant in its liquid form has been found to be most popular because of its easy availability, affordable pricing, and ease of use. Wipes and sprays have emerged as the next best option.
The global surface disinfectant market is studied based on the chemical composition and region.
Based on chemical composition, the global surface disinfectant market is segmented into sodium hypochlorite, hydrogen peroxide, phenols, peracetic acid, amphoterics, ammonium compounds and aldehydes.
Sodium hypochlorite and phenol-based surface disinfectants have gained popularity because of their low price, but it is the ammonium compounds and peracetic acid product segments which are projected to witness substantial growth during the forecast period.
In terms of region, the global surface disinfectant market is divided into Europe, Latin America, Asia Pacific, Middle East and Africa, and North America.
Asia Pacific is projected to account for a substantial share in the global surface disinfectant market and become a leader in the overall market in future.
The rapid growth and development in the construction industry and the rising disposable income of customers are the factors estimated to propel the surface disinfectant market in Asia Pacific in future.
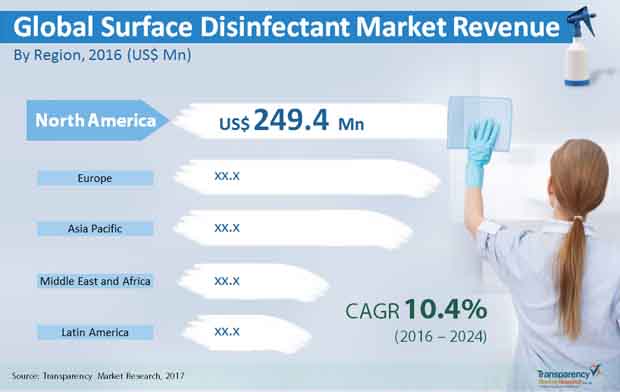
Middle East is predicted to stand second behind Asia Pacific while Europe and North America are projected to witness a steady growth rate in the surface disinfectant market in future. In 2016, North America contributed a total revenue of US $ 249.4 Mn to the overall surface disinfectant market.
The global surface disinfectant market is extremely fragmented with the presence of a number of players. Some of the important players in the surface disinfectant market include Proctor and Gamble. 3M Company, Johnson & Johnson Service Inc., Henry Schein, and Kimberly-Clark.
Market players in the global surface disinfectant market are focusing on research and development (R&D) activities to manufacture new products, which provide more benefits to the end-user. This rising focus of surface disinfectant market players on R&D undertakings is expected to help the growth of the overall market during the forecast period.
The COVID-19 pandemic has had a positive impact on the global surface disinfectant market during the forecast period due to a substantial rise in demand for surface disinfectants. The increased demand has been primarily witnessed in hospitals and domestic settings.
Surface disinfectants have been found to be effective in controlling the spread of the virus because of the presence of isopropanol and alcohol ethanol in them, which have properties that can deactivate the virus threat.
Several governments and organizations have also made sanitization compulsory and in addition, ordered for regular cleaning of public spaces.
Surface Disinfectant Market is expected to reach US $ 1.7 Bn by 2024
Surface Disinfectant Market is estimated to rise at a CAGR of 10.4% during forecast period
Increasing demand to prevent gums breeding is expected to drive the Surface Disinfectant Market
Asia Pacific is more attractive for vendors in the Surface Disinfectant Market
Key players of Surface Disinfectant Market are Proctor and Gamble. 3M Company, Johnson & Johnson Service Inc., Henry Schein, and Kimberly-Clark
1. Preface
1.1. Report Scope and Market Segmentation
1.2. Research Highlights
2. Assumptions and Research Methodology
2.1. Assumptions and Acronyms Used
2.2. Research Methodology
3. Executive Summary
3.1. Market Size, Global Surface Disinfectant Market (US$ Mn) (Tons)
3.2. Key Trends
4. Market Overview
4.1. Product Overview
4.2. Key Market Developments
4.3. Market Indicators
4.4. Market Dynamics
4.4.1. Drivers
4.4.2. Restraints
4.4.3. Key Opportunities
4.5. Porter’s Analysis
4.5.1. Threat of Substitutes
4.5.2. Bargaining Power of Buyers
4.5.3. Bargaining Power of Suppliers
4.5.4. Threat of New Entrants
4.5.5. Degree of Competition
4.6. Value Chain Analysis
4.7. Regulatory Scenario
4.8. SWOT Analysis
5. Global Surface Disinfectant Market Analysis, by Product
5.1. Introduction
5.2. Key Findings
5.3. Surface Disinfectant Market Analysis, by Product
5.4. Surface Disinfectant Market Attractiveness Analysis, by Product
5.5. Comparison Matrix by Product
5.6. Key Trends
6. Global Surface Disinfectant Market Analysis by Type
6.1. Introduction
6.2. Key Findings
6.3. Surface Disinfectant Market Analysis, by Type
6.4. Surface Disinfectant Market Attractiveness Analysis, by Type
6.5. Comparison Matrix by Type
6.6. Key Trends
7. Global Surface Disinfectant Market Analysis by Application
7.1. Introduction
7.2. Key Findings
7.3. Surface Disinfectant Market Analysis, by Application
7.4. Surface Disinfectant Market Attractiveness Analysis, by Application
7.5. Comparison Matrix by Application
7.6. Key Trends
8. Global Surface Disinfectant Market Analysis and Forecasts, by Region
8.1. Global Surface Disinfectant Market Scenario, by Region, 2016
8.2. Key Findings
8.3. Key Trends
8.4. Surface Disinfectant Market Analysis, by Region
8.5. Surface Disinfectant Market Attractiveness Analysis, by Region
9. North America Surface Disinfectant Market Analysis
9.1. Key Findings
9.2. Key Trends and Policies & Regulations
9.3. Surface Disinfectant Market Value Share Analysis, by Product
9.4. Surface Disinfectant Market Value Share Analysis, by Type
9.5. Surface Disinfectant Market Value Share Analysis, by Application
9.6. Surface Disinfectant Market Value Share Analysis, by Country
9.7. North America Market Forecast, by Country, 2016- 2024
9.7.1. U.S.
9.7.2. Canada
9.8. Surface Disinfectant Market Attractiveness Analysis, by Product
9.9. Surface Disinfectant Market Attractiveness Analysis, by Type
9.10. Surface Disinfectant Market Attractiveness Analysis, by Application
10. Europe Surface Disinfectant Market Analysis
10.1. Key Findings
10.2. Key Trends and Policies & Regulations
10.3. Surface Disinfectant Market Value Share Analysis, by Product
10.4. Surface Disinfectant Market Value Share Analysis, by Type
10.5. Surface Disinfectant Market Value Share Analysis, by Application
10.6. Surface Disinfectant Market Value Share Analysis, by Country
10.7. Europe Market Forecast, by Country, 2016- 2024
10.7.1. Germany
10.7.2. France
10.7.3. U.K.
10.7.4. Italy
10.7.5. Spain
10.7.7. Rest of Europe
10.8. Surface Disinfectant Market Attractiveness Analysis, by Product
10.9. Surface Disinfectant Market Attractiveness Analysis, by Type
10.10. Surface Disinfectant Market Attractiveness Analysis, by Application
11. Asia-Pacific Surface Disinfectant Market Analysis
11.1. Key Findings
11.2. Key Trends and Policies & Regulations
11.3. Surface Disinfectant Market Value Share Analysis, by Product
11.4. Surface Disinfectant Market Value Share Analysis, by Type
11.5. Surface Disinfectant Market Value Share Analysis, by Application
11.6. Surface Disinfectant Market Value Share Analysis, by Country
11.7. Asia Pacific Market Forecast, by Country, 2016- 2024
11.7.1. China
11.7.2. India
11.7.3. Japan
11.7.4. ASEAN
11.7.5. Rest of Asia Pacific
11.8. Surface Disinfectant Market Attractiveness Analysis, by Product
11.9. Surface Disinfectant Market Attractiveness Analysis, by Type
11.10. Surface Disinfectant Market Attractiveness Analysis, by Application
12. Latin America Surface Disinfectant Market Analysis
12.1. Key Findings
12.2. Key Trends and Policies & Regulations
12.3. Surface Disinfectant Market Value Share Analysis, by Product
12.4. Surface Disinfectant Market Value Share Analysis, by Type
12.5. Surface Disinfectant Market Value Share Analysis, by Application
12.6. Surface Disinfectant Market Value Share Analysis, by Country
12.7. Latin America Market Forecast, by Country, 2016- 2024
12.7.1. Brazil
12.7.2. Mexico
12.7.3. Rest of Latin America
12.8. Surface Disinfectant Market Attractiveness Analysis, by Product
12.9. Surface Disinfectant Market Attractiveness Analysis, by Type
12.10. Surface Disinfectant Market Attractiveness Analysis, by Application
13. Middle East & Africa Surface Disinfectant Market Analysis
13.1. Key Findings
13.2. Key Trends and Policies & Regulations
13.3. Surface Disinfectant Market Value Share Analysis, by Product
13.4. Surface Disinfectant Market Value Share Analysis, by Type
13.5. Surface Disinfectant Market Value Share Analysis, by Application
13.6. Surface Disinfectant Market Value Share Analysis, by Country
13.7. Middle East & Africa Market Forecast, by Country, 2016- 2024
13.7.1. GCC
13.7.2. Egypt
13.7.3. South Africa
13.7.4. Rest of Middle East & Africa
13.8. Surface Disinfectant Market Attractiveness Analysis, by Product
13.9. Surface Disinfectant Market Attractiveness Analysis, by Type
13.10. Surface Disinfectant Market Attractiveness Analysis, by Application
14. Competition Landscape
14.1. Competition Matrix
14.2. Surface Disinfectant Market Share Analysis, by Company (2015)
14.3. Company Profiles
14.3.1. Johnson & Johnson Services, Inc.
14.3.1.1. Company Description
14.3.1.2. Business Overview
14.3.1.3. Overall Revenue
14.3.1.4. Strategic Overview
14.3.2. Procter & Gamble
14.3.2.1. Company Description
14.3.2.2. Business Overview
14.3.2.3. Overall Revenue
14.3.2.4. Strategic Overview
14.3.3. Henry Schein, Inc.
14.3.3.1. Company Description
14.3.3.2. Business Overview
14.3.3.3. Overall Revenue
14.3.3.4. Strategic Overview
14.3.4. KIMBERLY-CLARK Corporation
14.3.4.1. Company Description
14.3.4.2. Business Overview
14.3.4.3. Overall Revenue
14.3.4.4. Strategic Overview
14.3.5. PURE Bioscience, Inc.
14.3.5.1. Company Description
14.3.5.2. Business Overview
14.3.5.3. Overall Revenue
14.3.5.4. Strategic Overview
14.3.6. ABC Compounding Co., Inc.
14.3.6.1. Company Description
14.3.6.2. Business Overview
14.3.7. Ecolab
14.3.7.1. Company Description
14.3.7.2. Business Overview
14.3.7.3. Overall Revenue
14.3.7.4. Strategic Overview
14.3.8. 3M
14.3.8.1. Company Description
14.3.8.2. Business Overview
14.3.8.3. Overall Revenue
14.3.8.4. Strategic Overview
14.3.9. STERIS plc
14.3.9.1. Company Description
14.3.9.2. Business Overview
14.3.9.3. Overall Revenue
14.3.9.4. Strategic Overview
14.3.10. DuPont
14.3.10.1. Company Description
14.3.10.2. Business Overview
14.3.10.3. Overall Revenue
14.3.10.4. Strategic Overview
14.3.11. Reckitt Benckiser Group plc.
14.3.11.1. Company Description
14.3.11.2. Business Overview
14.3.11.3. Overall Revenue
14.3.11.4. Strategic Overview
14.3.12. Cantel Medical Corp.
14.3.12.1. Company Description
14.3.12.2. Business Overview
14.3.12.3. Overall Revenue
14.3.12.4. Strategic Overview
14.3.13. The Clorox Company
14.3.13.1. Company Description
14.3.13.2. Business Overview
14.3.13.3. Overall Revenue
14.3.13.4. Strategic Overview
14.3.14. Metrex Research Corporation
14.3.14.1. Company Description
14.3.14.2. Business Overview
14.3.15. Whiteley Corporation
14.3.15.1. Company Description
14.3.15.2. Business Overview
14.3.16. Carroll Company
14.3.16.1. Company Description
14.3.16.2. Business Overview
14.3.17. GOJO Industries, Inc.
14.3.17.1. Company Description
14.3.17.2. Business Overview
15. Key Takeaway - Primary Insights
List of Tables
Table 1: Global Surface Disinfectants Market Volume (Tons) Forecast, by Product, 2015–2024
Table 2: Global Surface Disinfectants Market Size (US$ Mn) Forecast, by Product, 2015–2024
Table 3: Global Surface Disinfectant Volume (Tons) Forecast, by Type, 2015–2024
Table 4: Global Surface Disinfectant Market Size (US$ Mn) Forecast, by Type, 2015–2024
Table 5: Global Surface Disinfectant Volume (Tons) Forecast, by Application, 2015–2024
Table 6: Global Surface Disinfectant Market Size (US$ Mn) Forecast, by Application, 2015–2024
Table 7: Global Surface Disinfectants Volume (Tons) and Forecast, by Region, 2015–2024
Table 8: Global Surface Disinfectants Market Size (US$ Mn) and Forecast, by Region, 2015–2024
Table 9: North America Surface Disinfectants Market Volume (Tons) Forecast, by Product, 2015–2024
Table 10: North America Surface Disinfectants Market Size (US$ Mn) Forecast, by Product, 2015–2024
Table 11: North America Surface Disinfectants Market Volume (Tons) Forecast, by Type, 2015–2024
Table 12: North America Surface Disinfectants Market Size (US$ Mn) Forecast, by Application, 2015–2024
Table 13: North America Surface Disinfectants Market Volume (Tons) Forecast, by Application, 2015–2024
Table 14: North America Surface Disinfectants Market Size (US$ Mn) Forecast, by Application, 2015–2024
Table 15: North America Surface Disinfectants Market Volume (Tons) Forecast, by Country, 2015–2024
Table 16: North America Surface Disinfectants Market Size (US$ Mn) Forecast, by Country, 2015–2024
Table 17: Europe Surface Disinfectants Market Volume (Tons) Forecast, by Product, 2015–2024
Table 18: Europe Surface Disinfectants Market Size (US$ Mn) Forecast, by Product, 2015–2024
Table 19: Europe Surface Disinfectants Market Volume (Tons) Forecast, by Type, 2015–2024
Table 20: Europe Surface Disinfectants Market Size (US$ Mn) Forecast, by Type, 2015–2024
Table 21: Europe Surface Disinfectants Market Volume (Tons) Forecast, by Application, 2015–2024
Table 22: Europe Surface Disinfectants Market Size (US$ Mn) Forecast, by Application, 2015–2024
Table 23: Europe Surface Disinfectants Market Volume (Tons) Forecast, by Country, 2015–2024
Table 24: Europe Surface Disinfectants Market Size (US$ Mn) Forecast, by Country, 2015–2024
Table 25: Asia Pacific Surface Disinfectants Market Volume (Tons) Forecast, by Product, 2015–2024
Table 26: Asia Pacific Surface Disinfectants Market Size (US$ Mn) Forecast, by Product, 2015–2024
Table 27: Asia Pacific Surface Disinfectants Market Volume (Tons) Forecast, by Type, 2015–2024
Table 28: Asia Pacific Surface Disinfectants Market Size (US$ Mn) Forecast, by Type, 2015–2024
Table 29: Asia Pacific Surface Disinfectants Market Volume (Tons) Forecast, by Application, 2015–2024
Table 30: Asia Pacific Surface Disinfectants Market Size (US$ Mn) Forecast, by Application, 2015–2024
Table 31: Asia Pacific Surface Disinfectants Market Volume (Tons) Forecast, by Country, 2015–2024
Table 32: Asia Pacific Surface Disinfectants Market Size (US$ Mn) Forecast, by Country, 2015–2024
Table 33: Latin America Surface Disinfectants Market Volume (Tons) Forecast, by Product, 2015–2024
Table 34: Latin America Surface Disinfectants Market Size (US$ Mn) Forecast, by Product, 2015–2024
Table 35: Latin America Surface Disinfectants Market Volume (Tons) Forecast, by Type, 2015–2024
Table 36: Latin America Surface Disinfectants Market Size (US$ Mn) Forecast, by Type, 2015–2024
Table 37: Latin America Surface Disinfectants Market Volume (Tons) Forecast, by Application, 2015–2024
Table 38: Latin America Surface Disinfectants Market Size (US$ Mn) Forecast, by Application, 2015–2024
Table 39: Latin America Surface Disinfectants Market Volume (Tons) Forecast, by Country/Sub-region, 2015–2024
Table 40: Latin America Surface Disinfectants Market Size (US$ Mn) Forecast, by Country/Sub-region, 2015–2024
Table 41: Middle East & Africa Surface Disinfectants Market Volume (Tons) Forecast, by Product, 2015–2024
Table 42: Middle East & Africa Surface Disinfectants Market Size (US$ Mn) Forecast, by Product, 2015–2024
Table 43: Middle East & Africa Surface Disinfectants Market Volume (Tons) Forecast, by Type, 2015–2024
Table 44: Middle East & Africa Surface Disinfectants Market Size (US$ Mn) Forecast, by Type, 2015–2024
Table 45: Middle East & Africa (MEA) Surface Disinfectants Market Volume (Tons) Forecast, by Application 2015–2024
Table 46: Middle East & Africa (MEA) Surface Disinfectants Market Size (US$ Mn) Forecast, by Application, 2015–2024
Table 47: Middle East & Africa Surface Disinfectants Market Volume (Tons) Forecast, by Country and Sub-region, 2015–2024
Table 48: Middle East & Africa Surface Disinfectants Market Size (US$ Mn) Forecast, by Country and Sub-region, 2015–2024
List of Figures
Figure 1: Market Snapshot
Figure 2: Proportion by Region, 2016
Figure 3: Share of North America in Terms of Consumption, 2015-2024
Figure 4: Global Surface Disinfectant Market Size (US$ Mn) and Volume (Tons) Analysis, 2015-2024
Figure 5: Global Surface Disinfectant Market Size and Volume, Y-o-Y Growth Projection, 2015-2024
Figure 6: Global Surface Disinfectant Market, Pricing – Actual & Projection (US$/Ton), 2015-2024
Figure 08: Global Surface Disinfectant Manufacturers Market Volume Share, by Type, 2015
Figure 10: Global Surface Disinfectant Manufacturers Market Volume Share, by Region, 2015
Figure 07: Global Surface Disinfectant Manufacturers Market Volume Share, by Product, 2015
Figure 09: Global Surface Disinfectant Manufacturers Market Volume Share, by End-User, 2015
Figure 11: Global Surface Disinfectants Market Size (US$ Mn) and Volume (Tons), by Sodium Hypochlorite, 2015–2024
Figure 12: Global Surface Disinfectants Market Size (US$ Mn) and Volume (Tons), by Phenols, 2015–2024
Figure 13: Global Surface Disinfectants Market Size (US$ Mn) and Volume (Tons), by QACs, 2015–2024
Figure 14: Global Surface Disinfectants Market Size (US$ Mn) and Volume (Tons), by Hydrogen Peroxide, 2015–2024
Figure 15: Global Surface Disinfectants Market Size (US$ Mn) and Volume (Tons), by Peracetic Acid, 2015–2024
Figure 16: Global Surface Disinfectants Market Size (US$ Mn) and Volume (Tons), by Biguanides, 2015–2024
Figure 17: Global Surface Disinfectants Market Size (US$ Mn) and Volume (Tons), by Amphoterics, 2015–2024
Figure 18: Global Surface Disinfectants Market Size (US$ Mn) and Volume (Tons), by Aldehydes, 2015–2024
Figure 19: Global Surface Disinfectants Market Attractiveness Analysis, by Product
Figure 20: Global Surface Disinfectant Market Size (US$ Mn) and Volume (Tons), by Food, 2015–2024
Figure 21: Global Surface Disinfectant Market Size (US$ Mn) and Volume (Tons), by Spray, 2015–2024
Figure 22: Global Surface Disinfectant Market Size (US$ Mn) and Volume (Tons), by Wipes , 2015–2024
Figure 23: Global Surface Disinfectant Market Size (US$ Mn) and Volume (Tons), by Others, 2015–2024
Figure 24: Surface Disinfectant Market Attractiveness Analysis, by Type
Figure 25: Global Surface Disinfectant Market Size (US$ Mn) and Volume (Tons), by Hospitals & Clinics, 2015–2024
Figure 26: Global Surface Disinfectant Market Size (US$ Mn) and Volume (Tons), by Outpatient surgical Centers, 2015–2024
Figure 27: Global Surface Disinfectant Market Size (US$ Mn) and Volume (Tons), by Restaurants & Food Chains, 2015–2024
Figure 28: Global Surface Disinfectant Market Size (US$ Mn) and Volume (Tons), by Households, 2015–2024
Figure 29: Global Surface Disinfectant Market Size (US$ Mn) and Volume (Tons), by Others, 2015–2024
Figure 30: Global Surface Disinfectant Market Attractiveness Analysis, by Application
Figure 31: Global Surface Disinfectants Market Attractiveness Analysis, by Region, 2015
Figure 32: North America Surface Disinfectants Market Revenue (US$ Mn) and Volume (Tons) Forecast, 2015–2024
Figure 33: North America Surface Disinfectants Market Attractiveness Analysis, by Country
Figure 34: North America Surface Disinfectants Market Value Share Analysis, by Products, 2015 and 2024
Figure 35: North America Surface Disinfectants Market Value Share Analysis, by Type, 2015 and 2024
Figure 36: North America Surface Disinfectants Market Value Share Analysis, by Application, 2015 and 2024
Figure 37: North America Surface Disinfectants Market Value Share Analysis, by Country, 2015 and 2024
Figure 38: North America Surface Disinfectants Market Attractiveness Analysis, by Products
Figure 39: North America Surface Disinfectants Market Attractiveness Analysis, by Type
Figure 40: North America Surface Disinfectants Market Attractiveness Analysis, by Application
Figure 41: Europe Surface Disinfectants Market Revenue (US$ Mn) and Volume (Tons) Forecast, 2015–2024
Figure 42: Europe Surface Disinfectants Market Attractiveness Analysis, by Country
Figure 43: Europe Surface Disinfectants Market Value Share Analysis, by Product, 2015 and 2024
Figure 44: Europe Surface Disinfectants Market Value Share Analysis, by Type, 2015 and 2024
Figure 45: Europe Surface Disinfectants Market Value Share Analysis, by Application, 2015 and 2024
Figure 46: Europe Surface Disinfectants Market Value Share Analysis, by Country, 2016 and 2024
Figure 47: Europe Surface Disinfectants Market Attractiveness Analysis, by Product
Figure 48: Europe Surface Disinfectants Market Attractiveness Analysis, by Type
Figure 49: Europe Surface Disinfectants Market Attractiveness Analysis, by Application
Figure 50: Asia Pacific Surface Disinfectants Market Revenue (US$ Mn) and Volume (Tons) Forecast, 2015–2024
Figure 51: Asia Pacific Surface Disinfectants Market Attractiveness Analysis, by Country
Figure 52: Asia Pacific Surface Disinfectants Market Value Share Analysis, by Product, 2015 and 2024
Figure 53: Asia Pacific Surface Disinfectants Market Value Share Analysis, by Type, 2015 and 2024
Figure 54: Asia Pacific Surface Disinfectants Market Value Share Analysis, by Application, 2015 and 2024
Figure 55: Asia Pacific Surface Disinfectants Market Value Share Analysis, by Country, 2016 and 2024
Figure 56: Europe Surface Disinfectants Market Attractiveness Analysis, by Product
Figure 57: Europe Surface Disinfectants Market Attractiveness Analysis, by Type
Figure 58: Europe Surface Disinfectants Market Attractiveness Analysis, by Application
Figure 59: Latin America Surface Disinfectants Market Revenue (US$ Mn) and Volume (Tons) Forecast, 2015–2024
Figure 60: Latin America Surface Disinfectants Market Attractiveness Analysis, by Country
Figure 61: Latin America Surface Disinfectants Market Value Share Analysis, by Product, 2015 and 2024
Figure 62: Latin America Surface Disinfectants Market Value Share Analysis, by Type, 2015 and 2024
Figure 63: Latin America Surface Disinfectants Market Value Share Analysis, by Application, 2015 and 2024
Figure 64: Latin America Surface Disinfectants Market Value Share Analysis, by Country/Sub-region, 2015 and 2024
Figure 65: Latin America Surface Disinfectants Market Attractiveness Analysis, by Product
Figure 66: Latin America Surface Disinfectants Market Attractiveness Analysis, by Type
Figure 67: Latin America Surface Disinfectants Market Attractiveness Analysis, by Application
Figure 68: Middle East & Africa Surface Disinfectants Market Revenue (US$ Mn) and Volume (Tons) Forecast, 2015–2024
Figure 69: Middle East & Africa Surface Disinfectants Market Attractiveness Analysis, by Country and Sub-region
Figure 70: Middle East & Africa Surface Disinfectants Market Value Share Analysis, by Product, 2015 and 2024
Figure 71: Middle East & Africa Surface Disinfectants Market Value Share Analysis, by Type, 2015 and 2024
Figure 72: Middle East & Africa Surface Disinfectants Market Value Share Analysis, by Application, 2015 and 2024
Figure 73: Middle East & Africa Surface Disinfectants Market Value Share Analysis, by Country, 2015 and 2024
Figure 74: Middle East & Africa (MEA) Surface Disinfectants Market Attractiveness Analysis, by Product
Figure 75: Middle East & Africa (MEA) Surface Disinfectants Market Attractiveness Analysis, by Type
Figure 76: Middle East & Africa (MEA) Surface Disinfectants Market Attractiveness Analysis, by Application
Figure 77: Global Surface Disinfectants Market Share Analysis, by Company (2015)
Copyright © Transparency Market Research, Inc. All Rights reserved
Trust Online

Surface Disinfectant Market Outlook, 2015-2024