Reports
Reports
The spectrometry market occupies a unique position at the convergence of advanced instrumentation, expanding pockets of applications (life sciences, pharma, environmental and food testing), and the increased throughput demands on the part of both - R&D and regulated testing.

The investment into higher-resolution instruments and the declining costs of hyphenated instrumentation (e.g., LC-MS and GC-MS) coupled with increasing demands for omics-grade data are prompting buyers in the academic, biotech, and pharma space to refresh and grow their instrument fleets. Market incumbent players are influencing the market in terms of not only incremental improvements (faster scan rates, improved sensitivity, etc.), but the bundling of an assortment of software, services, and consumables that persuade their customers to become entrenched in their systems, which gives them a recurring revenue stream.
Their vendor strategies mean that they are able to create acceleration of the adoption cycle within clinical and industrial labs, whilst squeezing the profit margins of smaller players that are unable to deliver the same breadth of service.
The increasing demand for high-end mass analyzers from adjacent markets, including proteomics and metabolomics, creates exciting aftermarket sales opportunities in reagents, calibration standards, and software analysis. As supply chain resiliency improves and instrument manufacturers establish strategic partnerships with assay developers, there is further opportunity to leverage these ways of increasing adoption in rapid adoption across targeted quantitation and biomarker discovery projects.
Spectrometry expansion is driven by three practical forces. First is regulatory pressure, leading to greater emphasis on sensitive, and trace-level analysis. This has increased demands for sensitive instrumentation and analytical methods. The second driver is the increased use of high-throughput R&D workflows in pharma and biotech with reasonable confidence in reliable and reproducible instrumentation for studies and ultimately clinical trials. This is a supported trend of growth in R&D labs with a corporate accountability model. The third catalyst for growth is the evolution of experiments from bench to data-centric workflows requiring integrated software and informatics.
Demand for environmental monitoring and food safety will continue to push labs to instruments with multi-residue screening capability while clinical research and translational labs look for reliable platforms for biomarker validation. Investments by government and academic institutions in core facilities and collaborative instrumentation pools reduce the barriers to entry for smaller research groups, expanding the potential user base of mid-tier and high-tier spectrometers.
| Attribute | Detail |
|---|---|
| Spectrometry Market Drivers |
|
The developments in proteomics, metabolomics, and the other omics disciplines are, in many ways, the strongest technical forces behind current and future demand for spectrometry. These fields require sensitivity, mass accuracy, and some dynamic range to quantify low abundance proteins or proteoforms, post-translational modifications, and complex metabolite panels.
Since the academic lab, core facility or biopharma lab will be needing to scale many proteomic workflows, funding is moving away from instruments to integrated LC- MS systems, robotics, and data pipelines to handle many samples.
For instance, rapid growth in proteomics markets - billions of dollars and double-digit CAGRs - which are directly correlated to increased purchases of mass spectrometers and reagents to support translational research and drug discovery efforts. The corresponding imposition of an ecosystem helps to lift usage attachment rates and repeat revenue for vendors who support omics workflows, while also fostering partnerships between instrument vendors and proteomics software vendors to bring turnkey solutions to market.
Regulators around the world are reducing detection limits and requiring even larger panels of contaminants and residues analytes, which ultimately leads testing laboratories to modernize outdated analytical measuring devices to meet trace-level specifications and validated method protocols.
The current trend is increasing demand for hyphenated systems (e.g., LC-MS/MS) that can provide selectivity and robustness with high sample loads, as well as combinations of vendors who are able to provide validated methods with proficiency testing assistance. For example, numerous market studies in this space highlight food-safety and environmental testing as recurring adoption drivers for mass spectrometry, an effect seen where publicized contamination events or newly enacted regulatory limits trigger substantial procurement and capacity development programs at accredited laboratories.
The conclusion is increasingly predictable procurements of instruments, along with a structural increase in demand for training, method validation/confirmation services, and long-term service agreements from both - OEMs and specialty service providers.

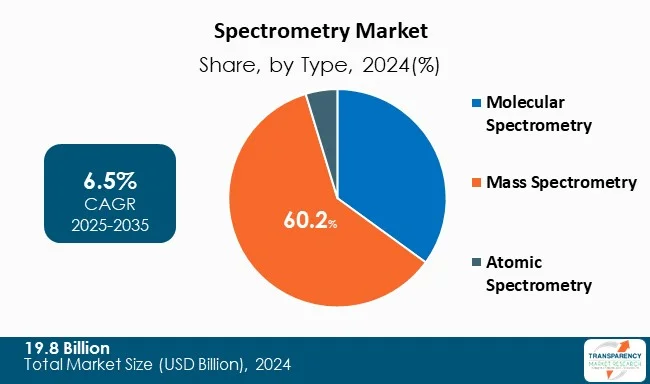
Mass spectrometry is the leading technology in the broader field of spectrometry as it offers unrivaled sensitivity, specificity, and versatility across various sample types, ranging from small molecules and metabolites to intact proteins and polymers. Since these are common spectra of mass spectrometry use cases. Mass spectrometers are the platform of choice for quantitative targeted assays, untargeted discovery workflows, and regulatory testing where the unequivocal identification of a substance is required.
Mass analyzers are versatile (triple quadrupole, Q-TOF, orbitrap/FTMS); combined with the maturity of hyphenated methods such as LC-MS or GC-MS; meaning that mass spectrometry is the go-to path when selectivity and low detection limits are required. Vendors have bolstered this status with software that facilitates automated quantitation, spectral libraries, and cloud analytics for managing the data burden associated with modern workflows.
Several industry reports and market analyses identify mass spectrometry as the single largest sub-segment within spectrometry product categories and reflect upon its central role in pharma analytics, omics research, and regulated testing..

| Attribute | Detail |
|---|---|
| Leading Region |
|
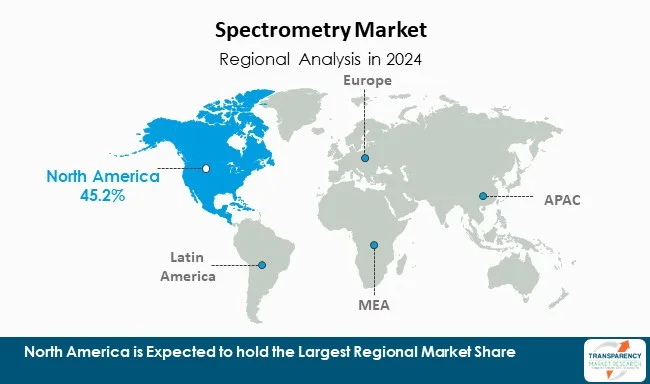
North America leads the world in the uptake of spectrometry due to concentrated R&D intensity, substantial clinical research infrastructure, and funding at both - public and private, for analytical and life science platforms. It is the U.S. that is the driving force in the region, where pharmaceutical, biotechnology, and academic institutions operate large ecosystems of core facilities and routinely upgrade to the latest generations of instruments to support competitive drug discovery and drug translational programs. Vendors have a significant presence, with all major manufacturers operating regional service networks and local application support groups that mitigate friction for more complex methods.
Regional analyses highlight that the United States commands a significant share of North America’s market revenue, driven by the high penetration of instruments in both - pharma/biotech and the extensive use of spectrometry in clinical and environmental testing programs, which translates into demand for consumables, standard calibrants, and preventative maintenance that augment their revenue models in the region as well.
Given the magnitude of investment, ongoing regulatory activity and the density of the user base among large institutions means North America will continue to outperform the other regions in terms of per-lab instrument spend and adoption of high-end mass-spectrometry workflows.
Key players operating in the spectrometry industry are investing in innovation, strategic partnerships, and technological advancements. They emphasize enhancing imaging clarity and expanding product portfolios, thereby ascertaining sustained growth and leadership in the evolving healthcare landscape.
Thermo Fisher Scientific, Inc., Agilent Technologies, Inc., Perkin Elmer, Inc., WATERS CORPORATION, Shimadzu Corporation, Bruker Corporation, JEOL Ltd., Flir Systems Inc., Endress+Hauser Group Services AG, MKS Instruments, Inc. are the key players in spectrometry market.
Each of these players has been profiled in the spectrometry market research report based on parameters such as company overview, financial overview, business strategies, product portfolio, business segments, and recent developments.
| Attribute | Detail |
|---|---|
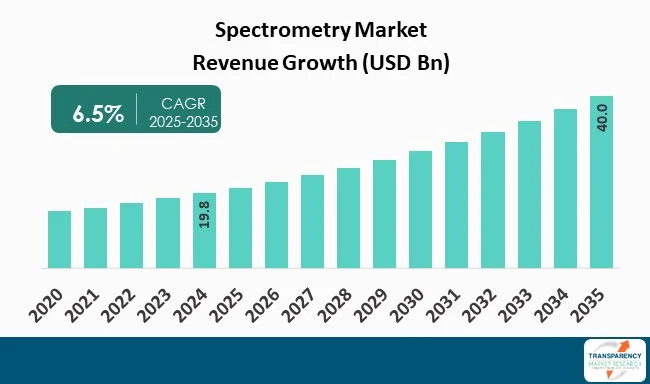
| Size in 2024 | US$ 19.8 Bn |
| Forecast Value in 2035 | US$ 40.0 Bn |
| CAGR | 6.5% |
| Forecast Period | 2025-2035 |
| Historical Data Available for | 2020-2023 |
| Quantitative Units | US$ Bn |
| Spectrometry Market Analysis | It includes segment analysis as well as regional level analysis. Moreover, qualitative analysis includes drivers, restraints, opportunities, key trends, value chain analysis, and key trend analysis. |
| Competition Landscape |
|
| Format | Electronic (PDF) + Excel |
| Segmentation | Component
|
| Regions Covered |
|
| Countries Covered |
|
| Companies Profiled |
|
| Customization Scope | Available upon request |
| Pricing | Available upon request |
The spectrometry market was valued at US$ 19.8 Bn in 2024
The spectrometry market is projected to cross US$ 40.0 Bn by the end of 2035
Expansion of proteomics and omics research and Regulatory pressure and expansion of testing
The CAGR is anticipated to be 6.5% from 2025 to 2035
North America is expected to account for the largest share from 2025 to 2035
Thermo Fisher Scientific, Inc., Agilent Technologies, Inc., Perkin Elmer, Inc., WATERS CORPORATION, Shimadzu Corporation, Bruker Corporation, JEOL Ltd., Flir Systems Inc., Endress+Hauser Group Services AG, MKS Instruments, Inc., and others
Table 01: Global Spectrometry Market Value (US$ Bn) Forecast, by Component, 2020 to 2035
Table 02: Global Spectrometry Market Value (US$ Bn) Forecast, By Type, 2020 to 2035
Table 03: Global Spectrometry Market Value (US$ Bn) Forecast, By Molecular Spectrometry, 2020 to 2035
Table 04: Global Spectrometry Market Value (US$ Bn) Forecast, By Mass Spectrometry, 2020 to 2035
Table 05: Global Spectrometry Market Value (US$ Bn) Forecast, By Atomic Spectrometry, 2020 to 2035
Table 06: Global Spectrometry Market Value (US$ Bn) Forecast, By Application, 2020 to 2035
Table 07: Global Spectrometry Market Value (US$ Bn) Forecast, by End-user, 2020 to 2035
Table 08: Global Spectrometry Market Value (US$ Bn) Forecast, By Region, 2020 to 2035
Table 09: North America Spectrometry Market Value (US$ Bn) Forecast, by Country, 2020-2035
Table 10: North America Spectrometry Market Value (US$ Bn) Forecast, by Component, 2020 to 2035
Table 11: North America Spectrometry Market Value (US$ Bn) Forecast, by Type, 2020 to 2035
Table 12: North America Spectrometry Market Value (US$ Bn) Forecast, By Application, 2020 to 2035
Table 13: North America Spectrometry Market Value (US$ Bn) Forecast, by End-user, 2020 to 2035
Table 14: Europe Spectrometry Market Value (US$ Bn) Forecast, by Country/Sub-region, 2020-2035
Table 15: Europe Spectrometry Market Value (US$ Bn) Forecast, by Component, 2020 to 2035
Table 16: Europe Spectrometry Market Value (US$ Bn) Forecast, by Type, 2020 to 2035
Table 17: Europe Spectrometry Market Value (US$ Bn) Forecast, By Application, 2020 to 2035
Table 18: Europe Spectrometry Market Value (US$ Bn) Forecast, by End-user, 2020 to 2035
Table 19: Asia Pacific Spectrometry Market Value (US$ Bn) Forecast, by Country/Sub-region, 2020-2035
Table 20: Asia Pacific Spectrometry Market Value (US$ Bn) Forecast, by Component, 2020 to 2035
Table 21: Asia Pacific Spectrometry Market Value (US$ Bn) Forecast, by Type, 2020 to 2035
Table 22: Asia Pacific Spectrometry Market Value (US$ Bn) Forecast, By Application, 2020 to 2035
Table 23: Asia Pacific Spectrometry Market Value (US$ Bn) Forecast, by End-user, 2020 to 2035
Table 24: Latin America Spectrometry Market Value (US$ Bn) Forecast, by Country/Sub-region, 2020-2035
Table 25: Latin America Spectrometry Market Value (US$ Bn) Forecast, by Component, 2020 to 2035
Table 26: Latin America Spectrometry Market Value (US$ Bn) Forecast, by Type, 2020 to 2035
Table 27: Latin America Spectrometry Market Value (US$ Bn) Forecast, By Application, 2020 to 2035
Table 28: Latin America Spectrometry Market Value (US$ Bn) Forecast, by End-user, 2020 to 2035
Table 29: Middle East & Africa Spectrometry Market Value (US$ Bn) Forecast, by Country/Sub-region, 2020-2035
Table 30: Middle East and Africa Spectrometry Market Value (US$ Bn) Forecast, by Component, 2020 to 2035
Table 31: Middle East and Africa Spectrometry Market Value (US$ Bn) Forecast, by Type, 2020 to 2035
Table 32: Middle East and Africa Spectrometry Market Value (US$ Bn) Forecast, By Application, 2020 to 2035
Table 33: Middle East and Africa Spectrometry Market Value (US$ Bn) Forecast, by End-user, 2020 to 2035
Figure 01: Global Spectrometry Market Value Share Analysis, by Component, 2024 and 2035
Figure 02: Global Spectrometry Market Attractiveness Analysis, by Component, 2025 to 2035
Figure 03: Global Spectrometry Market Revenue (US$ Bn), by Instruments, 2020 to 2035
Figure 04: Global Spectrometry Market Revenue (US$ Bn), by Consumables, 2020 to 2035
Figure 05: Global Spectrometry Market Value Share Analysis, by Type, 2024 and 2035
Figure 06: Global Spectrometry Market Attractiveness Analysis, by Type, 2025 to 2035
Figure 07: Global Spectrometry Market Revenue (US$ Bn), by Molecular Spectrometry, 2020 to 2035
Figure 08: Global Spectrometry Market Revenue (US$ Bn), by Mass Spectrometry, 2020 to 2035
Figure 09: Global Spectrometry Market Revenue (US$ Bn), by Atomic Spectrometry, 2020 to 2035
Figure 10: Global Spectrometry Market Value Share Analysis, by Application, 2024 and 2035
Figure 11: Global Spectrometry Market Attractiveness Analysis, by Application, 2025 to 2035
Figure 12: Global Spectrometry Market Revenue (US$ Bn), by Proteomics, 2020 to 2035
Figure 13: Global Spectrometry Market Revenue (US$ Bn), by Metabolomics, 2020 to 2035
Figure 14: Global Spectrometry Market Revenue (US$ Bn), by Pharmaceutical Analysis, 2020 to 2035
Figure 15: Global Spectrometry Market Revenue (US$ Bn), by Forensic Analysis, 2020 to 2035
Figure 16: Global Spectrometry Market Revenue (US$ Bn), by Others, 2020 to 2035
Figure 17: Global Spectrometry Market Value Share Analysis, by End-user, 2024 and 2035
Figure 18: Global Spectrometry Market Attractiveness Analysis, by End-user, 2025 to 2035
Figure 19: Global Spectrometry Market Revenue (US$ Bn), by Government & Academic Institutions , 2020 to 2035
Figure 20: Global Spectrometry Market Revenue (US$ Bn), by Pharmaceutical & Biotechnology Companies, 2020 to 2035
Figure 21: Global Spectrometry Market Revenue (US$ Bn), by Others, 2020 to 2035
Figure 22: Global Spectrometry Market Value Share Analysis, By Region, 2024 and 2035
Figure 23: Global Spectrometry Market Attractiveness Analysis, By Region, 2025 to 2035
Figure 24: North America Spectrometry Market Value (US$ Bn) Forecast, 2020 to 2035
Figure 25: North America Spectrometry Market Value Share Analysis, by Country, 2024 and 2035
Figure 26: North America Spectrometry Market Attractiveness Analysis, by Country, 2025 to 2035
Figure 27: North America Spectrometry Market Value Share Analysis, by Component, 2024 and 2035
Figure 28: North America Spectrometry Market Attractiveness Analysis, by Component, 2025 to 2035
Figure 29: North America Spectrometry Market Attractiveness Analysis, by Type, 2025 to 2035
Figure 30: North America Spectrometry Market Attractiveness Analysis, by Type, 2025 to 2035
Figure 31: North America Spectrometry Market Value Share Analysis, by Application, 2024 and 2035
Figure 32: North America Spectrometry Market Attractiveness Analysis, by Application, 2025 to 2035
Figure 33: North America Spectrometry Market Value Share Analysis, by End-user, 2024 and 2035
Figure 34: North America Spectrometry Market Attractiveness Analysis, by End-user, 2025 to 2035
Figure 35: Europe Spectrometry Market Value (US$ Bn) Forecast, 2020 to 2035
Figure 36: Europe Spectrometry Market Value Share Analysis, by Country/Sub-region, 2024 and 2035
Figure 37: Europe Spectrometry Market Attractiveness Analysis, by Country/Sub-region, 2025 to 2035
Figure 38: Europe Spectrometry Market Value Share Analysis, by Component, 2024 and 2035
Figure 39: Europe Spectrometry Market Attractiveness Analysis, by Component, 2025 to 2035
Figure 40: Europe Spectrometry Market Value Share Analysis, by Type, 2024 and 2035
Figure 41: Europe Spectrometry Market Attractiveness Analysis, by Type, 2025 to 2035
Figure 42: Europe Spectrometry Market Value Share Analysis, By Application, 2024 and 2035
Figure 43: Europe Spectrometry Market Attractiveness Analysis, By Application, 2025 to 2035
Figure 44: Europe Spectrometry Market Value Share Analysis, by End-user, 2024 and 2035
Figure 45: Europe Spectrometry Market Attractiveness Analysis, by End-user, 2025 to 2035
Figure 46: Asia Pacific Spectrometry Market Value (US$ Bn) Forecast, 2020 to 2035
Figure 47: Asia Pacific Spectrometry Market Value Share Analysis, by Country/Sub-region, 2024 and 2035
Figure 48: Asia Pacific Spectrometry Market Attractiveness Analysis, by Country/Sub-region, 2025 to 2035
Figure 49: Asia Pacific Spectrometry Market Value Share Analysis, by Component, 2024 and 2035
Figure 50: Asia Pacific Spectrometry Market Attractiveness Analysis, by Component, 2025 to 2035
Figure 51: Asia Pacific Spectrometry Market Value Share Analysis, by Type, 2024 and 2035
Figure 52: Asia Pacific Spectrometry Market Attractiveness Analysis, by Type, 2025 to 2035
Figure 53: Asia Pacific Spectrometry Market Value Share Analysis, By Application, 2024 and 2035
Figure 54: Asia Pacific Spectrometry Market Attractiveness Analysis, By Application, 2025 to 2035
Figure 55: Asia Pacific Spectrometry Market Value Share Analysis, by End-user, 2024 and 2035
Figure 56: Asia Pacific Spectrometry Market Attractiveness Analysis, by End-user, 2025 to 2035
Figure 57: Latin America Spectrometry Market Value (US$ Bn) Forecast, 2020 to 2035
Figure 58: Latin America Spectrometry Market Value Share Analysis, by Country/Sub-region, 2024 and 2035
Figure 59: Latin America Spectrometry Market Attractiveness Analysis, by Country/Sub-region, 2025 to 2035
Figure 60: Latin America Spectrometry Market Value Share Analysis, by Component, 2024 and 2035
Figure 61: Latin America Spectrometry Market Attractiveness Analysis, by Component, 2025 to 2035
Figure 62: Latin America Spectrometry Market Attractiveness Analysis, by Type, 2025 to 2035
Figure 63: Latin America Spectrometry Market Value Share Analysis, by Application, 2024 and 2035
Figure 64: Latin America Spectrometry Market Value Share Analysis, By Application, 2024 and 2035
Figure 65: Latin America Spectrometry Market Attractiveness Analysis, By Application, 2025 to 2035
Figure 66: Latin America Spectrometry Market Value Share Analysis, by End-user, 2024 and 2035
Figure 67: Latin America Spectrometry Market Attractiveness Analysis, by End-user, 2025 to 2035
Figure 68: Middle East & Africa Spectrometry Market Value (US$ Bn) Forecast, 2020 to 2035
Figure 69: Middle East & Africa Spectrometry Market Value Share Analysis, by Country/Sub-region, 2024 and 2035
Figure 70: Middle East & Africa Spectrometry Market Attractiveness Analysis, by Country/Sub-region, 2025 to 2035
Figure 71: Middle East and Africa Spectrometry Market Value Share Analysis, by Component, 2024 and 2035
Figure 72: Middle East and Africa Spectrometry Market Attractiveness Analysis, by Component, 2025 to 2035
Figure 73: Middle East and Africa Spectrometry Market Attractiveness Analysis, by Type, 2025 to 2035
Figure 74: Middle East and Africa Spectrometry Market Value Share Analysis, by Application, 2024 and 2035
Figure 75: Middle East and Africa Spectrometry Market Value Share Analysis, by Application, 2024 and 2035
Figure 76: Middle East and Africa Spectrometry Market Attractiveness Analysis, By Application, 2025 to 2035
Figure 77: Middle East and Africa Spectrometry Market Value Share Analysis, by End-user, 2024 and 2035
Figure 78: Middle East and Africa Spectrometry Market Attractiveness Analysis, by End-user, 2025 to 2035