
Reports
Reports
Analysts’ Viewpoint on Sodium Lauryl Ether Sulfate (SLES) Market Scenario
Sodium lauryl ether sulfate (SLES) is the most common surfactant used in the production of soaps and detergents. The compound continues to be a preferred choice of domestic product manufacturers primarily due to its low cost and excellent performance. Increase in adoption of sodium lauryl ether sulfate (SLES) in various end-use industries can be ascribed to its properties such as good solvency, favorable hard water resistance, and high biodegradation. SLES is used in products such as dishwashing liquids and shampoos owing to its lower degree of skin irritation and ease of compaction. However, rise in availability of bio-based chemicals is projected to restrain the global sodium lauryl ether sulfate (SLES) market in the next few years. Therefore, companies have started focusing on developing environment-friendly and bio-based SLES surfactants to gain revenue benefits.
Sodium lauryl ether sulfate (SLES) is used as a cleansing agent for different products. It is a yellowish-white paste that works as an anionic surfactant in various personal care products such as soaps and cosmetics. Sodium lauryl ether sulfate liquid is derived from natural sources such as coconut oil and palm kernel oil. SLES lowers the surface tension between ingredients of a product. This unique property makes it an ideal foaming and cleansing agent.
The sodium lauryl ether sulfate (SLES) market size is projected to increase during the forecast period, owing to the rise in adoption of sodium lauryl sulfate in several personal care products, industrial cleaners, and food industry. Key market players, manufacturers, and sodium lauryl ether sulfate (SLES) suppliers are exploring growth opportunities in the global market by following sodium lauryl ether sulfate (SLES) market trends.
Liquid detergents are gaining popularity due to their outstanding cleaning properties, ease of application, and cost efficiency. Rise in population and considerable increase in disposable income, primarily in emerging economies, have augmented the demand for efficient detergents. This, in turn, has resulted in a significant rise in sales of liquid detergents. Increase in popularity of laundry services in developing countries along with rapid urbanization has also positively impacted the market demand for liquid detergents. Sodium lauryl ether sulfate (SLES) is used extensively in liquid detergents such as dishwashing detergents, shampoos, bubble bath liquids, and hand washing products. Excellent detergency and compatibility with all other types of surfactants make SLES one of the most preferred primary surfactants for liquid detergents. Thus, growth in the liquid detergent market is anticipated to fuel the demand for SLES during the forecast period.
The global personal care market is likely to grow at a CAGR of 5.8% during the forecast period. Increase in awareness about personal hygiene, rise in disposable income, economic development in emerging economies, and improvement in standard of living in several developing regions are some of the key factors projected to drive the demand for personal care products in the next few years. Growth of e-commerce and increase in youth population have significantly boosted the demand for modern personal care products among end-users. The personal care products market in India, Africa, and the Middle East is anticipated to grow at a CAGR of 7.9%, 3.4%, and 4.2%, respectively, during the forecast period.
Sodium lauryl ether sulfate (SLES) is used in a wide range of applications in personal care products such as skin care, hair care, and oral care products due to its chemical stability and mildness on skin compared to other anionic surfactants such as alkyl-benzene sulfonates, phosphoric acid esters, and carboxylic acid salts. Increase in demand for sodium lauryl ether sulfate for hair care products is creating lucrative opportunities for manufacturers across the globe. On the other hand, several international agencies, with the support of local governments, are promoting hygiene awareness programs in developing countries. This is anticipated to fuel the demand for anionic surfactants such as SLES during the forecast period, considering their superior performance properties and cost-effectiveness compared to other alternatives. Thus, rise in demand for personal care products and growth in awareness about personal hygiene are estimated to augment the demand for SLES during the forecast period.
In terms of form, the global sodium lauryl ether sulfate (SLES) market has been classified into dry and liquid. The dry segment held major share of the global sodium lauryl ether sulfate (SLES) market in 2021. It is anticipated to grow at a CAGR of 4.2% during the forecast period. Dry SLES is primarily used in developing countries due to its ease of production and wide range of applications in inexpensive detergents and personal care products. The dry segment includes granular, powder, and paste forms. Dry sodium lauryl ether sulfate, which is in the paste form, is used in personal care applications such as toothpaste, liquid soaps, hair shampoos, creams & lotions, foam baths, and toilet bars. Thus, rise in demand for dry SLES is expected to increase the global sodium lauryl ether sulfate (SLES) market share during the forecast period.
Asia Pacific dominated the global sodium lauryl ether sulfate (SLES) market with approximately 31.0% share in 2021. The region’s share is estimated to reach 31.7% by 2031. Rise in disposable income in emerging economies such as China and India has led to an improvement in the lifestyle of the people. This is driving the demand for detergents and cleaners, and personal care products in the region. Growth in end-use industries and increase in penetration of washing machines are projected to augment the demand for SLES in Asia Pacific.
North America and Europe are attractive regions of the global sodium lauryl ether sulfate (SLES) market due to the presence of established personal care and detergent industries. However, rise in trend of using sulfate-free personal care products in developed countries such as the U.S, Germany, and France is likely to hamper the sodium lauryl ether sulfate (SLES) market in these regions during the forecast period.
The global sodium lauryl ether sulfate (SLES) market is highly consolidated, with a small number of large-scale vendors controlling majority of the share. Most of the companies are investing significantly in comprehensive research and development activities, primarily to introduce environment-friendly products. Expansion of product portfolios and mergers and acquisitions are the key strategies adopted by prominent players. Croda International Plc, Huntsman International LLC, Solvay, BASF SE, and Evonik Industries AG are the key entities operating in the market.
Each of these players has been profiled in the sodium lauryl ether sulfate (SLES) market report based on parameters such as company overview, financial overview, business strategies, product portfolio, business segments, and recent developments.
|
Attribute |
Detail |
|
Market Size Value in 2021 |
US$ 1.4 Bn |
|
Market Forecast Value in 2031 |
US$ 2.0 Bn |
|
Growth Rate (CAGR) |
4.3% |
|
Forecast Period |
2022–2031 |
|
Historical Data Available for |
2020 |
|
Quantitative Units |
US$ Bn for Value & Kilo Tons for Volume |
|
Market Analysis |
It includes cross-segment analysis at the global as well as regional level. Furthermore, the qualitative analysis includes drivers, restraints, opportunities, key trends, Porter’s Five Forces analysis, value chain analysis, and key trend analysis. |
|
Competition Landscape |
|
|
Format |
Electronic (PDF) + Excel |
|
Market Segmentation |
|
|
Regions Covered |
|
|
Countries Covered |
|
|
Companies Profiled |
|
|
Customization Scope |
Available upon request |
|
Pricing |
Available upon request |
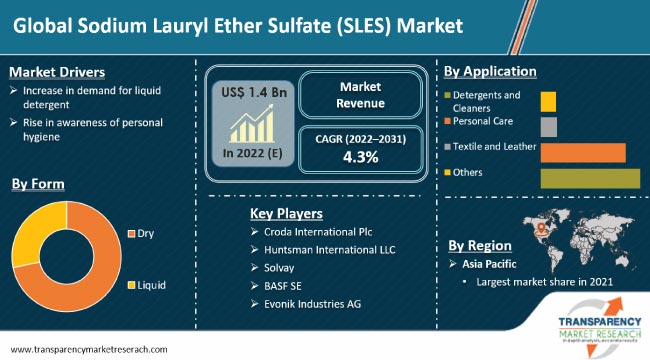
The sodium lauryl ether sulfate (SLES) market stood at US$ 1.4 Bn in 2021
The sodium lauryl ether sulfate (SLES) market is expected to grow at a CAGR of 4.3% from 2022 to 2031
Increase in demand for liquid detergent and rise in awareness of personal hygiene
The dry form segment is expected to account for the largest share of the global sodium lauryl ether sulfate (SLES) market during the forecast period
Asia Pacific was the most lucrative region and held 31% share of the global sodium lauryl ether sulfate (SLES) market in 2021
Croda International Plc, Huntsman International LLC, Solvay, BASF SE, and Evonik Industries AG
1. Executive Summary
1.1. Sodium Lauryl Ether Sulfate (SLES) Market Snapshot
1.2. Current Market and Future Potential
2. Market Overview
2.1. Market Segmentation
2.2. Market Trends
2.3. Market Dynamics
2.3.1. Drivers
2.3.2. Restraints
2.3.3. Opportunities
2.4. Porter’s Five Forces Analysis
2.5. Regulatory Analysis
2.6. Value Chain Analysis
2.6.1. List of Raw Forms Providers
2.6.2. List of Sodium Lauryl Ether Sulfate (SLES) Manufacturers
2.6.3. List of Dealers/Distributors
2.6.4. List of Potential Customer
3. COVID-19 Impact Analysis
4. Sodium Lauryl Ether Sulfate (SLES) Market Analysis and Forecast, by Form, 2022–2031
4.1. Introduction and Definitions
4.2. Global Sodium Lauryl Ether Sulfate (SLES) Market Volume (Kilo Tons) and Value (US$ Bn) Forecast, by Form, 2022–2031
4.2.1. Dry
4.2.2. Liquid
4.3. Global Sodium Lauryl Ether Sulfate (SLES) Market Attractiveness, by Form
5. Global Sodium Lauryl Ether Sulfate (SLES) Market Analysis and Forecast, Application, 2022–2031
5.1. Introduction and Definitions
5.2. Global Sodium Lauryl Ether Sulfate (SLES) Market Volume (Kilo Tons) and Value (US$ Bn) Forecast, by Application, 2022–2031
5.2.1. Detergents and Cleaners
5.2.1.1. Laundry Care
5.2.1.2. Dishwashers
5.2.1.3. Industrial Cleaners
5.2.2. Personal Care
5.2.2.1. Hair Care
5.2.2.2. Skin Care
5.2.2.3. Oral Care
5.2.3. Textile and Leather
5.2.4. Others
5.3. Global Sodium Lauryl Ether Sulfate (SLES) Market Attractiveness, by Application
6. Global Sodium Lauryl Ether Sulfate (SLES) Market Analysis and Forecast, by Region, 2022–2031
6.1. Key Findings
6.2. Global Sodium Lauryl Ether Sulfate (SLES) Market Volume (Kilo Tons) and Value (US$ Bn) Forecast, by Region, 2022–2031
6.2.1. North America
6.2.2. Europe
6.2.3. Asia Pacific
6.2.4. Latin America
6.2.5. Middle East & Africa
6.3. Global Sodium Lauryl Ether Sulfate (SLES) Market Attractiveness, by Region
7. North America Sodium Lauryl Ether Sulfate (SLES) Market Analysis and Forecast, 2022–2031
7.1. Key Findings
7.2. North America Sodium Lauryl Ether Sulfate (SLES) Market Volume (Kilo Tons) and Value (US$ Bn) Forecast, by Form, 2022–2031
7.3. North America Sodium Lauryl Ether Sulfate (SLES) Market Volume (Kilo Tons) and Value (US$ Bn) Forecast, by Application, 2022–2031
7.4. North America Sodium Lauryl Ether Sulfate (SLES) Market Volume (Kilo Tons) and Value (US$ Bn) Forecast, by Country, 2022–2031
7.4.1. U.S. Sodium Lauryl Ether Sulfate (SLES) Market Volume (Kilo Tons) and Value (US$ Bn) Forecast, by Form, 2022–2031
7.4.2. U.S. Sodium Lauryl Ether Sulfate (SLES) Market Volume (Kilo Tons) and Value (US$ Bn) Forecast, Application, 2022–2031
7.4.3. Canada Sodium Lauryl Ether Sulfate (SLES) Market Volume (Kilo Tons) and Value (US$ Bn) Forecast, by Form, 2022–2031
7.4.4. Canada Sodium Lauryl Ether Sulfate (SLES) Market Volume (Kilo Tons) and Value (US$ Bn) Forecast, Application, 2022–2031
7.5. North America Sodium Lauryl Ether Sulfate (SLES) Market Attractiveness Analysis
8. Europe Sodium Lauryl Ether Sulfate (SLES) Market Analysis and Forecast, 2022–2031
8.1. Key Findings
8.2. Europe Sodium Lauryl Ether Sulfate (SLES) Market Volume (Kilo Tons) and Value (US$ Bn) Forecast, by Form, 2022–2031
8.3. Europe Sodium Lauryl Ether Sulfate (SLES) Market Volume (Kilo Tons) and Value (US$ Bn) Forecast, by Application, 2022–2031
8.4. Europe Sodium Lauryl Ether Sulfate (SLES) Market Volume (Kilo Tons) and Value (US$ Bn) Forecast, by Country and Sub-region, 2021-2031
8.4.1. Germany Sodium Lauryl Ether Sulfate (SLES) Market Volume (Kilo Tons) and Value (US$ Bn) Forecast, by Form, 2022–2031
8.4.2. Germany. Sodium Lauryl Ether Sulfate (SLES) Market Volume (Kilo Tons) and Value (US$ Bn) Forecast, Application, 2022–2031
8.4.3. France Sodium Lauryl Ether Sulfate (SLES) Market Volume (Kilo Tons) and Value (US$ Bn) Forecast, by Form, 2022–2031
8.4.4. France. Sodium Lauryl Ether Sulfate (SLES) Market Volume (Kilo Tons) and Value (US$ Bn) Forecast, Application, 2022–2031
8.4.5. U.K. Sodium Lauryl Ether Sulfate (SLES) Market Volume (Kilo Tons) and Value (US$ Bn) Forecast, by Form, 2022–2031
8.4.6. U.K. Sodium Lauryl Ether Sulfate (SLES) Market Volume (Kilo Tons) and Value (US$ Bn) Forecast, Application, 2022–2031
8.4.7. Italy Sodium Lauryl Ether Sulfate (SLES) Market Volume (Kilo Tons) and Value (US$ Bn) Forecast, by Form, 2022–2031
8.4.8. Italy Sodium Lauryl Ether Sulfate (SLES) Market Volume (Kilo Tons) and Value (US$ Bn) Forecast, Application, 2022–2031
8.4.9. Russia & CIS Sodium Lauryl Ether Sulfate (SLES) Market Volume (Kilo Tons) and Value (US$ Bn) Forecast, by Form, 2022–2031
8.4.10. Russia & CIS Sodium Lauryl Ether Sulfate (SLES) Market Volume (Kilo Tons) and Value (US$ Bn) Forecast, Application, 2022–2031
8.4.11. Rest of Europe Sodium Lauryl Ether Sulfate (SLES) Market Volume (Kilo Tons) and Value (US$ Bn) Forecast, by Form, 2022–2031
8.4.12. Rest of Europe Sodium Lauryl Ether Sulfate (SLES) Market Volume (Kilo Tons) and Value (US$ Bn) Forecast, Application, 2022–2031
8.5. Europe Sodium Lauryl Ether Sulfate (SLES) Market Attractiveness Analysis
9. Asia Pacific Sodium Lauryl Ether Sulfate (SLES) Market Analysis and Forecast, 2022–2031
9.1. Key Findings
9.2. Asia Pacific Sodium Lauryl Ether Sulfate (SLES) Market Volume (Kilo Tons) and Value (US$ Bn) Forecast, by Form
9.3. Asia Pacific Sodium Lauryl Ether Sulfate (SLES) Market Volume (Kilo Tons) and Value (US$ Bn) Forecast, by Application, 2022–2031
9.4. Asia Pacific Sodium Lauryl Ether Sulfate (SLES) Market Volume (Kilo Tons) and Value (US$ Bn) Forecast, by Country and Sub-region, 2021-2031
9.4.1. China Sodium Lauryl Ether Sulfate (SLES) Market Volume (Kilo Tons) and Value (US$ Bn) Forecast, by Form, 2022–2031
9.4.2. China Sodium Lauryl Ether Sulfate (SLES) Market Volume (Kilo Tons) and Value (US$ Bn) Forecast, Application, 2022–2031
9.4.3. Japan Sodium Lauryl Ether Sulfate (SLES) Market Volume (Kilo Tons) and Value (US$ Bn) Forecast, by Form, 2022–2031
9.4.4. Japan Sodium Lauryl Ether Sulfate (SLES) Market Volume (Kilo Tons) and Value (US$ Bn) Forecast, Application, 2022–2031
9.4.5. India Sodium Lauryl Ether Sulfate (SLES) Market Volume (Kilo Tons) and Value (US$ Bn) Forecast, by Form, 2022–2031
9.4.6. India Sodium Lauryl Ether Sulfate (SLES) Market Volume (Kilo Tons) and Value (US$ Bn) Forecast, Application, 2022–2031
9.4.7. ASEAN Sodium Lauryl Ether Sulfate (SLES) Market Volume (Kilo Tons) and Value (US$ Bn) Forecast, by Form, 2022–2031
9.4.8. ASEAN Sodium Lauryl Ether Sulfate (SLES) Market Volume (Kilo Tons) and Value (US$ Bn) Forecast, Application, 2022–2031
9.4.9. Rest of Asia Pacific Sodium Lauryl Ether Sulfate (SLES) Market Volume (Kilo Tons) and Value (US$ Bn) Forecast, by Form, 2022–2031
9.4.10. Rest of Asia Pacific Sodium Lauryl Ether Sulfate (SLES) Market Volume (Kilo Tons) and Value (US$ Bn) Forecast, Application, 2022–2031
9.5. Asia Pacific Sodium Lauryl Ether Sulfate (SLES) Market Attractiveness Analysis
10. Latin America Sodium Lauryl Ether Sulfate (SLES) Market Analysis and Forecast, 2022–2031
10.1. Key Findings
10.2. Latin America Sodium Lauryl Ether Sulfate (SLES) Market Volume (Kilo Tons) and Value (US$ Bn) Forecast, by Form, 2022–2031
10.3. Latin America Sodium Lauryl Ether Sulfate (SLES) Market Volume (Kilo Tons) and Value (US$ Bn) Forecast, by Application, 2022–2031
10.4. Latin America Sodium Lauryl Ether Sulfate (SLES) Market Volume (Kilo Tons) and Value (US$ Bn) Forecast, by Country and Sub-region, 2021-2031
10.4.1. Brazil Sodium Lauryl Ether Sulfate (SLES) Market Volume (Kilo Tons) and Value (US$ Bn) Forecast, by Form, 2022–2031
10.4.2. Brazil Sodium Lauryl Ether Sulfate (SLES) Market Volume (Kilo Tons) and Value (US$ Bn) Forecast, Application, 2022–2031
10.4.3. Mexico Sodium Lauryl Ether Sulfate (SLES) Market Volume (Kilo Tons) and Value (US$ Bn) Forecast, by Form, 2022–2031
10.4.4. Mexico Sodium Lauryl Ether Sulfate (SLES) Market Volume (Kilo Tons) and Value (US$ Bn) Forecast, Application, 2022–2031
10.4.5. Rest of Latin America Sodium Lauryl Ether Sulfate (SLES) Market Volume (Kilo Tons) and Value (US$ Bn) Forecast, by Form, 2022–2031
10.4.6. Rest of Latin America Sodium Lauryl Ether Sulfate (SLES) Market Volume (Kilo Tons) and Value (US$ Bn) Forecast, Application, 2022–2031
10.5. Latin America Sodium Lauryl Ether Sulfate (SLES) Market Attractiveness Analysis
11. Middle East & Africa Sodium Lauryl Ether Sulfate (SLES) Market Analysis and Forecast, 2022–2031
11.1. Key Findings
11.2. Middle East & Africa Sodium Lauryl Ether Sulfate (SLES) Market Volume (Kilo Tons) and Value (US$ Bn) Forecast, by Form, 2022–2031
11.3. Middle East & Africa Sodium Lauryl Ether Sulfate (SLES) Market Volume (Kilo Tons) and Value (US$ Bn) Forecast, by Application, 2022–2031
11.4. Middle East & Africa Sodium Lauryl Ether Sulfate (SLES) Market Volume (Kilo Tons) and Value (US$ Bn) Forecast, by Country and Sub-region, 2021-2031
11.4.1. GCC Sodium Lauryl Ether Sulfate (SLES) Market Volume (Kilo Tons) and Value (US$ Bn) Forecast, by Form, 2022–2031
11.4.2. GCC Sodium Lauryl Ether Sulfate (SLES) Market Volume (Kilo Tons) and Value (US$ Bn) Forecast, Application, 2022–2031
11.4.3. South Africa Sodium Lauryl Ether Sulfate (SLES) Market Volume (Kilo Tons) and Value (US$ Bn) Forecast, by Form, 2022–2031
11.4.4. South Africa Sodium Lauryl Ether Sulfate (SLES) Market Volume (Kilo Tons) and Value (US$ Bn) Forecast, Application, 2022–2031
11.4.5. Rest of Middle East & Africa Sodium Lauryl Ether Sulfate (SLES) Market Volume (Kilo Tons) and Value (US$ Bn) Forecast, by Form, 2022–2031
11.4.6. Rest of Middle East & Africa Sodium Lauryl Ether Sulfate (SLES) Market Volume (Kilo Tons) and Value (US$ Bn) Forecast, Application, 2022–2031
11.5. Middle East & Africa Sodium Lauryl Ether Sulfate (SLES) Market Attractiveness Analysis
12. Competition Landscape
12.1. Global Sodium Lauryl Ether Sulfate (SLES) Company Market Share Analysis, 2021
12.2. Company Profiles (Details – Overview, Financials, Recent Developments, and Strategy)
12.2.1. Croda International Plc
12.2.1.1. Company Description
12.2.1.2. Business Overview
12.2.1.3. Financial Overview
12.2.1.4. Strategic Overview
12.2.2. Huntsman International LLC
12.2.2.1. Company Description
12.2.2.2. Business Overview
12.2.2.3. Financial Overview
12.2.2.4. Strategic Overview
12.2.3. Solvay
12.2.3.1. Company Description
12.2.3.2. Business Overview
12.2.3.3. Financial Overview
12.2.3.4. Strategic Overview
12.2.4. BASF SE
12.2.4.1. Company Description
12.2.4.2. Business Overview
12.2.4.3. Financial Overview
12.2.4.4. Strategic Overview
12.2.5. Stepan Company
12.2.5.1. Company Description
12.2.5.2. Business Overview
12.2.5.3. Financial Overview
12.2.5.4. Strategic Overview
12.2.6. Galaxy Surfactants Limited
12.2.6.1. Company Description
12.2.6.2. Business Overview
12.2.6.3. Financial Overview
12.2.6.4. Strategic Overview
12.2.7. Godrej Industries Ltd.
12.2.7.1. Company Description
12.2.7.2. Business Overview
12.2.7.3. Financial Overview
12.2.8. Kao Corporation
12.2.8.1. Company Description
12.2.8.2. Business Overview
12.2.8.3. Financial Overview
12.2.9. Clariant
12.2.9.1. Company Description
12.2.9.2. Business Overview
12.2.9.3. Financial Overview
12.2.10. Evonik Industries AG
12.2.10.1. Company Description
12.2.10.2. Business Overview
12.2.10.3. Financial Overview
12.2.11. Quimicos del Cauca S.A.S.
12.2.11.1. Company Description
12.2.11.2. Business Overview
12.2.11.3. Financial Overview
12.2.12. Oxiteno
12.2.12.1. Company Description
12.2.12.2. Business Overview
12.2.12.3. Financial Overview
12.2.13. Taiwan NJC CORPORATION., Ltd.
12.2.13.1. Company Description
12.2.13.2. Business Overview
12.2.13.3. Financial Overview
12.2.14. Nouryon
12.2.14.1. Company Description
12.2.14.2. Business Overview
12.2.14.3. Financial Overview
13. Primary Research: Key Insights
14. Appendix
List of Tables
Table 1: Global Sodium Lauryl Ether Sulfate (SLES) Market Volume (Kilo Tons) Forecast, by Form, 2022–2031
Table 2: Global Sodium Lauryl Ether Sulfate (SLES) Market Value (US$ Bn) Forecast, by Form, 2022–2031
Table 3: Global Sodium Lauryl Ether Sulfate (SLES) Market Volume (Kilo Tons) Forecast, by Application, 2022–2031
Table 4: Global Sodium Lauryl Ether Sulfate (SLES) Market Value (US$ Bn) Forecast, by Application, 2022–2031
Table 5: Global Sodium Lauryl Ether Sulfate (SLES) Market Volume (Kilo Tons) Forecast, by Region, 2022–2031
Table 6: Global Sodium Lauryl Ether Sulfate (SLES) Market Value (US$ Bn) Forecast, by Region, 2022–2031
Table 7: North America Sodium Lauryl Ether Sulfate (SLES) Market Volume (Kilo Tons) Forecast, by Form, 2022–2031
Table 8: North America Sodium Lauryl Ether Sulfate (SLES) Market Value (US$ Bn) Forecast, by Form, 2022–2031
Table 9: North America Sodium Lauryl Ether Sulfate (SLES) Market Volume (Kilo Tons) Forecast, by Application, 2022–2031
Table 10: North America Sodium Lauryl Ether Sulfate (SLES) Market Value (US$ Bn) Forecast, by Application, 2022–2031
Table 11: North America Sodium Lauryl Ether Sulfate (SLES) Market Volume (Kilo Tons) Forecast, by Country, 2022–2031
Table 12: North America Sodium Lauryl Ether Sulfate (SLES) Market Value (US$ Bn) Forecast, by Country, 2022–2031
Table 13: U.S. Sodium Lauryl Ether Sulfate (SLES) Market Volume (Kilo Tons) Forecast, by Form, 2022–2031
Table 14: U.S. Sodium Lauryl Ether Sulfate (SLES) Market Value (US$ Bn) Forecast, by Form, 2022–2031
Table 15: U.S. Sodium Lauryl Ether Sulfate (SLES) Market Volume (Kilo Tons) Forecast, by Application, 2022–2031
Table 16: U.S. Sodium Lauryl Ether Sulfate (SLES) Market Value (US$ Bn) Forecast, by Application, 2022–2031
Table 17: Canada Sodium Lauryl Ether Sulfate (SLES) Market Volume (Kilo Tons) Forecast, by Form, 2022–2031
Table 18: Canada Sodium Lauryl Ether Sulfate (SLES) Market Value (US$ Bn) Forecast, by Form, 2022–2031
Table 19: Canada Sodium Lauryl Ether Sulfate (SLES) Market Volume (Kilo Tons) Forecast, by Application, 2022–2031
Table 20: Canada Sodium Lauryl Ether Sulfate (SLES) Market Value (US$ Bn) Forecast, by Application 2022–2031
Table 21: Europe Sodium Lauryl Ether Sulfate (SLES) Market Volume (Kilo Tons) Forecast, by Form, 2022–2031
Table 22: Europe Sodium Lauryl Ether Sulfate (SLES) Market Value (US$ Bn) Forecast, by Form, 2022–2031
Table 23: Europe Sodium Lauryl Ether Sulfate (SLES) Market Volume (Kilo Tons) Forecast, by Application, 2022–2031
Table 24: Europe Sodium Lauryl Ether Sulfate (SLES) Market Value (US$ Bn) Forecast, by Application 2022–2031
Table 25: Europe Sodium Lauryl Ether Sulfate (SLES) Market Volume (Kilo Tons) Forecast, by Country and Sub-region, 2022–2031
Table 26: Europe Sodium Lauryl Ether Sulfate (SLES) Market Value (US$ Bn) Forecast, by Country and Sub-region, 2022–2031
Table 27: Germany Sodium Lauryl Ether Sulfate (SLES) Market Volume (Kilo Tons) Forecast, by Form, 2022–2031
Table 28: Germany Sodium Lauryl Ether Sulfate (SLES) Market Value (US$ Bn) Forecast, by Form, 2022–2031
Table 29: Germany Sodium Lauryl Ether Sulfate (SLES) Market Volume (Kilo Tons) Forecast, by Application, 2022–2031
Table 30: Germany Sodium Lauryl Ether Sulfate (SLES) Market Value (US$ Bn) Forecast, by Application 2022–2031
Table 31: France Sodium Lauryl Ether Sulfate (SLES) Market Volume (Kilo Tons) Forecast, by Form, 2022–2031
Table 32: France Sodium Lauryl Ether Sulfate (SLES) Market Value (US$ Bn) Forecast, by Form, 2022–2031
Table 33: France Sodium Lauryl Ether Sulfate (SLES) Market Volume (Kilo Tons) Forecast, by Application, 2022–2031
Table 34: France Sodium Lauryl Ether Sulfate (SLES) Market Value (US$ Bn) Forecast, by Application 2022–2031
Table 35: U.K. Sodium Lauryl Ether Sulfate (SLES) Market Volume (Kilo Tons) Forecast, by Form, 2022–2031
Table 36: U.K. Sodium Lauryl Ether Sulfate (SLES) Market Value (US$ Bn) Forecast, by Form, 2022–2031
Table 37: U.K. Sodium Lauryl Ether Sulfate (SLES) Market Volume (Kilo Tons) Forecast, by Application, 2022–2031
Table 38: U.K. Sodium Lauryl Ether Sulfate (SLES) Market Value (US$ Bn) Forecast, by Application 2022–2031
Table 39: Italy Sodium Lauryl Ether Sulfate (SLES) Market Volume (Kilo Tons) Forecast, by Form, 2022–2031
Table 40: Italy Sodium Lauryl Ether Sulfate (SLES) Market Value (US$ Bn) Forecast, by Form, 2022–2031
Table 41: Italy Sodium Lauryl Ether Sulfate (SLES) Market Volume (Kilo Tons) Forecast, by Application, 2022–2031
Table 42: Italy Sodium Lauryl Ether Sulfate (SLES) Market Value (US$ Bn) Forecast, by Application 2022–2031
Table 43: Spain Sodium Lauryl Ether Sulfate (SLES) Market Volume (Kilo Tons) Forecast, by Form, 2022–2031
Table 44: Spain Sodium Lauryl Ether Sulfate (SLES) Market Value (US$ Bn) Forecast, by Form, 2022–2031
Table 45: Spain Sodium Lauryl Ether Sulfate (SLES) Market Volume (Kilo Tons) Forecast, by Application, 2022–2031
Table 46: Spain Sodium Lauryl Ether Sulfate (SLES) Market Value (US$ Bn) Forecast, by Application 2022–2031
Table 47: Russia & CIS Sodium Lauryl Ether Sulfate (SLES) Market Volume (Kilo Tons) Forecast, by Form, 2022–2031
Table 48: Russia & CIS Sodium Lauryl Ether Sulfate (SLES) Market Value (US$ Bn) Forecast, by Form, 2022–2031
Table 49: Russia & CIS Sodium Lauryl Ether Sulfate (SLES) Market Volume (Kilo Tons) Forecast, by Application, 2022–2031
Table 50: Russia & CIS Sodium Lauryl Ether Sulfate (SLES) Market Value (US$ Bn) Forecast, by Application 2022–2031
Table 51: Rest of Europe Sodium Lauryl Ether Sulfate (SLES) Market Volume (Kilo Tons) Forecast, by Form, 2022–2031
Table 52: Rest of Europe Sodium Lauryl Ether Sulfate (SLES) Market Value (US$ Bn) Forecast, by Form, 2022–2031
Table 53: Rest of Europe Sodium Lauryl Ether Sulfate (SLES) Market Volume (Kilo Tons) Forecast, by Application, 2022–2031
Table 54: Rest of Europe Sodium Lauryl Ether Sulfate (SLES) Market Value (US$ Bn) Forecast, by Application 2022–2031
Table 55: Asia Pacific Sodium Lauryl Ether Sulfate (SLES) Market Volume (Kilo Tons) Forecast, by Form, 2022–2031
Table 56: Asia Pacific Sodium Lauryl Ether Sulfate (SLES) Market Value (US$ Bn) Forecast, by Form, 2022–2031
Table 57: Asia Pacific Sodium Lauryl Ether Sulfate (SLES) Market Volume (Kilo Tons) Forecast, by Application, 2022–2031
Table 58: Asia Pacific Sodium Lauryl Ether Sulfate (SLES) Market Value (US$ Bn) Forecast, by Application 2022–2031
Table 59: Asia Pacific Sodium Lauryl Ether Sulfate (SLES) Market Volume (Kilo Tons) Forecast, by Country and Sub-region, 2022–2031
Table 60: Asia Pacific Sodium Lauryl Ether Sulfate (SLES) Market Value (US$ Bn) Forecast, by Country and Sub-region, 2022–2031
Table 61: China Sodium Lauryl Ether Sulfate (SLES) Market Volume (Kilo Tons) Forecast, by Form, 2022–2031
Table 62: China Sodium Lauryl Ether Sulfate (SLES) Market Value (US$ Bn) Forecast, by Form 2022–2031
Table 63: China Sodium Lauryl Ether Sulfate (SLES) Market Volume (Kilo Tons) Forecast, by Application, 2022–2031
Table 64: China Sodium Lauryl Ether Sulfate (SLES) Market Value (US$ Bn) Forecast, by Application 2022–2031
Table 65: Japan Sodium Lauryl Ether Sulfate (SLES) Market Volume (Kilo Tons) Forecast, by Form, 2022–2031
Table 66: Japan Sodium Lauryl Ether Sulfate (SLES) Market Value (US$ Bn) Forecast, by Form, 2022–2031
Table 67: Japan Sodium Lauryl Ether Sulfate (SLES) Market Volume (Kilo Tons) Forecast, by Application, 2022–2031
Table 68: Japan Sodium Lauryl Ether Sulfate (SLES) Market Value (US$ Bn) Forecast, by Application 2022–2031
Table 69: India Sodium Lauryl Ether Sulfate (SLES) Market Volume (Kilo Tons) Forecast, by Form, 2022–2031
Table 70: India Sodium Lauryl Ether Sulfate (SLES) Market Value (US$ Bn) Forecast, by Form, 2022–2031
Table 71: India Sodium Lauryl Ether Sulfate (SLES) Market Volume (Kilo Tons) Forecast, by Application, 2022–2031
Table 72: India Sodium Lauryl Ether Sulfate (SLES) Market Value (US$ Bn) Forecast, by Application 2022–2031
Table 73: ASEAN Sodium Lauryl Ether Sulfate (SLES) Market Volume (Kilo Tons) Forecast, by Form, 2022–2031
Table 74: ASEAN Sodium Lauryl Ether Sulfate (SLES) Market Value (US$ Bn) Forecast, by Form, 2022–2031
Table 75: ASEAN Sodium Lauryl Ether Sulfate (SLES) Market Volume (Kilo Tons) Forecast, by Application, 2022–2031
Table 76: ASEAN Sodium Lauryl Ether Sulfate (SLES) Market Value (US$ Bn) Forecast, by Application 2022–2031
Table 77: Rest of Asia Pacific Sodium Lauryl Ether Sulfate (SLES) Market Volume (Kilo Tons) Forecast, by Form, 2022–2031
Table 78: Rest of Asia Pacific Sodium Lauryl Ether Sulfate (SLES) Market Value (US$ Bn) Forecast, by Form, 2022–2031
Table 79: Rest of Asia Pacific Sodium Lauryl Ether Sulfate (SLES) Market Volume (Kilo Tons) Forecast, by Application, 2022–2031
Table 80: Rest of Asia Pacific Sodium Lauryl Ether Sulfate (SLES) Market Value (US$ Bn) Forecast, by Application 2022–2031
Table 81: Latin America Sodium Lauryl Ether Sulfate (SLES) Market Volume (Kilo Tons) Forecast, by Form, 2022–2031
Table 82: Latin America Sodium Lauryl Ether Sulfate (SLES) Market Value (US$ Bn) Forecast, by Form, 2022–2031
Table 83: Latin America Sodium Lauryl Ether Sulfate (SLES) Market Volume (Kilo Tons) Forecast, by Application, 2022–2031
Table 84: Latin America Sodium Lauryl Ether Sulfate (SLES) Market Value (US$ Bn) Forecast, by Application 2022–2031
Table 85: Latin America Sodium Lauryl Ether Sulfate (SLES) Market Volume (Kilo Tons) Forecast, by Country and Sub-region, 2022–2031
Table 86: Latin America Sodium Lauryl Ether Sulfate (SLES) Market Value (US$ Bn) Forecast, by Country and Sub-region, 2022–2031
Table 87: Brazil Sodium Lauryl Ether Sulfate (SLES) Market Volume (Kilo Tons) Forecast, by Form, 2022–2031
Table 88: Brazil Sodium Lauryl Ether Sulfate (SLES) Market Value (US$ Bn) Forecast, by Form, 2022–2031
Table 89: Brazil Sodium Lauryl Ether Sulfate (SLES) Market Volume (Kilo Tons) Forecast, by Application, 2022–2031
Table 90: Brazil Sodium Lauryl Ether Sulfate (SLES) Market Value (US$ Bn) Forecast, by Application 2022–2031
Table 91: Mexico Sodium Lauryl Ether Sulfate (SLES) Market Volume (Kilo Tons) Forecast, by Form, 2022–2031
Table 92: Mexico Sodium Lauryl Ether Sulfate (SLES) Market Value (US$ Bn) Forecast, by Form, 2022–2031
Table 93: Mexico Sodium Lauryl Ether Sulfate (SLES) Market Volume (Kilo Tons) Forecast, by Application, 2022–2031
Table 94: Mexico Sodium Lauryl Ether Sulfate (SLES) Market Value (US$ Bn) Forecast, by Application 2022–2031
Table 95: Rest of Latin America Sodium Lauryl Ether Sulfate (SLES) Market Volume (Kilo Tons) Forecast, by Form, 2022–2031
Table 96: Rest of Latin America Sodium Lauryl Ether Sulfate (SLES) Market Value (US$ Bn) Forecast, by Form, 2022–2031
Table 97: Rest of Latin America Sodium Lauryl Ether Sulfate (SLES) Market Volume (Kilo Tons) Forecast, by Application, 2022–2031
Table 98: Rest of Latin America Sodium Lauryl Ether Sulfate (SLES) Market Value (US$ Bn) Forecast, by Application 2022–2031
Table 99: Middle East & Africa Sodium Lauryl Ether Sulfate (SLES) Market Volume (Kilo Tons) Forecast, by Form, 2022–2031
Table 100: Middle East & Africa Sodium Lauryl Ether Sulfate (SLES) Market Value (US$ Bn) Forecast, by Form, 2022–2031
Table 101: Middle East & Africa Sodium Lauryl Ether Sulfate (SLES) Market Volume (Kilo Tons) Forecast, by Application, 2022–2031
Table 102: Middle East & Africa Sodium Lauryl Ether Sulfate (SLES) Market Value (US$ Bn) Forecast, by Application 2022–2031
Table 103: Middle East & Africa Sodium Lauryl Ether Sulfate (SLES) Market Volume (Kilo Tons) Forecast, by Country and Sub-region, 2022–2031
Table 104: Middle East & Africa Sodium Lauryl Ether Sulfate (SLES) Market Value (US$ Bn) Forecast, by Country and Sub-region, 2022–2031
Table 105: GCC Sodium Lauryl Ether Sulfate (SLES) Market Volume (Kilo Tons) Forecast, by Form, 2022–2031
Table 106: GCC Sodium Lauryl Ether Sulfate (SLES) Market Value (US$ Bn) Forecast, by Form, 2022–2031
Table 107: GCC Sodium Lauryl Ether Sulfate (SLES) Market Volume (Kilo Tons) Forecast, by Application, 2022–2031
Table 108: GCC Sodium Lauryl Ether Sulfate (SLES) Market Value (US$ Bn) Forecast, by Application 2022–2031
Table 109: South Africa Sodium Lauryl Ether Sulfate (SLES) Market Volume (Kilo Tons) Forecast, by Form, 2022–2031
Table 110: South Africa Sodium Lauryl Ether Sulfate (SLES) Market Value (US$ Bn) Forecast, by Form, 2022–2031
Table 111: South Africa Sodium Lauryl Ether Sulfate (SLES) Market Volume (Kilo Tons) Forecast, by Application, 2022–2031
Table 112: South Africa Sodium Lauryl Ether Sulfate (SLES) Market Value (US$ Bn) Forecast, by Application 2022–2031
Table 113: Rest of Middle East & Africa Sodium Lauryl Ether Sulfate (SLES) Market Volume (Kilo Tons) Forecast, by Form, 2022–2031
Table 114: Rest of Middle East & Africa Sodium Lauryl Ether Sulfate (SLES) Market Value (US$ Bn) Forecast, by Form, 2022–2031
Table 115: Rest of Middle East & Africa Sodium Lauryl Ether Sulfate (SLES) Market Volume (Kilo Tons) Forecast, by Application, 2022–2031
Table 116: Rest of Middle East & Africa Sodium Lauryl Ether Sulfate (SLES) Market Value (US$ Bn) Forecast, by Application 2022–2031
List of Figures
Figure 1: Global Sodium Lauryl Ether Sulfate (SLES) Market Volume Share Analysis, by Form, 2021, 2025, and 2031
Figure 2: Global Sodium Lauryl Ether Sulfate (SLES) Market Attractiveness, by Form
Figure 3: Global Sodium Lauryl Ether Sulfate (SLES) Market Volume Share Analysis, by Application, 2021, 2025, and 2031
Figure 4: Global Sodium Lauryl Ether Sulfate (SLES) Market Attractiveness, by Application
Figure 5: Global Sodium Lauryl Ether Sulfate (SLES) Market Volume Share Analysis, by Region, 2021, 2025, and 2031
Figure 6: Global Sodium Lauryl Ether Sulfate (SLES) Market Attractiveness, by Region
Figure 7: North America Sodium Lauryl Ether Sulfate (SLES) Market Volume Share Analysis, by Form, 2021, 2025, and 2031
Figure 8: North America Sodium Lauryl Ether Sulfate (SLES) Market Attractiveness, by Form
Figure 9: North America Sodium Lauryl Ether Sulfate (SLES) Market Attractiveness, by Form
Figure 10: North America Sodium Lauryl Ether Sulfate (SLES) Market Volume Share Analysis, by Application, 2021, 2025, and 2031
Figure 11: North America Sodium Lauryl Ether Sulfate (SLES) Market Attractiveness, by Application
Figure 12: North America Sodium Lauryl Ether Sulfate (SLES) Market Attractiveness, by Country and Sub-region
Figure 13: Europe Sodium Lauryl Ether Sulfate (SLES) Market Volume Share Analysis, by Form, 2021, 2025, and 2031
Figure 14: Europe Sodium Lauryl Ether Sulfate (SLES) Market Attractiveness, by Form
Figure 15: Europe Sodium Lauryl Ether Sulfate (SLES) Market Volume Share Analysis, by Application, 2021, 2025, and 2031
Figure 16: Europe Sodium Lauryl Ether Sulfate (SLES) Market Attractiveness, by Application
Figure 17: Europe Sodium Lauryl Ether Sulfate (SLES) Market Volume Share Analysis, by Country and Sub-region, 2021, 2025, and 2031
Figure 18: Europe Sodium Lauryl Ether Sulfate (SLES) Market Attractiveness, by Country and Sub-region
Figure 19: Asia Pacific Sodium Lauryl Ether Sulfate (SLES) Market Volume Share Analysis, by Form, 2021, 2025, and 2031
Figure 20: Asia Pacific Sodium Lauryl Ether Sulfate (SLES) Market Attractiveness, by Form
Figure 21: Asia Pacific Sodium Lauryl Ether Sulfate (SLES) Market Volume Share Analysis, by Application, 2021, 2025, and 2031
Figure 22: Asia Pacific Sodium Lauryl Ether Sulfate (SLES) Market Attractiveness, by Application
Figure 23: Asia Pacific Sodium Lauryl Ether Sulfate (SLES) Market Volume Share Analysis, by Country and Sub-region, 2021, 2025, and 2031
Figure 24: Asia Pacific Sodium Lauryl Ether Sulfate (SLES) Market Attractiveness, by Country and Sub-region
Figure 25: Latin America Sodium Lauryl Ether Sulfate (SLES) Market Volume Share Analysis, by Form, 2021, 2025, and 2031
Figure 26: Latin America Sodium Lauryl Ether Sulfate (SLES) Market Attractiveness, by Form
Figure 27: Latin America Sodium Lauryl Ether Sulfate (SLES) Market Volume Share Analysis, by Application, 2021, 2025, and 2031
Figure 28: Latin America Sodium Lauryl Ether Sulfate (SLES) Market Attractiveness, by Application
Figure 29: Latin America Sodium Lauryl Ether Sulfate (SLES) Market Volume Share Analysis, by Country and Sub-region, 2021, 2025, and 2031
Figure 30: Latin America Sodium Lauryl Ether Sulfate (SLES) Market Attractiveness, by Country and Sub-region
Figure 31: Middle East & Africa Sodium Lauryl Ether Sulfate (SLES) Market Volume Share Analysis, by Form, 2021, 2025, and 2031
Figure 32: Middle East & Africa Sodium Lauryl Ether Sulfate (SLES) Market Attractiveness, by Form
Figure 33: Middle East & Africa Sodium Lauryl Ether Sulfate (SLES) Market Volume Share Analysis, by Application, 2021, 2025, and 2031
Figure 34: Middle East & Africa Sodium Lauryl Ether Sulfate (SLES) Market Attractiveness, by Application
Figure 35: Middle East & Africa Sodium Lauryl Ether Sulfate (SLES) Market Volume Share Analysis, by Country and Sub-region, 2021, 2025, and 2031
Figure 36: Middle East & Africa Sodium Lauryl Ether Sulfate (SLES) Market Attractiveness, by Country and Sub-region
Copyright © Transparency Market Research, Inc. All Rights reserved
Trust Online

Sodium Lauryl Ether Sulfate [SLES] Market