
Reports
Reports
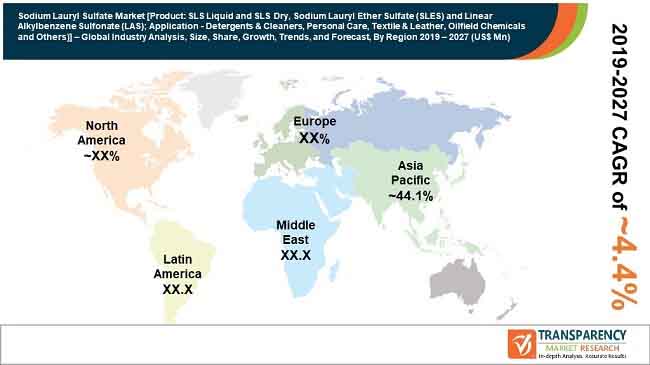
Rising Demand for Household Cleaning Agents and Personal Care Products Favor Expansion of Sodium Lauryl Sulfate Market
Sodium lauryl sulfate, also known as sodium dodecyl sulfate is an anionic surfactant used a foaming and cleansing agent. Rising demand for household cleaning agents such as detergents, industrial cleaning agents, and personal care products is one of the major drivers for the growth of the global sodium lauryl sulfate market. This trend can be attributed to increase in the disposable income among global population as well as increasing lifestyle needs including premium quality personal and home care products. Furthermore, increasing awareness regarding public and personal health as well as rising need for keeping living spaces hygienic and clean are also motivating the sales in the global sodium lauryl sulfate market.
Increase in the awareness pertaining to benefits of maintaining good residential area cleanliness as well as personal hygiene is positively influencing the demand dynamics in global sodium lauryl sulfate market. Furthermore, increase in the government initiatives to educate people about maintaining workplace cleanliness in order to minimize the risk of infectious diseases is also influencing the demand in the global sodium lauryl sulfate market. Moreover, rising consumer preference for liquid detergents owing to their minimal wastage and easy applicability as compared to detergent powders is also aiding in the expansion of the global sodium lauryl sulfate market.
However, environmental and health concerns related with over usage of products in the global sodium lauryl sulfate market may hamper the growth in the global sodium lauryl sulfate market in coming years. Furthermore, lack of awareness pertaining to the availability and usage of the products in the global sodium lauryl sulfate market in several developing and underdeveloped economies may also restrict the development of the global sodium lauryl sulfate market in coming years. Products in the global sodium lauryl sulfate market can cause skin irritation or dry skin by stripping down the natural oils. This has caused increasing consumer preference for natural as well as organic products in the personal care products. This trend may slow down the adoption of the products in the global sodium lauryl sulfate market in personal care sector.
Chapter 1 Preface
1.1. Report Description
1.2. Market Segmentation
1.3. Report Scope
1.4. Assumptions
1.5. Research Methodology
Chapter 2 Executive Summary
2.1. Global SLS, SLES, and LAS Market, (Kilo Tons) (US$ Mn), 2018-2027
2.2. Global SLS, SLES, and LAS Market: Snapshot
Chapter 3 SLS, SLES, and LAS Market – Industry Analysis
3.1. Introduction
3.2. Value Chain Analysis
3.3. Market Drivers
3.3.1. Significant Rise in Demand for Personal Care Products
3.3.2. Increasing Demand for Household Detergents
3.4. Restraints
3.4.1. Availability of Bio-based Alternatives
3.4.2. Toxic Effects of SLS and SLES on People and Environment
3.5. Opportunity
3.5.1. Focus on Innovation through R&D Activities
3.6. Porter’s Five Forces Analysis
3.6.1. Bargaining Power of Suppliers
3.6.2. Bargaining Power of Buyers
3.6.3. Threat of Substitutes
3.6.4. Threat of New Entrants
3.6.5. Degree of Competition
3.7. Global SLS, SLES, and LAS Market Attractiveness, by Application, 2018
3.8. Company Market Share, 2018
Chapter 4 Price Trend Analysis
4.1. Raw Material Analysis
4.2. Global Average SLS, SLES, and LAS Price Trend, 2018-2027 (US$/Kg)
Chapter 5 Global SLS, SLES, and LAS Market – Product Segment Analysis
5.1. Global SLS, SLES, and LAS Market: Product Segment Overview
5.1.1. Global SLS, SLES, and LAS Market for Sodium Lauryl Sulfate (SLS) (Kilo Tons) (US$ Mn), 2018-2027
5.1.2. Global SLS, SLES, and LAS Market for Sodium Lauryl Ether Sulfate (SLES) (Kilo Tons) (US$ Mn), 2018-2027
5.1.3. Global SLS, SLES, and LAS Market for Linear Alkylbenzene Sulfonate (LAS) (Kilo Tons) (US$ Mn), 2018-2027
Chapter 6 Global SLS, SLES, and LAS Market – Application Analysis
6.1. Global SLS, SLES, and LAS Market: Application Overview
6.1.1. Global SLS, SLES, and LAS Market for Detergents & Cleaners (Kilo Tons) (US$ Mn), 2018-2027
6.1.2. Global SLS, SLES, and LAS Market for Personal Care (Kilo Tons) (US$ Mn), 2018-2027
6.1.3. Global SLS, SLES, and LAS Market for Textile & Leather (Kilo Tons) (US$ Mn), 2018-2027
6.1.4. Global SLS, SLES, and LAS Market for Oilfield Chemicals (Kilo Tons) (US$ Mn), 2018-2027
6.1.5. Global SLS, SLES, and LAS Market for Others (Kilo Tons) (US$ Mn), 2018-2027
Chapter 7 Global SLS, SLES, and LAS Market - Regional Analysis
7.1. Global SLS, SLES, and LAS Market: Regional Overview
7.1.1. North America SLS, SLES, and LAS Market, 2018 and 2027
7.1.2. North America SLS, SLES, and LAS Market Volume, by Product Segment (Kilo Tons), 2018-2027
7.1.3. North America SLS, SLES, and LAS Market Revenue, by Product Segment (US$ Mn), 2018-2027
7.1.4. North America SLS, SLES, and LAS Market Volume, by Application Segment (Kilo Tons), 2018-2027
7.1.5. North America SLS, SLES, and LAS Market Revenue, by Application Segment (US$ Mn), 2018-2027
7.1.6. U.S. SLS, SLES, and LAS Market Volume, by Product Segment (Kilo Tons), 2018-2027
7.1.7. U.S. SLS, SLES, and LAS Market Revenue, by Product Segment (US$ Mn), 2018-2027
7.1.8. U.S. SLS, SLES, and LAS Market Volume, by Application Segment (Kilo Tons), 2018-2027
7.1.9. U.S. SLS, SLES, and LAS Market Revenue, by Application Segment (US$ Mn), 2018-2027
7.1.10. Rest of North America SLS, SLES, and LAS Market Volume, by Product Segment (Kilo Tons), 2018-2027
7.1.11. Rest of North America SLS, SLES, and LAS Market Revenue, by Product Segment (US$ Mn), 2018-2027
7.1.12. Rest of North America SLS, SLES, and LAS Market Volume, by Application Segment (Kilo Tons), 2018-2027
7.1.13. Rest of North America SLS, SLES, and LAS Market Revenue, by Application Segment (US$ Mn), 2018-2027
7.1.14. Europe SLS, SLES, and LAS Market, 2018 and 2027
7.1.14.1. Europe SLS, SLES, and LAS Market Volume, by Product Segment (Kilo Tons), 2018-2027
7.1.14.2. Europe SLS, SLES, and LAS Market Revenue, by Product Segment (US$ Mn), 2018-2027
7.1.14.3. Europe SLS, SLES, and LAS Market Volume, by Application Segment (Kilo Tons), 2018-2027
7.1.14.4. Europe SLS, SLES, and LAS Market Revenue, by Application Segment (US$ Mn), 2018-2027
7.1.14.5. France SLS, SLES, and LAS Market Volume, by Product Segment (Kilo Tons), 2018-2027
7.1.14.6. France SLS, SLES, and LAS Market Revenue, by Product Segment (US$ Mn), 2018-2027
7.1.14.7. France SLS, SLES, and LAS Market Volume, by Application Segment (Kilo Tons), 2018-2027
7.1.14.8. France SLS, SLES, and LAS Market Revenue, by Application Segment (US$ Mn), 2018-2027
7.1.14.9. U.K. SLS, SLES, and LAS Market Volume, by Product Segment (Kilo Tons), 2018-2027
7.1.14.10. U.K. SLS, SLES, and LAS Market Revenue, by Product Segment (US$ Mn), 2018-2027
7.1.14.11. U.K. SLS, SLES, and LAS Market Volume, by Application Segment (Kilo Tons), 2018-2027
7.1.14.12. U.K. SLS, SLES, and LAS Market Revenue, by Application Segment (US$ Mn), 2018-2027
7.1.14.13. Spain SLS, SLES, and LAS Market Volume, by Product Segment (Kilo Tons), 2018-2027
7.1.14.14. Spain SLS, SLES, and LAS Market Revenue, by Product Segment (US$ Mn), 2018-2027
7.1.14.15. Spain SLS, SLES, and LAS Market Volume, by Application Segment (Kilo Tons), 2018-2027
7.1.14.16. Spain SLS, SLES, and LAS Market Revenue, by Application Segment (US$ Mn), 2018-2027
7.1.14.17. Germany SLS, SLES, and LAS Market Volume, by Product Segment (Kilo Tons), 2018-2027
7.1.14.18. Germany SLS, SLES, and LAS Market Revenue, by Product Segment (US$ Mn), 2018-2027
7.1.14.19. Germany SLS, SLES, and LAS Market Volume, by Application Segment (Kilo Tons), 2018-2027
7.1.14.20. Germany SLS, SLES, and LAS Market Revenue, by Application Segment (US$ Mn), 2018-2027
7.1.14.21. Italy SLS, SLES, and LAS Market Volume, by Product Segment (Kilo Tons), 2018-2027
7.1.14.22. Italy SLS, SLES, and LAS Market Revenue, by Product Segment (US$ Mn), 2018-2027
7.1.14.23. Italy SLS, SLES, and LAS Market Volume, by Application Segment (Kilo Tons), 2018-2027
7.1.14.24. Italy SLS, SLES, and LAS Market Revenue, by Application Segment (US$ Mn), 2018-2027
7.1.14.25. Rest of Europe SLS, SLES, and LAS Market Volume, by Product Segment (Kilo Tons), 2018-2027
7.1.14.26. Rest of Europe SLS, SLES, and LAS Market Revenue, by Product Segment (US$ Mn), 2018-2027
7.1.14.27. Rest of Europe SLS, SLES, and LAS Market Volume, by Application Segment (Kilo Tons), 2018-2027
7.1.14.28. Rest of Europe SLS, SLES, and LAS Market Revenue, by Application Segment (US$ Mn), 2018-2027
7.1.15. Asia Pacific SLS, SLES, and LAS Market, 2018 and 2027
7.1.15.1. Asia Pacific SLS, SLES, and LAS Market Volume, by Product Segment (Kilo Tons), 2018-2027
7.1.15.2. Asia Pacific SLS, SLES, and LAS Market Revenue, by Product Segment (US$ Mn), 2018-2027
7.1.15.3. Asia Pacific SLS, SLES, and LAS Market Volume, by Application Segment (Kilo Tons), 2018-2027
7.1.15.4. Asia Pacific SLS, SLES, and LAS Market Revenue, by Application Segment (US$ Mn), 2018-2027
7.1.15.5. China SLS, SLES, and LAS Market Volume, by Product Segment (Kilo Tons), 2018-2027
7.1.15.6. China SLS, SLES, and LAS Market Revenue, by Product Segment (US$ Mn), 2018-2027
7.1.15.7. China SLS, SLES, and LAS Market Volume, by Application Segment (Kilo Tons), 2018-2027
7.1.15.8. China SLS, SLES, and LAS Market Revenue, by Application Segment (US$ Mn), 2018-2027
7.1.15.9. Japan SLS, SLES, and LAS Market Volume, by Product Segment (Kilo Tons), 2018-2027
7.1.15.10. Japan SLS, SLES, and LAS Market Revenue, by Product Segment (US$ Mn), 2018-2027
7.1.15.11. Japan SLS, SLES, and LAS Market Volume, by Application Segment (Kilo Tons), 2018-2027
7.1.15.12. Japan SLS, SLES, and LAS Market Revenue, by Application Segment (US$ Mn), 2018-2027
7.1.15.13. South Korea SLS, SLES, and LAS Market Volume, by Product Segment (Kilo Tons), 2018-2027
7.1.15.14. South Korea SLS, SLES, and LAS Market Revenue, by Product Segment (US$ Mn), 2018-2027
7.1.15.15. South Korea SLS, SLES, and LAS Market Volume, by Application Segment (Kilo Tons), 2018-2027
7.1.15.16. South Korea SLS, SLES, and LAS Market Revenue, by Application Segment (US$ Mn), 2018-2027
7.1.15.17. Taiwan SLS, SLES, and LAS Market Volume, by Product Segment (Kilo Tons), 2018-2027
7.1.15.18. Taiwan SLS, SLES, and LAS Market Revenue, by Product Segment (US$ Mn), 2018-2027
7.1.15.19. Taiwan SLS, SLES, and LAS Market Volume, by Application Segment (Kilo Tons), 2018-2027
7.1.15.20. Taiwan SLS, SLES, and LAS Market Revenue, by Application Segment (US$ Mn), 2018-2027
7.1.15.21. Indonesia SLS, SLES, and LAS Market Volume, by Product Segment (Kilo Tons), 2018-2027
7.1.15.22. Indonesia SLS, SLES, and LAS Market Revenue, by Product Segment (US$ Mn), 2018-2027
7.1.15.23. Indonesia SLS, SLES, and LAS Market Volume, by Application Segment (Kilo Tons), 2018-2027
7.1.15.24. Indonesia SLS, SLES, and LAS Market Revenue, by Application Segment (US$ Mn), 2018-2027
7.1.15.25. Malaysia SLS, SLES, and LAS Market Volume, by Product Segment (Kilo Tons), 2018-2027
7.1.15.26. Malaysia SLS, SLES, and LAS Market Revenue, by Product Segment (US$ Mn), 2018-2027
7.1.15.27. Malaysia SLS, SLES, and LAS Market Volume, by Application Segment (Kilo Tons), 2018-2027
7.1.15.28. Malaysia SLS, SLES, and LAS Market Revenue, by Application Segment (US$ Mn), 2018-2027
7.1.15.29. Thailand SLS, SLES, and LAS Market Volume, by Product Segment (Kilo Tons), 2018-2027
7.1.15.30. Thailand SLS, SLES, and LAS Market Revenue, by Product Segment (US$ Mn), 2018-2027
7.1.15.31. Thailand SLS, SLES, and LAS Market Volume, by Application Segment (Kilo Tons), 2018-2027
7.1.15.32. Thailand SLS, SLES, and LAS Market Revenue, by Application Segment (US$ Mn), 2018-2027
7.1.15.33. Vietnam SLS, SLES, and LAS Market Volume, by Product Segment (Kilo Tons), 2018-2027
7.1.15.34. Vietnam SLS, SLES, and LAS Market Revenue, by Product Segment (US$ Mn), 2018-2027
7.1.15.35. Vietnam SLS, SLES, and LAS Market Volume, by Application Segment (Kilo Tons), 2018-2027
7.1.15.36. Vietnam SLS, SLES, and LAS Market Revenue, by Application Segment (US$ Mn), 2018-2027
7.1.15.37. Philippines SLS, SLES, and LAS Market Volume, by Product Segment (Kilo Tons), 2018-2027
7.1.15.38. Philippines SLS, SLES, and LAS Market Revenue, by Product Segment (US$ Mn), 2018-2027
7.1.15.39. Philippines SLS, SLES, and LAS Market Volume, by Application Segment (Kilo Tons), 2018-2027
7.1.15.40. Philippines SLS, SLES, and LAS Market Revenue, by Application Segment (US$ Mn), 2018-2027
7.1.15.41. Singapore SLS, SLES, and LAS Market Volume, by Product Segment (Kilo Tons), 2018-2027
7.1.15.42. Singapore SLS, SLES, and LAS Market Revenue, by Product Segment (US$ Mn), 2018-2027
7.1.15.43. Singapore SLS, SLES, and LAS Market Volume, by Application Segment (Kilo Tons), 2018-2027
7.1.15.44. Singapore SLS, SLES, and LAS Market Revenue, by Application Segment (US$ Mn), 2018-2027
7.1.15.45. India SLS, SLES, and LAS Market Volume, by Product Segment (Kilo Tons), 2018-2027
7.1.15.46. India SLS, SLES, and LAS Market Revenue, by Product Segment (US$ Mn), 2018-2027
7.1.15.47. India SLS, SLES, and LAS Market Volume, by Application Segment (Kilo Tons), 2018-2027
7.1.15.48. India SLS, SLES, and LAS Market Revenue, by Application Segment (US$ Mn), 2018-2027
7.1.15.49. Pakistan SLS, SLES, and LAS Market Volume, by Product Segment (Kilo Tons), 2018-2027
7.1.15.50. Pakistan SLS, SLES, and LAS Market Revenue, by Product Segment (US$ Mn), 2018-2027
7.1.15.51. Pakistan SLS, SLES, and LAS Market Volume, by Application Segment (Kilo Tons), 2018-2027
7.1.15.52. Pakistan SLS, SLES, and LAS Market Revenue, by Application Segment (US$ Mn), 2018-2027
7.1.15.53. Australia SLS, SLES, and LAS Market Volume, by Product Segment (Kilo Tons), 2018-2027
7.1.15.54. Australia SLS, SLES, and LAS Market Revenue, by Product Segment (US$ Mn), 2018-2027
7.1.15.55. Australia SLS, SLES, and LAS Market Volume, by Application Segment (Kilo Tons), 2018-2027
7.1.15.56. Australia SLS, SLES, and LAS Market Revenue, by Application Segment (US$ Mn), 2018-2027
7.1.15.57. Rest of Asia Pacific SLS, SLES, and LAS Market Volume, by Product Segment (Kilo Tons), 2018-2027
7.1.15.58. Rest of Asia Pacific SLS, SLES, and LAS Market Revenue, by Product Segment (US$ Mn), 2018-2027
7.1.15.59. Rest of Asia Pacific SLS, SLES, and LAS Market Volume, by Application Segment (Kilo Tons), 2018-2027
7.1.15.60. Rest of Asia Pacific SLS, SLES, and LAS Market Revenue, by Application Segment (US$ Mn), 2018-2027
7.1.16. Latin America SLS, SLES, and LAS Market, 2018 and 2027
7.1.16.1. Latin America SLS, SLES, and LAS Market Volume, by Product Segment (Kilo Tons), 2018-2027
7.1.16.2. Latin America SLS, SLES, and LAS Market Revenue, by Product Segment (US$ Mn), 2018-2027
7.1.16.3. Latin America SLS, SLES, and LAS Market Volume, by Application Segment (Kilo Tons), 2018-2027
7.1.16.4. Latin America SLS, SLES, and LAS Market Revenue, by Application Segment (US$ Mn), 2018-2027
7.1.16.5. Brazil SLS, SLES, and LAS Market Volume, by Product Segment (Kilo Tons), 2018-2027
7.1.16.6. Brazil SLS, SLES, and LAS Market Revenue, by Product Segment (US$ Mn), 2018-2027
7.1.16.7. Brazil SLS, SLES, and LAS Market Volume, by Application Segment (Kilo Tons), 2018-2027
7.1.16.8. Brazil SLS, SLES, and LAS Market Revenue, by Application Segment (US$ Mn), 2018-2027
7.1.16.9. Rest of Latin America SLS, SLES, and LAS Market Volume, by Product Segment (Kilo Tons), 2018-2027
7.1.16.10. Rest of Latin America SLS, SLES, and LAS Market Revenue, by Product Segment (US$ Mn), 2018-2027
7.1.16.11. Rest of Latin America SLS, SLES, and LAS Market Volume, by Application Segment (Kilo Tons), 2018-2027
7.1.16.12. Rest of Latin America SLS, SLES, and LAS Market Revenue, by Application Segment (US$ Mn), 2018-2027
7.1.17. Middle East & Africa SLS, SLES, and LAS Market, 2018 and 2027
7.1.17.1. Middle East & Africa SLS, SLES, and LAS Market Volume, by Product Segment (Kilo Tons), 2018-2027
7.1.17.2. Middle East & Africa SLS, SLES, and LAS Market Revenue, by Product Segment (US$ Mn), 2018-2027
7.1.17.3. Middle East & Africa SLS, SLES, and LAS Market Volume, by Application Segment (Kilo Tons), 2018-2027
7.1.17.4. Middle East & Africa SLS, SLES, and LAS Market Revenue, by Application Segment (US$ Mn), 2018-2027
7.1.17.5. Saudi Arabia SLS, SLES, and LAS Market Volume, by Product Segment (Kilo Tons), 2018-2027
7.1.17.6. Saudi Arabia SLS, SLES, and LAS Market Revenue, by Product Segment (US$ Mn), 2018-2027
7.1.17.7. Saudi Arabia SLS, SLES, and LAS Market Volume, by Application Segment (Kilo Tons), 2018-2027
7.1.17.8. Saudi Arabia SLS, SLES, and LAS Market Revenue, by Application Segment (US$ Mn), 2018-2027
7.1.17.9. Iran SLS, SLES, and LAS Market Volume, by Product Segment (Kilo Tons), 2018-2027
7.1.17.10. Iran SLS, SLES, and LAS Market Revenue, by Product Segment (US$ Mn), 2018-2027
7.1.17.11. Iran SLS, SLES, and LAS Market Revenue, by Application Segment (Kilo Tons), 2018-2027
7.1.17.12. Iran SLS, SLES, and LAS Market Revenue, by Application Segment (US$ Mn), 2018-2027
7.1.17.13. Qatar SLS, SLES, and LAS Market Volume, by Product Segment (Kilo Tons), 2018-2027
7.1.17.14. Qatar SLS, SLES, and LAS Market Revenue, by Product Segment (US$ Mn), 2018-2027
7.1.17.15. Qatar SLS, SLES, and LAS Market Revenue, by Application Segment (Kilo Tons), 2018-2027
7.1.17.16. Qatar SLS, SLES, and LAS Market Revenue, by Application Segment (US$ Mn), 2018-2027
7.1.17.17. Rest of Middle East & Africa SLS, SLES, and LAS Market Volume, by Product Segment (Kilo Tons), 2018-2027
7.1.17.18. Rest of Middle East & Africa SLS, SLES, and LAS Market Revenue, by Product Segment (US$ Mn), 2018-2027
7.1.17.19. Rest of Middle East & Africa SLS, SLES, and LAS Market Volume, by Application Segment (Kilo Tons), 2018-2027
7.1.17.20. Rest of Middle East & Africa SLS, SLES, and LAS Market Revenue, by Application Segment (US$ Mn), 2018-2027
Chapter 8 Company Profiles
8.1. Croda International Plc.
8.2. Clariant
8.3. Solvay
8.4. Huntsman International LLC
8.5. Stepan Company
8.6. Henkel AG & Co. KGaA
8.7. Galaxy Surfactants
8.8. BASF SE
8.9. The Chemours Company
8.10. The Dow Chemical Company
8.11. Kao Corporation
8.12. Oxiteno
8.13. Godrej Industries Limited
8.14. Taiwan NJC Corporation, Ltd.
8.15. Evonik Industries AG
8.16. Nouryon
Copyright © Transparency Market Research, Inc. All Rights reserved
Trust Online

Sodium Lauryl Sulfate Market