
Reports
Reports
Researchers at the Swansea University are grabbing the attention of stakeholders in the smart patches market. The Institute for Innovative Materials, Processing and Numerical Technologies (IMPACT) is in talks for producing COVID-19 vaccine with the help of microneedles (MNs) to create a smart patch device. Stakeholders in the global smart patches market are taking cues from such innovations to develop devices that are capable of measuring a patient’s inflammatory response to the vaccination by monitoring biomarkers in the skin.
Microneedles in smart patches are a classic example of transdermal nicotine patch that delivers nicotine through skin to help people give up smoking. Such innovative devices hold promising potential for COVID-19 vaccine administration as a means of minimally invasive technique.
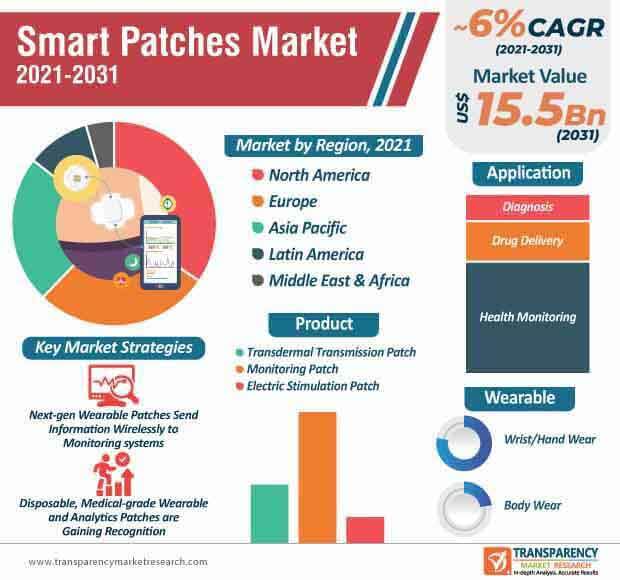
The smart patches market is expected to reach US$ 15.5 Bn by 2031. Companies are taking it as a challenge in their stride to develop completely new designs in wearable smart patches that combine both comfort and functionality. Covestro AG - a Germany-based company, which produces a variety of polyurethane and polycarbonate-based raw materials, is working closely with med-tech companies to develop smart patches with the help of Baymedix® adhesives & foams as well as Platilon® thermoplastic polyurethane (TPU) films. Current trends in the smart patches market are gravitating toward miniaturization, greater patch functionality, and improved comfort.
Since many hospitals, especially in developing economies lack resources and technological solutions to conduct close-scrutiny of basic vital functions of patients, manufacturers in the smart patches market are innovating in affordable smart patches. VTT, which has recently become a clinical research site for new healthcare devices, is collaborating with partners to develop affordable smart patches that are revolutionizing patient monitoring with the help of light and wireless sensors capable of capturing vital functions.
Manufacturers in the smart patches market are increasing the availability of cost-efficient patches capable of capturing heart rate, respiration rate, oxygen saturation, temperature, and even an ECG (electrocardiography). Such devices help detect early warning signs of a decline in a person’s condition without delay.
Smart insulin-delivery patch are emerging in the healthcare sector to revolutionize diabetes treatment. UCLA bioengineers and colleagues at UNC School of Medicine & MIT have collaborated to develop smart insulin patch which is adhesive and about the size of a small coin. These patches have the potential to transform diabetes treatment by monitoring and managing glucose levels in people with diabetes whilst delivering the necessary insulin dosage. Companies in the smart patches market are learning from such developments to increase research studies conducted on mice and pigs to validate how their researchers are applying FDA approval for clinical trials in humans.
Smart microneedle patch are becoming a recurring topic for innovation in the smart patches market.
Analysts’ Viewpoint
Smart patch devices for delivery of COVID-19 vaccination with the use of microneedle arrays for transdermal therapeutic drug delivery and diagnostic applications hold future opportunities for the healthcare sector. The smart patches market is expected to register a favorable CAGR of ~6% during the forecast tenure. However, there is a need for new designs in wearable smart patches. Hence, companies should increase their innovation in reusable smart patches with sensors to monitor a patient’s physiological signs. Smart adhesive diabetes patches have the capability to monitor blood sugar levels and have doses of insulin pre-loaded in very tiny microneedles.
The global smart patches market was worth US$ 8.1 Bn and is projected to reach a value of US$ 15.5 Bn by the end of 2031
Smart patches market is anticipated to grow at a CAGR of 6% during the forecast period
North America accounted for a major share of the global smart patches market
Smart patches market is driven by increase in incidence of chronic and lifestyle diseases such as blood pressure, obesity, cardiac disorders, and diabetes is projected to boost the growth of the global market
Key players in the global smart patches market include BioIntelliSence, Inc., iRhythm Technologies, Inc., BioTelemetry, Inc., Feeligreen, G-Tech, Inc., GENTAG, Inc., The IONTO Team, Insulet Corporation, Tracxn Technologies, and VivaLNK, Inc.
1. Preface
1.1. Market Definition and Scope
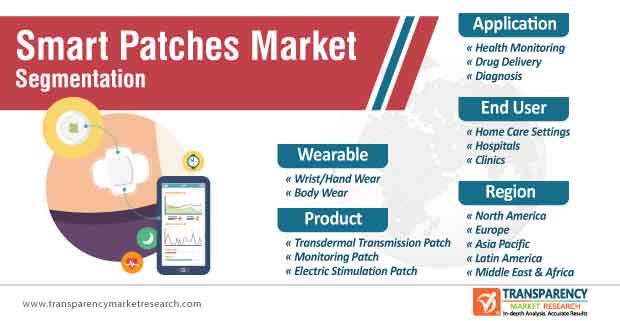
1.2. Market Segmentation
1.3. Key Research Objectives
1.4. Research Highlights
2. Assumptions and Research Methodology
3. Executive Summary: Global Smart Patches Market
4. Market Overview
4.1. Introduction & Overview
4.2. Market Dynamics
4.2.1. Drivers
4.2.2. Restraints
4.2.3. Opportunities
4.3. Global Smart Patches Market Analysis and Forecast, 2017–2031
5. Market Outlook
5.1. Technological Advancement
5.2. COVID-19 Impact Analysis
5.3. Porter’s Five Force Analysis
6. Global Smart Patches Market Analysis and Forecast, by Product
6.1. Introduction & Definition
6.2. Global Smart Patches Market Value (US$ Mn) Forecast, by Product, 2017–2031
6.2.1. Transdermal Transmission Patch
6.2.2. Monitoring Patch
6.2.3. Electric Stimulation Patch
6.3. Global Smart Patches Market Attractiveness Analysis, by Product
7. Global Smart Patches Market Analysis and Forecast, by Wearable
7.1. Introduction & Definition
7.2. Global Smart Patches Market Value (US$ Mn) Forecast, by Wearable, 2017–2031
7.2.1. Wrist/Hand Wear
7.2.2. Body Wear
7.3. Global Smart Patches Market Attractiveness Analysis, by Wearable
8. Global Smart Patches Market Analysis and Forecast, by Application
8.1. Introduction & Definition
8.2. Global Smart Patches Market Value (US$ Mn) Forecast, by Application, 2017–2031
8.2.1. Health Monitoring
8.2.2. Drug Delivery
8.2.3. Diagnosis
8.3. Global Smart Patches Market Attractiveness Analysis, by Application
9. Global Smart Patches Market Analysis and Forecast, by End-user
9.1. Introduction & Definition
9.2. Global Smart Patches Market Value (US$ Mn) Forecast, by End-user, 2017–2031
9.2.1. Home Care Settings
9.2.2. Hospitals
9.2.3. Clinics
9.3. Global Smart Patches Market Attractiveness Analysis, by End-user
10. Global Smart Patches Market Analysis and Forecast, by Region
10.1. Key Findings
10.2. Global Smart Patches Market Value (US$ Mn) Forecast, by Region
10.2.1. North America
10.2.2. Europe
10.2.3. Asia Pacific
10.2.4. Latin America
10.2.5. Middle East & Africa
10.3. Global Smart Patches Market Attractiveness Analysis, by Region
11. North America Smart Patches Market Analysis and Forecast
11.1. Introduction
11.2. North America Smart Patches Market Value (US$ Mn) Forecast, by Product, 2017–2031
11.2.1. Transdermal Transmission Patch
11.2.2. Monitoring Patch
11.2.3. Electric Stimulation Patch
11.3. North America Smart Patches Market Value (US$ Mn) Forecast, by Wearable, 2017–2031
11.3.1. Wrist/Hand Wear
11.3.2. Body Wear
11.4. North America Smart Patches Market Value (US$ Mn) Forecast, by Application, 2017–2031
11.4.1. Health Monitoring
11.4.2. Drug Delivery
11.4.3. Diagnosis
11.5. North America Smart Patches Market Value (US$ Mn) Forecast, by End-user, 2017–2031
11.5.1. Home Care Settings
11.5.2. Hospitals
11.5.3. Clinics
11.6. North America Smart Patches Market Value (US$ Mn) Forecast, by Country, 2017–2031
11.6.1. U.S.
11.6.2. Canada
11.7. North America Smart Patches Market Attractiveness Analysis
11.7.1. By Product
11.7.2. By Wearable
11.7.3. By Application
11.7.4. By End-user
11.7.5. By Country
12. Europe Smart Patches Market Analysis and Forecast
12.1. Introduction
12.2. Europe Smart Patches Market Value (US$ Mn) Forecast, by Product, 2017–2031
12.2.1. Transdermal Transmission Patch
12.2.2. Monitoring Patch
12.2.3. Electric Stimulation Patch
12.3. Europe Smart Patches Market Value (US$ Mn) Forecast, by Wearable, 2017–2031
12.3.1. Wrist/Hand Wear
12.3.2. Body Wear
12.4. Europe Smart Patches Market Value (US$ Mn) Forecast, by Application, 2017–2031
12.4.1. Health Monitoring
12.4.2. Drug Delivery
12.4.3. Diagnosis
12.5. Europe Smart Patches Market Value (US$ Mn) Forecast, by End-user, 2017–2031
12.5.1. Home Care Settings
12.5.2. Hospitals
12.5.3. Clinics
12.6. Europe Smart Patches Market Value (US$ Mn) Forecast, by Country/Sub-region, 2017–2031
12.6.1. Germany
12.6.2. U.K.
12.6.3. France
12.6.4. Spain
12.6.5. Italy
12.6.6. Rest of Europe
12.7. Europe Smart Patches Market Attractiveness Analysis
12.7.1. By Product
12.7.2. By Wearable
12.7.3. By Application
12.7.4. By End-user
12.7.5. By Country/Sub-region
13. Asia Pacific Smart Patches Market Analysis and Forecast
13.1. Introduction
13.2. Asia Pacific Smart Patches Market Value (US$ Mn) Forecast, by Product, 2017–2031
13.2.1. Transdermal Transmission Patch
13.2.2. Monitoring Patch
13.2.3. Electric Stimulation Patch
13.3. Asia Pacific Smart Patches Market Value (US$ Mn) Forecast, by Wearable, 2017–2031
13.3.1. Wrist/Hand Wear
13.3.2. Body Wear
13.4. Asia Pacific Smart Patches Market Value (US$ Mn) Forecast, by Application, 2017–2031
13.4.1. Health Monitoring
13.4.2. Drug Delivery
13.4.3. Diagnosis
13.5. Asia Pacific Smart Patches Market Value (US$ Mn) Forecast, by End-user, 2017–2031
13.5.1. Home Care Settings
13.5.2. Hospitals
13.5.3. Clinics
13.6. Asia Pacific Smart Patches Market Value (US$ Mn) Forecast, by Country/Sub-region, 2017–2031
13.6.1. China
13.6.2. Japan
13.6.3. India
13.6.4. Australia & New Zealand
13.6.5. Rest of Asia Pacific
13.7. Asia Pacific Smart Patches Market Attractiveness Analysis
13.7.1. By Product
13.7.2. By Wearable
13.7.3. By Application
13.7.4. By End-user
13.7.5. By Country/Sub-region
14. Latin America Smart Patches Market Analysis and Forecast
14.1. Introduction
14.2. Latin America Smart Patches Market Value (US$ Mn) Forecast, by Product, 2017–2031
14.2.1. Transdermal Transmission Patch
14.2.2. Monitoring Patch
14.2.3. Electric Stimulation Patch
14.3. Latin America Smart Patches Market Value (US$ Mn) Forecast, by Wearable, 2017–2031
14.3.1. Wrist/Hand Wear
14.3.2. Body Wear
14.4. Latin America Smart Patches Market Value (US$ Mn) Forecast, by Application, 2017–2031
14.4.1. Health Monitoring
14.4.2. Drug Delivery
14.4.3. Diagnosis
14.5. Latin America Smart Patches Market Value (US$ Mn) Forecast, by End-user, 2017–2031
14.5.1. Home Care Settings
14.5.2. Hospitals
14.5.3. Clinics
14.6. Latin America Smart Patches Market Value (US$ Mn) Forecast, by Country/Sub-region, 2017–2031
14.6.1. Brazil
14.6.2. Mexico
14.6.3. Rest of Latin America
14.7. Latin America Smart Patches Market Attractiveness Analysis
14.7.1. By Product
14.7.2. By Wearable
14.7.3. By Application
14.7.4. By End-user
14.7.5. By Country/Sub-region
15. Middle East & Africa Smart Patches Market Analysis and Forecast
15.1. Introduction
15.2. Middle East & Africa Smart Patches Market Value (US$ Mn) Forecast, by Product, 2017–2031
15.2.1. Transdermal Transmission Patch
15.2.2. Monitoring Patch
15.2.3. Electric Stimulation Patch
15.3. Middle East & Africa Smart Patches Market Value (US$ Mn) Forecast, by Wearable, 2017–2031
15.3.1. Wrist/Hand Wear
15.3.2. Body Wear
15.4. Middle East & Africa Smart Patches Market Value (US$ Mn) Forecast, by Application, 2017–2031
15.4.1. Health Monitoring
15.4.2. Drug Delivery
15.4.3. Diagnosis
15.5. Middle East & Africa Smart Patches Market Value (US$ Mn) Forecast, by End-user, 2017–2031
15.5.1. Home Care Settings
15.5.2. Hospitals
15.5.3. Clinics
15.6. Middle East & Africa Smart Patches Market Value (US$ Mn) Forecast, by Country/Sub-region, 2017–2031
15.6.1. GCC Countries
15.6.2. South Africa
15.6.3. Rest of Middle East & Africa
15.7. Middle East & Africa Smart Patches Market Attractiveness Analysis
15.7.1. By Product
15.7.2. By Wearable
15.7.3. By Application
15.7.4. By End-user
15.7.5. By Country/Sub-region
15.7.6. Competition Landscape
15.8. Market Position Analysis/Ranking Analysis, by Company, 2020
15.9. Company Profiles
15.9.1. BioIntelliSence, Inc.
15.9.1.1. Company Overview (HQ, Business Segments, Employee Strength)
15.9.1.2. Growth Strategies
15.9.1.3. SWOT Analysis
15.9.2. iRhythm Technologies, Inc.
15.9.2.1. Company Overview (HQ, Business Segments, Employee Strength)
15.9.2.2. Growth Strategies
15.9.2.3. SWOT Analysis
15.9.3. BioTelemetry, Inc.
15.9.3.1. Company Overview (HQ, Business Segments)
15.9.3.2. Growth Strategies
15.9.3.3. SWOT Analysis
15.9.4. Feeligreen
15.9.4.1. Company Overview (HQ, Business Segments, Employee Strength)
15.9.4.2. Growth Strategies
15.9.4.3. SWOT Analysis
15.9.5. G-Tech, Inc.
15.9.5.1. Company Overview (HQ, Business Segments)
15.9.5.2. Growth Strategies
15.9.5.3. SWOT Analysis
15.9.6. GENTAG, Inc.
15.9.6.1. Company Overview (HQ, Business Segments, Employee Strength)
15.9.6.2. Growth Strategies
15.9.6.3. SWOT Analysis
15.9.7. The IONTO Team
15.9.7.1. Company Overview (HQ, Business Segments, Employee Strength)
15.9.7.2. Growth Strategies
15.9.7.3. SWOT Analysis
15.9.8. Insulet Corporation
15.9.8.1. Company Overview (HQ, Business Segments, Employee Strength)
15.9.8.2. Growth Strategies
15.9.8.3. SWOT Analysis
15.9.9. Tracxn Technologies
15.9.9.1. Company Overview (HQ, Business Segments, Employee Strength)
15.9.9.2. Growth Strategies
15.9.9.3. SWOT Analysis
15.9.10. VivaLNK, Inc.
15.9.10.1. Company Overview (HQ, Business Segments, Employee Strength)
15.9.10.2. Growth Strategies
15.9.10.3. SWOT Analysis
List of Tables
Table 01: Global Smart Patches Market Revenue (US$ Mn) Forecast, by Product, 2017–2031
Table 02: Global Smart Patches Market Revenue (US$ Mn) Forecast, by Wearable, 2017–2031
Table 03: Global Smart Patches Market Revenue (US$ Mn) Forecast, by Application, 2017–2031
Table 04: Global Smart Patches Market Revenue (US$ Mn) Forecast, by End-user, 2017–2031
Table 05: Global Smart Patches Market Value (US$ Mn) Forecast, by Region, 2017–2031
Table 06: North America Smart Patches Market Value (US$ Mn) Forecast, by Country, 2017–2031
Table 07: North America Smart Patches Market Value (US$ Mn) Forecast, by Product, 2017–2031
Table 08: North America Smart Patches Market Value (US$ Mn) Forecast, by Wearable, 2017–2031
Table 09: North America Smart Patches Market Value (US$ Mn) Forecast, by Application, 2017–2031
Table 10: North America Smart Patches Market Value (US$ Mn) Forecast, by End-user, 2017–2031
Table 11: Europe Smart Patches Market Value (US$ Mn) Forecast, by Country/Sub-region, 2017–2031
Table 12: Europe Smart Patches Market Value (US$ Mn) Forecast, by Product, 2017–2031
Table 13: Europe Smart Patches Market Value (US$ Mn) Forecast, by Wearable, 2017–2031
Table 14: Europe Smart Patches Market Value (US$ Mn) Forecast, by Application, 2017–2031
Table 15: Europe Smart Patches Market Value (US$ Mn) Forecast, by End-user, 2017–2031
Table 16: Asia Pacific Smart Patches Market Value (US$ Mn) Forecast, by Country/Sub-region, 2017–2031
Table 17: Asia Pacific Smart Patches Market Value (US$ Mn) Forecast, by Product, 2017–2031
Table 18: Asia Pacific Smart Patches Market Value (US$ Mn) Forecast, by Wearable, 2017–2031
Table 19: Asia Pacific Smart Patches Market Value (US$ Mn) Forecast, by Application, 2017–2031
Table 20: Asia Pacific Smart Patches Market Value (US$ Mn) Forecast, by End-user, 2017–2031
Table 21: Latin America Smart Patches Market Value (US$ Mn) Forecast, by Country/Sub-region, 2017–2031
Table 22: Latin America Smart Patches Market Value (US$ Mn) Forecast, by Product, 2017–2031
Table 23: Latin America Smart Patches Market Value (US$ Mn) Forecast, by Wearable, 2017–2031
Table 24: Latin America Smart Patches Market Value (US$ Mn) Forecast, by Application, 2017–2031
Table 25: Latin America Smart Patches Market Value (US$ Mn) Forecast, by End-user, 2017–2031
Table 26: Middle East & Africa Smart Patches Market Value (US$ Mn) Forecast, by Country/Sub-region, 2017–2031
Table 27: Middle East & Africa Smart Patches Market Value (US$ Mn) Forecast, by Product, 2017–2031
Table 28: Middle East & Africa Smart Patches Market Value (US$ Mn) Forecast, by Wearable, 2017–2031
Table 29: Middle East & Africa Smart Patches Market Value (US$ Mn) Forecast, by Application, 2017–2031
Table 30: Middle East & Africa Smart Patches Market Value (US$ Mn) Forecast, by End-user, 2017–2031
List of Figures
Figure 01: Global Smart Patches Market Value (US$ Mn) Forecast and Y-o-Y Growth (%) Projection, 2017–2031
Figure 02: Global Smart Patches Market Value Share, by Region, 2020
Figure 03: Global Smart Patches Market Value Share Analysis, by Product, 2020 and 2031
Figure 04: Global Smart Patches Market Revenue (US$ Mn), by Transdermal Transmission Patch, 2017–2031
Figure 05: Global Smart Patches Market Revenue (US$ Mn), by Monitoring Patch, 2017–2031
Figure 06: Global Smart Patches Market Revenue (US$ Mn), by Electric Simulation Patch, 2017–2031
Figure 07: Global Smart Patches Market Attractive Analysis, by Product, 2021–2031
Figure 08: Global Smart Patches Market Value Share Analysis, by Wearable, 2020 and 2031
Figure 09: Global Smart Patches Market Revenue (US$ Mn), by Wrist/Hand Wear, 2017–2031
Figure 10: Global Smart Patches Market Revenue (US$ Mn), by Body Wear, 2017–2031
Figure 11: Global Smart Patches Market Attractive Analysis, by Wearable, 2021–2031
Figure 12: Global Smart Patches Market Value Share Analysis, by Application, 2020 and 2031
Figure 13: Global Smart Patches Market Revenue (US$ Mn), by Health Monitoring, 2017–2031
Figure 14: Global Smart Patches Market Revenue (US$ Mn), by Drug Delivery, 2017–2031
Figure 15: Global Smart Patches Market Revenue (US$ Mn), by Diagnosis, 2017–2031
Figure 16: Global Smart Patches Market Attractive Analysis, by Application, 2021–2031
Figure 17: Global Smart Patches Market Value Share Analysis, by End-user, 2020 and 2031
Figure 18: Global Smart Patches Market Revenue (US$ Mn), by Home Care Settings, 2017–2031
Figure 19: Global Smart Patches Market Revenue (US$ Mn), by Hospitals, 2017–2031
Figure 20: Global Smart Patches Market Revenue (US$ Mn), by Clinics, 2017–2031
Figure 21: Global Smart Patches Market Attractive Analysis, by End-user, 2021–2031
Figure 22: Global Smart Patches Market Value Share Analysis, by Region, 2020 and 2031
Figure 23: Global Smart Patches Market Attractiveness Analysis, by Region, 2021–2031
Figure 24: North America Smart Patches Market Value (US$ Mn) Forecast, 2017–2031
Figure 25: North America Smart Patches Market Value Share Analysis, by Country, 2020 and 2031
Figure 26: North America Smart Patches Market Attractiveness Analysis, by Country, 2021–2031
Figure 27: North America Smart Patches Market Value Share Analysis, by Product, 2020 and 2031
Figure 28: North America Smart Patches Market Attractiveness Analysis, by Product, 2021–2031
Figure 29: North America Smart Patches Market Value Share Analysis, by Wearable, 2020 and 2031
Figure 30: North America Smart Patches Market Attractiveness Analysis, by Wearable, 2021–2031
Figure 31: North America Smart Patches Market Value Share Analysis, by Application, 2020 and 2031
Figure 32: North America Smart Patches Market Attractiveness Analysis, by Application, 2021–2031
Figure 33: North America Smart Patches Market Value Share Analysis, by End-user, 2020 and 2031
Figure 34: North America Smart Patches Market Attractiveness Analysis, by End-user, 2021–2031
Figure 35: Europe Smart Patches Market Value (US$ Mn) Forecast, 2017–2031
Figure 36: Europe Smart Patches Market Value Share Analysis, by Country/Sub-region, 2020 and 2031
Figure 37: Europe Smart Patches Market Attractiveness Analysis, by Country/Sub-region, 2021–2031
Figure 38: Europe Smart Patches Market Value Share Analysis, by Product, 2020 and 2031
Figure 39: Europe Smart Patches Market Attractiveness Analysis, by Product, 2021–2031
Figure 40: Europe Smart Patches Market Value Share Analysis, by Wearable, 2020 and 2031
Figure 41: Europe Smart Patches Market Attractiveness Analysis, by Wearable, 2021–2031
Figure 42: Europe Smart Patches Market Value Share Analysis, by Application, 2020 and 2031
Figure 43: Europe Smart Patches Market Attractiveness Analysis, by Application, 2021–2031
Figure 44: Europe Smart Patches Market Value Share Analysis, by End-user, 2020 and 2031
Figure 45: Europe Smart Patches Market Attractiveness Analysis, by End-user, 2021–2031
Figure 46: Asia Pacific Smart Patches Market Value (US$ Mn) Forecast, 2017–2031
Figure 47: Asia Pacific Smart Patches Market Value Share Analysis, by Country/Sub-region, 2020 and 2031
Figure 48: Asia Pacific Smart Patches Market Attractiveness Analysis, by Country/Sub-region, 2021–2031
Figure 49: Asia Pacific Smart Patches Market Value Share Analysis, by Product, 2020 and 2031
Figure 50: Asia Pacific Smart Patches Market Attractiveness Analysis, by Product, 2021–2031
Figure 51: Asia Pacific Smart Patches Market Value Share Analysis, by Wearable, 2020 and 2031
Figure 52: Asia Pacific Smart Patches Market Attractiveness Analysis, by Wearable, 2021–2031
Figure 53: Asia Pacific Smart Patches Market Value Share Analysis, by Application, 2020 and 2031
Figure 54: Asia Pacific Smart Patches Market Attractiveness Analysis, by Application, 2021–2031
Figure 55: Asia Pacific Smart Patches Market Value Share Analysis, by End-user, 2020 and 2031
Figure 56: Asia Pacific Smart Patches Market Attractiveness Analysis, by End-user, 2021–2031
Figure 57: Latin America Smart Patches Market Value (US$ Mn) Forecast, 2017–2031
Figure 58: Latin America Smart Patches Market Value Share Analysis, by Country/Sub-region, 2020 and 2031
Figure 59: Latin America Smart Patches Market Attractiveness Analysis, by Country/Sub-region, 2021–2031
Figure 60: Latin America Smart Patches Market Value Share Analysis, by Product, 2020 and 2031
Figure 61: Latin America Smart Patches Market Attractiveness Analysis, by Product, 2021–2031
Figure 62: Latin America Smart Patches Market Value Share Analysis, by Wearable, 2020 and 2031
Figure 63: Latin America Smart Patches Market Attractiveness Analysis, by Wearable, 2021–2031
Figure 64: Latin America Smart Patches Market Value Share Analysis, by Application, 2020 and 2031
Figure 65: Latin America Smart Patches Market Attractiveness Analysis, by Application, 2021–2031
Figure 66: Latin America Smart Patches Market Value Share Analysis, by End-user, 2020 and 2031
Figure 67: Latin America Smart Patches Market Attractiveness Analysis, by End-user, 2021–2031
Figure 68: Middle East & Africa Smart Patches Market Value (US$ Mn) Forecast, 2017–2031
Figure 69: Middle East & Africa Smart Patches Market Value Share Analysis, by Country/Sub-region, 2020 and 2031
Figure 70: Middle East & Africa Smart Patches Market Attractiveness Analysis, by Country/Sub-region, 2021–2031
Figure 71: Middle East & Africa Smart Patches Market Value Share Analysis, by Product, 2020 and 2031
Figure 72: Middle East & Africa Smart Patches Market Attractiveness Analysis, by Product, 2021–2031
Figure 73: Middle East & Africa Smart Patches Market Value Share Analysis, by Wearable, 2020 and 2031
Figure 74: Middle East & Africa Smart Patches Market Attractiveness Analysis, by Wearable, 2021–2031
Figure 75: Middle East & Africa Smart Patches Market Value Share Analysis, by Application, 2020 and 2031
Figure 76: Middle East & Africa Smart Patches Market Attractiveness Analysis, by Application, 2021–2031
Figure 77: Middle East & Africa Smart Patches Market Value Share Analysis, by End-user, 2020 and 2031
Figure 78: Middle East & Africa Smart Patches Market Attractiveness Analysis, by End-user, 2021–2031
Copyright © Transparency Market Research, Inc. All Rights reserved
Trust Online

Smart Patches Market