
Reports
Reports
Analysts’ Viewpoint on Smart and Mobile Supply Chain Solutions Market Scenario
Smart and mobile supply chain management solutions rely on advanced technologies such as big data, Artificial Intelligence (AI), Machine Learning (ML), Internet of Things (IoT), blockchain, and Robotic Process Automation (RPA) for robust outcomes. Mobile apps for supply chain management help companies reduce operational costs, shorten delivery times, lower negative environmental impact, and automate processes. Rise in usage of Track Management System (TMS), Warehouse Management Software (WMS), Manufacturing Execution Systems (MES), and other mobile apps for supply chain management is propelling the market. Players offering mobile technologies and supply chain management solutions are integrating advanced technologies such as 3D printing, cybersecurity, cloud, data analytics, simulation, augmented reality, and digital twin into digital supply chain platforms to enhance their revenue streams.
Smart and mobile Supply Chain Management (SCM) software integrates functions such as sourcing, procurement, manufacturing, storage, transportation, and sales by completely managing information, material, and financial flows. It improves services to offer an enhanced customer experience and optimize operational costs. The idea for smart and mobile supply chain solutions came from deviations in the manufacturing environment such as increase in price of manufacturing, shortened product lifecycles, and shrinking resources of manufacturing bases.
Supply chain companies are adopting top mobile solutions for transportation & logistics including Fleet Management System (FMS), Transport Management System (TMS), trailer management, and Warehouse Management System (WMS). They employ mobile apps for supply chain management to track their logistics fleet, scan RFID tags and barcodes, view and edit invoices, and measure performance. Supply chain management software with mobile integration helps organizations in vehicle inspections, deliveries, customer surveys, route planning, and task management. Mobile supply chain management enables businesses to improve productivity and customer experience, and automate the delivery process.
Manufacturers are leveraging Industry 4.0 to optimize and streamline their operations. Thus, they are generating a large number of data sets. Integration of AI and ML can help analyze and process large data sets to solve complex operational issues. AI and ML also provide end-to-end visibility of supply chain processes, predictive analysis, and operational bottlenecks prediction to further strengthen supply chain management.
Increase in adoption of industrial automation is driving the demand for mobile devices and applications for supply chain management. Growth in competitiveness has prompted enterprises to manufacture high-quality products and reduce production costs. This has led to widespread adoption of industrial automation solutions to increase productivity, enhance product quality, and boost efficiency and reliability, while reducing design and production costs. The need for quicker turnaround time and efficient utilization of resources is further driving the demand for automation and smart mobile inventory management for the supply chain. Smart inventory management offers complete business visibility, optimizes inventories, and synchronizes supply with demand and manufacturing.
Smart and mobile supply chain solutions offer real-time information and timely decisions about demand-supply networks to quickly respond to any challenge that could negatively impact productivity, efficiency, and quality. Furthermore, these solutions cover supply chain planning, transportation management systems, warehouse management systems, manufacturing execution systems, and procurement solutions that help industries bridge the gap between process control and ERP.
Adoption of Robotic Process Automation (RPA) helps improve supply chain efficiency and reduce cost by automating repeatable tasks and processes, and eliminating human errors and anomalies. RPA generates a sequence of actions, integrates with back-end systems such as ERP and CRM, and then automatically executes these repeatable tasks. Integrating RPA into smart and mobile supply chain management solutions helps streamline various supply chain processes such as demand and supply planning, email automation, vendor selection, order processing, payments, inventory management, and customer service.
RPA, AI, and ML enable businesses to predict and prepare for a rapid increase in demand for products. RPA bots improve operations efficiency and eliminate human errors by automating the collation and presentation of the relevant data from vendors, sales teams, and market intelligence reports. RPA enables organizations to automate the entire communication process and frees human resources that can be utilized in core business operations. Email automation provides real-time notification to all supply chain stakeholders by automating email responses whenever an order is placed, dispatched, delayed, or received. RPA also allows businesses to automate various vendor selection processes such as preliminary analysis of vendor documents, evaluation of the vendor’s credit, and finalization of vendor selection. It tracks inventory levels, sends notifications about low inventory levels, and reorders them automatically. RPA enables supply chain stakeholders to determine optimal inventory levels and prepare for a sudden surge in demand. Thus, increase in the integration of RPA in smart and mobile supply chain management solutions is augmenting the market.
North America is anticipated to dominate the global smart and mobile supply chain solutions market by the end of 2022. Growth of the market can be ascribed to the expansion of the e-commerce industry and rise in demand for logistics management services in the region. Industries in North America are extensively adopting software that provides easy access to customer information and real-time analytics, and improves internal production processes and operation monitoring.
The smart and mobile supply chain solutions market in Asia Pacific is expected to grow at the highest CAGR during the forecast period due to the increase in adoption of advanced technologies along with GPS and RFID in manufacturing and retail & consumer goods sectors in the region. Additionally, many companies in China, Japan, India, and Singapore are adopting smart machines, ERP systems, mobile technologies, and supply chain management solutions to strengthen their operations.
Detailed profiles of providers of smart and mobile supply chain solutions have been included in the market report to evaluate their financials, key product offerings, recent developments, and strategies. The future of the mobile in supply chain management market appears promising, with key players adopting various strategies such as investment in R&D activities, expansion of product portfolios, and mergers and acquisitions to enhance their market share. Prominent players operating in the global smart and mobile supply chain solutions market are IBM Corporation, Oracle Corporation, Manhattan Associates, Inc., Epicor Transportation Management Systems (TMS) Corporation, The Descartes Systems Group Inc., Blue Yonder Group, Inc. (JDA Transportation Management Systems (TMS) Group, Inc.), Infor, Magaya Corporation, Dassault Systèmes, Körber AG, and Honeywell International Inc.
Each of these players has been profiled in the smart and mobile supply chain solutions market report based on parameters such as company overview, financial overview, business strategies, product portfolio, business segments, and recent developments.
|
Attribute |
Detail |
|
Market Size Value in 2021 |
US$ 34.49 Bn |
|
Market Forecast Value in 2031 |
US$ 126.44 Bn |
|
Growth Rate (CAGR) |
14.0% |
|
Forecast Period |
2022–2031 |
|
Historical Data Available for |
2017–2020 |
|
Quantitative Units |
US$ Bn for Value |
|
Market Analysis |
Includes cross segment analysis at global as well as regional level. Furthermore, qualitative analysis includes drivers, restraints, opportunities, key trends, Porter’s Five Forces analysis, value chain analysis, and key trend analysis. |
|
Competition Landscape |
|
|
Format |
Electronic (PDF) + Excel |
|
Market Segmentation |
|
|
Regions Covered |
|
|
Countries Covered |
|
|
Companies Profiled |
|
|
Customization Scope |
Available upon request |
|
Pricing |
Available upon request |
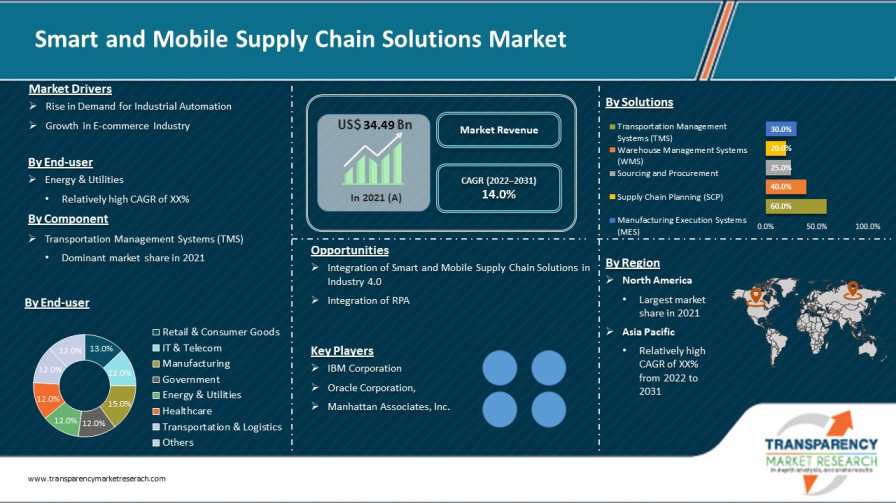
The smart and mobile supply chain solutions market stood at US$ 34.49 Bn in 2021
The smart and mobile supply chain solutions market is estimated to advance at the rate of 14.0% during the forecast period
Rise in demand for industrial automation and growth in the e-commerce industry are driving the market
Transportation Management Systems (TMS) was the largest segment of the smart and mobile supply chain solutions market in 2021
North America is expected to dominate the smart and mobile supply chain solutions market during the forecast period
IBM Corporation, Oracle Corporation, Manhattan Associates, Inc., Epicor Transportation Management Systems (TMS) Corporation, The Descartes Systems Group Inc., Blue Yonder Group, Inc. (JDA Transportation Management Systems (TMS) Group, Inc.), Infor, Magaya Corporation, Dassault Systèmes, Körber AG, and Honeywell International Inc.
1. Preface
1.1. Market Introduction
1.2. Market Segmentation
1.3. Key Research Objectives
2. Assumptions and Research Methodology
2.1. Research Methodology
2.1.1. List of Primary and Secondary Sources
2.2. Key Assumptions for Data Modelling
3. Executive Summary: Global Smart and Mobile Supply Chain Solutions Market
4. Market Overview
4.1. Market Definition
4.2. Technology/ Product Roadmap
4.3. Porter’s Five Forces Analysis
4.4. PESTLE Analysis
4.5. Market Factor Analysis
4.5.1. Forecast Factors
4.5.2. Ecosystem/ Value Chain Analysis
4.5.3. Market Dynamics (Growth Influencers)
4.5.3.1. Drivers
4.5.3.2. Restraints
4.5.3.3. Opportunities
4.5.3.4. Impact Analysis of Drivers and Restraints
4.6. COVID-19 Impact Analysis
4.6.1. Impact of COVID-19 on Smart and Mobile Supply Chain Solutions Market
4.6.2. End-user Sentiment Analysis: Comparative Analysis on Spending
4.6.2.1. Increase in Spending
4.6.2.2. Decrease in Spending
4.6.3. Short-term and Long-term Impact on the Market
4.7. Market Opportunity Assessment – by Region (North America/ Europe/ Asia Pacific/ Middle East and Africa/ South America)
4.7.1. By Solutions
4.7.2. Enterprise Size
4.7.3. By End-user
5. Global Smart and Mobile Supply Chain Solutions Market Analysis and Forecast
5.1. Market Revenue Analysis (US$ Bn), 2016-2031
5.1.1. Historic Growth Trends, 2016-2021
5.1.2. Forecast Trends, 2022-2031
6. Global Smart and Mobile Supply Chain Solutions Market Analysis, by Solutions
6.1. Overview and Definitions
6.2. Key Segment Analysis
6.3. Smart and Mobile Supply Chain Solutions Market Size (US$ Bn) Forecast, by Solutions, 2018 - 2031
6.3.1. Transportation Management Systems (TMS)
6.3.2. Warehouse Management Systems (WMS)
6.3.3. Sourcing and Procurement
6.3.4. Supply Chain Planning (SCP)
6.3.5. Manufacturing Execution Systems (MES)
7. Global Smart and Mobile Supply Chain Solutions Market Analysis, by Enterprise Size
7.1. Overview and Definitions
7.2. Key Segment Analysis
7.3. Smart and Mobile Supply Chain Solutions Market Size (US$ Bn) Forecast, by Enterprise Size, 2018 - 2031
7.3.1. SMEs
7.3.2. Large Enterprises
8. Global Smart and Mobile Supply Chain Solutions Market Analysis, by End-user
8.1. Overview and Definitions
8.2. Key Segment Analysis
8.3. Smart and Mobile Supply Chain Solutions Market Size (US$ Bn) Forecast, by End-user, 2018 - 2031
8.3.1. Retail & Consumer Goods
8.3.2. IT & Telecom
8.3.3. Manufacturing
8.3.4. Government
8.3.5. Energy & Utilities
8.3.6. Healthcare
8.3.7. Transportation & Logistics
8.3.8. Others
9. Global Smart and Mobile Supply Chain Solutions Market Analysis and Forecasts, by Region
9.1. Key Findings
9.2. Market Size (US$ Bn) Forecast by Region, 2018-2031
9.2.1. North America
9.2.2. Europe
9.2.3. Asia Pacific
9.2.4. Middle East & Africa
9.2.5. South America
10. North America Smart and Mobile Supply Chain Solutions Market Analysis and Forecast
10.1. Regional Outlook
10.2. Smart and Mobile Supply Chain Solutions Market Size (US$ Bn) Analysis and Forecast, 2018 - 2031
10.2.1. By Solutions
10.2.2. Enterprise Size
10.2.3. By End-user
10.3. Smart and Mobile Supply Chain Solutions Market Size (US$ Bn) Forecast, by Country, 2018 - 2031
10.3.1. U.S.
10.3.2. Canada
10.3.3. Mexico
11. Europe Smart and Mobile Supply Chain Solutions Market Analysis and Forecast
11.1. Regional Outlook
11.2. Smart and Mobile Supply Chain Solutions Market Size (US$ Bn) Analysis and Forecast, 2018 - 2031
11.2.1. By Solutions
11.2.2. Enterprise Size
11.2.3. By End-user
11.3. Smart and Mobile Supply Chain Solutions Market Size (US$ Bn) Forecast, by Country, 2018 - 2031
11.3.1. Germany
11.3.2. UK
11.3.3. France
11.3.4. Italy
11.3.5. Spain
11.3.6. Rest of Europe
12. Asia Pacific Smart and Mobile Supply Chain Solutions Market Analysis and Forecast
12.1. Regional Outlook
12.2. Smart and Mobile Supply Chain Solutions Market Size (US$ Bn) Analysis and Forecast, 2018 - 2031
12.2.1. By Solutions
12.2.2. Enterprise Size
12.2.3. By End-user
12.3. Smart and Mobile Supply Chain Solutions Market Size (US$ Bn) Forecast, by Country, 2018 - 2031
12.3.1. China
12.3.2. India
12.3.3. Japan
12.3.4. ASEAN
12.3.5. Rest of Asia Pacific
13. Middle East & Africa Smart and Mobile Supply Chain Solutions Market Analysis and Forecast
13.1. Regional Outlook
13.2. Smart and Mobile Supply Chain Solutions Market Size (US$ Bn) Analysis and Forecast, 2018 - 2031
13.2.1. By Solutions
13.2.2. Enterprise Size
13.2.3. By End-user
13.3. Smart and Mobile Supply Chain Solutions Market Size (US$ Bn) Forecast, by Country, 2018 - 2031
13.3.1. Saudi Arabia
13.3.2. The United Arab Emirates
13.3.3. South Africa
13.3.4. Rest of Middle East & Africa
14. South America Smart and Mobile Supply Chain Solutions Market Analysis and Forecast
14.1. Regional Outlook
14.2. Smart and Mobile Supply Chain Solutions Market Size (US$ Bn) Analysis and Forecast, 2018 - 2031
14.2.1. By Solutions
14.2.2. Enterprise Size
14.2.3. By End-user
14.3. Smart and Mobile Supply Chain Solutions Market Size (US$ Bn) Forecast, by Country, 2018 - 2031
14.3.1. Brazil
14.3.2. Argentina
14.3.3. Rest of South America
15. Competition Landscape
15.1. Market Competition Matrix, by Leading Players
15.2. Market Revenue Share Analysis (%), by Leading Players (2021)
15.3. Competitive Scenario
15.3.1. List of Emerging, Prominent and Leading Players
15.3.2. Major Mergers & Acquisitions, Expansions, Partnership, Contacts, Deals, etc.
16. Company Profiles
16.1. SAP SE
16.1.1. Business Overview
16.1.2. Company Revenue
16.1.3. Product Portfolio
16.1.4. Geographic Footprint
16.1.5. Strategic Partnership, Merger & Acquisition, Business Expansion, New Product Launch, Innovation etc.
16.2. IBM Corporation
16.2.1. Business Overview
16.2.2. Company Revenue
16.2.3. Product Portfolio
16.2.4. Geographic Footprint
16.2.5. Strategic Partnership, Merger & Acquisition, Business Expansion, New Product Launch, Innovation etc.
16.3. Oracle Corporation
16.3.1. Business Overview
16.3.2. Company Revenue
16.3.3. Product Portfolio
16.3.4. Geographic Footprint
16.3.5. Strategic Partnership, Merger & Acquisition, Business Expansion, New Product Launch, Innovation etc.
16.4. Manhattan Associates, Inc.
16.4.1. Business Overview
16.4.2. Company Revenue
16.4.3. Product Portfolio
16.4.4. Geographic Footprint
16.4.5. Strategic Partnership, Merger & Acquisition, Business Expansion, New Product Launch, Innovation etc.
16.5. Epicor Transportation Management Systems (TMS) Corporation
16.5.1. Business Overview
16.5.2. Company Revenue
16.5.3. Product Portfolio
16.5.4. Geographic Footprint
16.5.5. Strategic Partnership, Merger & Acquisition, Business Expansion, New Product Launch, Innovation etc.
16.6. The Descartes Systems Group Inc.
16.6.1. Business Overview
16.6.2. Company Revenue
16.6.3. Product Portfolio
16.6.4. Geographic Footprint
16.6.5. Strategic Partnership, Merger & Acquisition, Business Expansion, New Product Launch, Innovation etc.
16.7. Blue Yonder Group, Inc. (JDA Transportation Management Systems (TMS) Group, Inc.)
16.7.1. Business Overview
16.7.2. Company Revenue
16.7.3. Product Portfolio
16.7.4. Geographic Footprint
16.7.5. Strategic Partnership, Merger & Acquisition, Business Expansion, New Product Launch, Innovation etc.
16.8. Infor
16.8.1. Business Overview
16.8.2. Company Revenue
16.8.3. Product Portfolio
16.8.4. Geographic Footprint
16.8.5. Strategic Partnership, Merger & Acquisition, Business Expansion, New Product Launch, Innovation etc.
16.9. Magaya Corporation
16.9.1. Business Overview
16.9.2. Company Revenue
16.9.3. Product Portfolio
16.9.4. Geographic Footprint
16.9.5. Strategic Partnership, Merger & Acquisition, Business Expansion, New Product Launch, Innovation etc.
16.10. Dassault Systèmes
16.10.1. Business Overview
16.10.2. Company Revenue
16.10.3. Product Portfolio
16.10.4. Geographic Footprint
16.10.5. Strategic Partnership, Merger & Acquisition, Business Expansion, New Product Launch, Innovation etc.
16.11. Körber AG
16.11.1. Business Overview
16.11.2. Company Revenue
16.11.3. Product Portfolio
16.11.4. Geographic Footprint
16.11.5. Strategic Partnership, Merger & Acquisition, Business Expansion, New Product Launch, Innovation etc.
16.12. Honeywell International Inc.
16.12.1. Business Overview
16.12.2. Company Revenue
16.12.3. Product Portfolio
16.12.4. Geographic Footprint
16.12.5. Strategic Partnership, Merger & Acquisition, Business Expansion, New Product Launch, Innovation etc.
16.13. Others
17. Key Takeaways
List of Tables
Table 1: Acronyms Used in Smart and Mobile Supply Chain Solutions Market
Table 2: North America Smart and Mobile Supply Chain Solutions Market Revenue Analysis, by Country, 2022 - 2031 (US$ Bn)
Table 3: Europe Smart and Mobile Supply Chain Solutions Market Revenue Analysis, by Country, 2022 - 2031 (US$ Bn)
Table 4: Asia Pacific Smart and Mobile Supply Chain Solutions Market Revenue Analysis, by Country, 2022 - 2031 (US$ Bn)
Table 5: Middle East & Africa Smart and Mobile Supply Chain Solutions Market Revenue Analysis, by Country, 2022 and 2031 (US$ Bn)
Table 6: South America Smart and Mobile Supply Chain Solutions Market Revenue Analysis, by Country, 2022 - 2031 (US$ Bn)
Table 7: Forecast Factors: Relevance and Impact
Table 8: Global Smart and Mobile Supply Chain Solutions Market Value (US$ Bn) Forecast, by Solutions, 2018 – 2031
Table 9: Global Smart and Mobile Supply Chain Solutions Market Value (US$ Bn) Forecast, by Enterprise Size, 2018 – 2031
Table 10: Global Smart and Mobile Supply Chain Solutions Market Value (US$ Bn) Forecast, by End-user, 2018 – 2031
Table 11: Global Smart and Mobile Supply Chain Solutions Market Volume (US$ Bn) Forecast, by Region, 2018 – 2031
Table 12: North America Smart and Mobile Supply Chain Solutions Market Value (US$ Bn) Forecast, by Solutions, 2018 – 2031
Table 13: North America Smart and Mobile Supply Chain Solutions Market Value (US$ Bn) Forecast, by Enterprise Size, 2018 – 2031
Table 14: North America Smart and Mobile Supply Chain Solutions Market Value (US$ Bn) Forecast, by End-user, 2018 – 2031
Table 15: North America Smart and Mobile Supply Chain Solutions Market Value (US$ Bn) Forecast, by Country, 2018 - 2031
Table 16: U.S. Smart and Mobile Supply Chain Solutions Market Revenue CAGR Breakdown (%), by Growth Term
Table 17: Canada Smart and Mobile Supply Chain Solutions Market Revenue CAGR Breakdown (%), by Growth Term
Table 18: Mexico Smart and Mobile Supply Chain Solutions Market Revenue CAGR Breakdown (%), by Growth Term
Table 19: Europe Smart and Mobile Supply Chain Solutions Market Value (US$ Bn) Forecast, by Solutions, 2018 – 2031
Table 20: Europe Smart and Mobile Supply Chain Solutions Market Value (US$ Bn) Forecast, by Enterprise Size, 2018 – 2031
Table 21: Europe Smart and Mobile Supply Chain Solutions Market Value (US$ Bn) Forecast, by End-user, 2018 – 2031
Table 22: Europe Smart and Mobile Supply Chain Solutions Market Value (US$ Bn) Forecast, by Country, 2018 - 2031
Table 23: Germany Smart and Mobile Supply Chain Solutions Market Revenue CAGR Breakdown (%), by Growth Term
Table 24: U.K. Smart and Mobile Supply Chain Solutions Market Revenue CAGR Breakdown (%), by Growth Term
Table 25: France Smart and Mobile Supply Chain Solutions Market Revenue CAGR Breakdown (%), by Growth Term
Table 26: Spain Smart and Mobile Supply Chain Solutions Market Revenue CAGR Breakdown (%), by Growth Term
Table 27: Italy Smart and Mobile Supply Chain Solutions Market Revenue CAGR Breakdown (%), by Growth Term
Table 28: Asia Pacific Smart and Mobile Supply Chain Solutions Market Value (US$ Bn) Forecast, by Solutions, 2018 – 2031
Table 29: Asia Pacific Smart and Mobile Supply Chain Solutions Market Value (US$ Bn) Forecast, by Enterprise Size, 2018 – 2031
Table 30: Asia Pacific Smart and Mobile Supply Chain Solutions Market Value (US$ Bn) Forecast, by End-user, 2018 – 2031
Table 31: Asia Pacific Smart and Mobile Supply Chain Solutions Market Value (US$ Bn) Forecast, by Country, 2018 - 2031
Table 32: China Smart and Mobile Supply Chain Solutions Market Revenue CAGR Breakdown (%), by Growth Term
Table 33: India Smart and Mobile Supply Chain Solutions Market Revenue CAGR Breakdown (%), by Growth Term
Table 34: Japan Smart and Mobile Supply Chain Solutions Market Revenue CAGR Breakdown (%), by Growth Term
Table 35: ASEAN Smart and Mobile Supply Chain Solutions Market Revenue CAGR Breakdown (%), by Growth Term
Table 36: Middle East & Africa Smart and Mobile Supply Chain Solutions Market Value (US$ Bn) Forecast, by Solutions, 2018 – 2031
Table 37: Middle East & Africa Smart and Mobile Supply Chain Solutions Market Value (US$ Bn) Forecast, by Enterprise Size, 2018 – 2031
Table 38: Middle East & Africa Smart and Mobile Supply Chain Solutions Market Value (US$ Bn) Forecast, by End-user, 2018 – 2031
Table 39: Middle East & Africa Smart and Mobile Supply Chain Solutions Market Value (US$ Bn) Forecast, by Country, 2018 - 2031
Table 40: Saudi Arabia Smart and Mobile Supply Chain Solutions Market Revenue CAGR Breakdown (%), by Growth Term
Table 41: United Arab Emirates Smart and Mobile Supply Chain Solutions Market Revenue CAGR Breakdown (%), by Growth Term
Table 42: South Africa Smart and Mobile Supply Chain Solutions Market Revenue CAGR Breakdown (%), by Growth Term
Table 43: South America Smart and Mobile Supply Chain Solutions Market Value (US$ Bn) Forecast, by Solutions, 2018 – 2031
Table 44: South America Smart and Mobile Supply Chain Solutions Market Value (US$ Bn) Forecast, by Enterprise Size, 2018 – 2031
Table 45: South America Smart and Mobile Supply Chain Solutions Market Value (US$ Bn) Forecast, by End-user, 2018 – 2031
Table 46: South America Smart and Mobile Supply Chain Solutions Market Value (US$ Bn) Forecast, by Country, 2018 - 2031
Table 47: Brazil Emirates Smart and Mobile Supply Chain Solutions Market Revenue CAGR Breakdown (%), by Growth Term
Table 48: Argentina Smart and Mobile Supply Chain Solutions Market Revenue CAGR Breakdown (%), by Growth Term
Table 49: Mergers & Acquisitions, Expansions, Product Launch, etc. (1/2)
Table 50: Mergers & Acquisitions, Expansions, Product Launch, etc. (2/2)
List of Figures
Figure 1: Global Smart and Mobile Supply Chain Solutions Market Size (US$ Bn) Forecast, 2018–2031
Figure 2: Global Smart and Mobile Supply Chain Solutions Market Revenue (US$ Bn) Opportunity Assessment, by Region, 2022E
Figure 3: Top Segment Analysis of Smart and Mobile Supply Chain Solutions Market
Figure 4: Global Smart and Mobile Supply Chain Solutions Market Revenue (US$ Bn) Opportunity Assessment, by Region, 2031F
Figure 5: Global Smart and Mobile Supply Chain Solutions Market Attractiveness Assessment, by Solutions
Figure 6: Global Smart and Mobile Supply Chain Solutions Market Attractiveness Assessment, by Enterprise Size
Figure 7: Global Smart and Mobile Supply Chain Solutions Market Attractiveness Assessment, by End-user
Figure 8: Global Smart and Mobile Supply Chain Solutions Market Attractiveness Assessment, by Region
Figure 9: Global Smart and Mobile Supply Chain Solutions Market Revenue (US$ Bn) Historic Trends, 2016 - 2021
Figure 10: Global Smart and Mobile Supply Chain Solutions Market Revenue Opportunity (US$ Bn) Historic Trends, 2016 - 2021
Figure 11: Absolute Dollar Opportunity
Figure 12: Global Smart and Mobile Supply Chain Solutions Market Value Share Analysis, by Solutions, 2022
Figure 13: Global Smart and Mobile Supply Chain Solutions Market Value Share Analysis, by Solutions, 2031
Figure 14: Global Smart and Mobile Supply Chain Solutions Market Absolute Opportunity (US$ Bn), by Transportation Management Systems (TMS), 2022 – 2031
Figure 15: Global Smart and Mobile Supply Chain Solutions Market Absolute Opportunity (US$ Bn), by Warehouse Management Systems (WMS), 2022 – 2031
Figure 16: Global Smart and Mobile Supply Chain Solutions Market Absolute Opportunity (US$ Bn), by Sourcing and Procurement, 2022 – 2031
Figure 17: Global Smart and Mobile Supply Chain Solutions Market Absolute Opportunity (US$ Bn), by Supply Chain Planning (SCP), 2022 – 2031
Figure 18: Global Smart and Mobile Supply Chain Solutions Market Absolute Opportunity (US$ Bn), by Manufacturing Execution Systems (MES), 2022 – 2031
Figure 19: Global Smart and Mobile Supply Chain Solutions Market Value Share Analysis, by Enterprise Size, 2022
Figure 20: Global Smart and Mobile Supply Chain Solutions Market Value Share Analysis, by Enterprise Size, 2031
Figure 21: Global Smart and Mobile Supply Chain Solutions Market Absolute Opportunity (US$ Bn), by SMEs, 2022 – 2031
Figure 22: Global Smart and Mobile Supply Chain Solutions Market Absolute Opportunity (US$ Bn), by Large Enterprises, 2022 – 2031
Figure 23: Global Smart and Mobile Supply Chain Solutions Market Value Share Analysis, by End-user, 2022
Figure 24: Global Smart and Mobile Supply Chain Solutions Market Value Share Analysis, by End-user, 2031
Figure 25: Global Smart and Mobile Supply Chain Solutions Market Absolute Opportunity (US$ Bn), by Retail & Consumer Goods, 2022 – 2031
Figure 26: Global Smart and Mobile Supply Chain Solutions Market Absolute Opportunity (US$ Bn), by IT & Telecom, 2022 – 2031
Figure 27: Global Smart and Mobile Supply Chain Solutions Market Absolute Opportunity (US$ Bn), by Manufacturing, 2022 – 2031
Figure 28: Global Smart and Mobile Supply Chain Solutions Market Absolute Opportunity (US$ Bn), by Government, 2022 – 2031
Figure 29: Global Smart and Mobile Supply Chain Solutions Market Absolute Opportunity (US$ Bn), by Energy & Utilities, 2022 – 2031
Figure 30: Global Smart and Mobile Supply Chain Solutions Market Absolute Opportunity (US$ Bn), by Healthcare, 2022 – 2031
Figure 31: Global Smart and Mobile Supply Chain Solutions Market Absolute Opportunity (US$ Bn), by Transportation & Logistics, 2022 – 2031
Figure 32: Global Smart and Mobile Supply Chain Solutions Market Absolute Opportunity (US$ Bn), by Others, 2022 – 2031
Figure 33: Global Smart and Mobile Supply Chain Solutions Market Opportunity (US$ Bn), by Region
Figure 34: Global Smart and Mobile Supply Chain Solutions Market Opportunity Share (%), by Region, 2022–2031
Figure 35: Global Smart and Mobile Supply Chain Solutions Market Size (US$ Bn), by Region, 2022 & 2031
Figure 36: Global Smart and Mobile Supply Chain Solutions Market Value Share Analysis, by Region, 2022
Figure 37: Global Smart and Mobile Supply Chain Solutions Market Value Share Analysis, by Region, 2031
Figure 38: North America Smart and Mobile Supply Chain Solutions Market Absolute Opportunity (US$ Bn), 2022 – 2031
Figure 39: Europe Smart and Mobile Supply Chain Solutions Market Absolute Opportunity (US$ Bn), 2022 – 2031
Figure 40: Asia Pacific Smart and Mobile Supply Chain Solutions Market Absolute Opportunity (US$ Bn), 2022 – 2031
Figure 41: Middle East & Africa Smart and Mobile Supply Chain Solutions Market Absolute Opportunity (US$ Bn), 2022 – 2031
Figure 42: South America Smart and Mobile Supply Chain Solutions Market Absolute Opportunity (US$ Bn), 2022 – 2031
Figure 43: North America Absolute Dollar Opportunity
Figure 44: North America Smart and Mobile Supply Chain Solutions Market Revenue Opportunity Share, by Solutions
Figure 45: North America Smart and Mobile Supply Chain Solutions Market Revenue Opportunity Share, by Enterprise Size
Figure 46: North America Smart and Mobile Supply Chain Solutions Market Revenue Opportunity Share, by End-user
Figure 47: North America Smart and Mobile Supply Chain Solutions Market Revenue Opportunity Share, by Country
Figure 48: North America Smart and Mobile Supply Chain Solutions Market Value Share Analysis, by Solutions, 2022
Figure 49: North America Smart and Mobile Supply Chain Solutions Market Value Share Analysis, by Solutions, 2031
Figure 50: North America Smart and Mobile Supply Chain Solutions Market Absolute Opportunity (US$ Bn), by Transportation Management Systems (TMS), 2022 – 2031
Figure 51: North America Smart and Mobile Supply Chain Solutions Market Absolute Opportunity (US$ Bn), by Warehouse Management Systems (WMS), 2022 – 2031
Figure 52: North America Smart and Mobile Supply Chain Solutions Market Absolute Opportunity (US$ Bn), by Sourcing and Procurement, 2022 – 2031
Figure 53: North America Smart and Mobile Supply Chain Solutions Market Absolute Opportunity (US$ Bn), by Supply Chain Planning (SCP), 2022 – 2031
Figure 54: North America Smart and Mobile Supply Chain Solutions Market Absolute Opportunity (US$ Bn), by Manufacturing Execution Systems (MES), 2022 – 2031
Figure 55: North America Smart and Mobile Supply Chain Solutions Market Value Share Analysis, by Enterprise Size, 2022
Figure 56: North America Smart and Mobile Supply Chain Solutions Market Value Share Analysis, by Enterprise Size, 2031
Figure 57: North America Smart and Mobile Supply Chain Solutions Market Absolute Opportunity (US$ Bn), by SMEs, 2022 – 2031
Figure 58: North America Smart and Mobile Supply Chain Solutions Market Absolute Opportunity (US$ Bn), by Large Enterprises, 2022 – 2031
Figure 59: North America Smart and Mobile Supply Chain Solutions Market Value Share Analysis, by End-user, 2022
Figure 60: North America Smart and Mobile Supply Chain Solutions Market Value Share Analysis, by End-user, 2031
Figure 61: North America Smart and Mobile Supply Chain Solutions Market Absolute Opportunity (US$ Bn), by Retail & Consumer Goods, 2022 – 2031
Figure 62: North America Smart and Mobile Supply Chain Solutions Market Absolute Opportunity (US$ Bn), by IT & Telecom, 2022 – 2031
Figure 63: North America Smart and Mobile Supply Chain Solutions Market Absolute Opportunity (US$ Bn), by Manufacturing, 2022 – 2031
Figure 64: North America Smart and Mobile Supply Chain Solutions Market Absolute Opportunity (US$ Bn), by Government, 2022 – 2031
Figure 65: North America Smart and Mobile Supply Chain Solutions Market Absolute Opportunity (US$ Bn), by Energy & Utilities, 2022 – 2031
Figure 66: North America Smart and Mobile Supply Chain Solutions Market Absolute Opportunity (US$ Bn), by Healthcare, 2022 – 2031
Figure 67: North America Smart and Mobile Supply Chain Solutions Market Absolute Opportunity (US$ Bn), by Transportation & Logistics, 2022 – 2031
Figure 68: North America Smart and Mobile Supply Chain Solutions Market Absolute Opportunity (US$ Bn), by Others, 2022 – 2031
Figure 69: North America Smart and Mobile Supply Chain Solutions Market Value Share Analysis, by Country, 2022
Figure 70: North America Smart and Mobile Supply Chain Solutions Market Value Share Analysis, by Country, 2031
Figure 71: U.S. Smart and Mobile Supply Chain Solutions Market Opportunity Growth Analysis (US$ Bn) Forecast, 2022 – 2031
Figure 72: Canada Smart and Mobile Supply Chain Solutions Market Opportunity Growth Analysis (US$ Bn) Forecast, 2022 – 2031
Figure 73: Mexico Smart and Mobile Supply Chain Solutions Market Opportunity Growth Analysis (US$ Bn) Forecast, 2022 – 2031
Figure 74: Europe Absolute Dollar Opportunity
Figure 75: Europe Smart and Mobile Supply Chain Solutions Market Revenue Opportunity Share, by Solutions
Figure 76: Europe Smart and Mobile Supply Chain Solutions Market Revenue Opportunity Share, by Enterprise Size
Figure 77: Europe Smart and Mobile Supply Chain Solutions Market Revenue Opportunity Share, by End-user
Figure 78: Europe Smart and Mobile Supply Chain Solutions Market Revenue Opportunity Share, by Country
Figure 79: Europe Smart and Mobile Supply Chain Solutions Market Value Share Analysis, by Solutions, 2022
Figure 80: Europe Smart and Mobile Supply Chain Solutions Market Value Share Analysis, by Solutions, 2031
Figure 81: Europe Smart and Mobile Supply Chain Solutions Market Absolute Opportunity (US$ Bn), by Transportation Management Systems (TMS), 2022 – 2031
Figure 82: Europe Smart and Mobile Supply Chain Solutions Market Absolute Opportunity (US$ Bn), by Warehouse Management Systems (WMS), 2022 – 2031
Figure 83: Europe Smart and Mobile Supply Chain Solutions Market Absolute Opportunity (US$ Bn), by Sourcing and Procurement, 2022 – 2031
Figure 84: Europe Smart and Mobile Supply Chain Solutions Market Absolute Opportunity (US$ Bn), by Supply Chain Planning (SCP), 2022 – 2031
Figure 85: Europe Smart and Mobile Supply Chain Solutions Market Absolute Opportunity (US$ Bn), by Manufacturing Execution Systems (MES), 2022 – 2031
Figure 86: Europe Smart and Mobile Supply Chain Solutions Market Value Share Analysis, by Enterprise Size, 2022
Figure 87: Europe Smart and Mobile Supply Chain Solutions Market Value Share Analysis, by Enterprise Size, 2031
Figure 88: Europe Smart and Mobile Supply Chain Solutions Market Absolute Opportunity (US$ Bn), by SMEs, 2022 – 2031
Figure 89: Europe Smart and Mobile Supply Chain Solutions Market Absolute Opportunity (US$ Bn), by Large Enterprises, 2022 – 2031
Figure 90: Europe Smart and Mobile Supply Chain Solutions Market Value Share Analysis, by End-user, 2022
Figure 91: Europe Smart and Mobile Supply Chain Solutions Market Value Share Analysis, by End-user, 2031
Figure 92: Europe Smart and Mobile Supply Chain Solutions Market Absolute Opportunity (US$ Bn), by Retail & Consumer Goods, 2022 – 2031
Figure 93: Europe Smart and Mobile Supply Chain Solutions Market Absolute Opportunity (US$ Bn), by IT & Telecom, 2022 – 2031
Figure 94: Europe Smart and Mobile Supply Chain Solutions Market Absolute Opportunity (US$ Bn), by Manufacturing, 2022 – 2031
Figure 95: Europe Smart and Mobile Supply Chain Solutions Market Absolute Opportunity (US$ Bn), by Government, 2022 – 2031
Figure 96: Europe Smart and Mobile Supply Chain Solutions Market Absolute Opportunity (US$ Bn), by Energy & Utilities, 2022 – 2031
Figure 97: Europe Smart and Mobile Supply Chain Solutions Market Absolute Opportunity (US$ Bn), by Healthcare, 2022 – 2031
Figure 98: Europe Smart and Mobile Supply Chain Solutions Market Absolute Opportunity (US$ Bn), by Transportation & Logistics, 2022 – 2031
Figure 99: Europe Smart and Mobile Supply Chain Solutions Market Absolute Opportunity (US$ Bn), by Others, 2022 – 2031
Figure 100: Europe Smart and Mobile Supply Chain Solutions Market Value Share Analysis, by Country, 2022
Figure 101: Europe Smart and Mobile Supply Chain Solutions Market Value Share Analysis, by Country, 2031
Figure 102: Germany Smart and Mobile Supply Chain Solutions Market Opportunity Growth Analysis (US$ Bn) Forecast, 2022 – 2031
Figure 103: U.K. Smart and Mobile Supply Chain Solutions Market Opportunity Growth Analysis (US$ Bn) Forecast, 2022 – 2031
Figure 104: France Smart and Mobile Supply Chain Solutions Market Opportunity Growth Analysis (US$ Bn) Forecast, 2022 – 2031
Figure 105: Spain Smart and Mobile Supply Chain Solutions Market Opportunity Growth Analysis (US$ Bn) Forecast, 2022 – 2031
Figure 106: Italy Smart and Mobile Supply Chain Solutions Market Opportunity Growth Analysis (US$ Bn) Forecast, 2022 – 2031
Figure 107: Asia Pacific Absolute Dollar Opportunity
Figure 108: Asia Pacific Smart and Mobile Supply Chain Solutions Market Revenue Opportunity Share, by Solutions
Figure 109: Asia Pacific Smart and Mobile Supply Chain Solutions Market Revenue Opportunity Share, by Enterprise Size
Figure 110: Asia Pacific Smart and Mobile Supply Chain Solutions Market Revenue Opportunity Share, by End-user
Figure 111: Asia Pacific Smart and Mobile Supply Chain Solutions Market Revenue Opportunity Share, by Country
Figure 112: Asia Pacific Smart and Mobile Supply Chain Solutions Market Value Share Analysis, by Solutions, 2022
Figure 113: Asia Pacific Smart and Mobile Supply Chain Solutions Market Value Share Analysis, by Solutions, 2031
Figure 114: Asia Pacific Smart and Mobile Supply Chain Solutions Market Absolute Opportunity (US$ Bn), by Transportation Management Systems (TMS), 2022 – 2031
Figure 115: Asia Pacific Smart and Mobile Supply Chain Solutions Market Absolute Opportunity (US$ Bn), by Warehouse Management Systems (WMS), 2022 – 2031
Figure 116: Asia Pacific Smart and Mobile Supply Chain Solutions Market Absolute Opportunity (US$ Bn), by Sourcing and Procurement, 2022 – 2031
Figure 117: Asia Pacific Smart and Mobile Supply Chain Solutions Market Absolute Opportunity (US$ Bn), by Supply Chain Planning (SCP), 2022 – 2031
Figure 118: Asia Pacific Smart and Mobile Supply Chain Solutions Market Absolute Opportunity (US$ Bn), by Manufacturing Execution Systems (MES), 2022 – 2031
Figure 119: Asia Pacific Smart and Mobile Supply Chain Solutions Market Value Share Analysis, by Enterprise Size, 2022
Figure 120: Asia Pacific Smart and Mobile Supply Chain Solutions Market Value Share Analysis, by Enterprise Size, 2031
Figure 121: Asia Pacific Smart and Mobile Supply Chain Solutions Market Absolute Opportunity (US$ Bn), by SMEs, 2022 – 2031
Figure 122: Asia Pacific Smart and Mobile Supply Chain Solutions Market Absolute Opportunity (US$ Bn), by Large Enterprises, 2022 – 2031
Figure 123: Asia Pacific Smart and Mobile Supply Chain Solutions Market Value Share Analysis, by End-user, 2022
Figure 124: Asia Pacific Smart and Mobile Supply Chain Solutions Market Value Share Analysis, by End-user, 2031
Figure 125: Asia Pacific Smart and Mobile Supply Chain Solutions Market Absolute Opportunity (US$ Bn), by Retail & Consumer Goods, 2022 – 2031
Figure 126: Asia Pacific Smart and Mobile Supply Chain Solutions Market Absolute Opportunity (US$ Bn), by IT & Telecom, 2022 – 2031
Figure 127: Asia Pacific Smart and Mobile Supply Chain Solutions Market Absolute Opportunity (US$ Bn), by Manufacturing, 2022 – 2031
Figure 128: Asia Pacific Smart and Mobile Supply Chain Solutions Market Absolute Opportunity (US$ Bn), by Government, 2022 – 2031
Figure 129: Asia Pacific Smart and Mobile Supply Chain Solutions Market Absolute Opportunity (US$ Bn), by Energy & Utilities, 2022 – 2031
Figure 130: Asia Pacific Smart and Mobile Supply Chain Solutions Market Absolute Opportunity (US$ Bn), by Healthcare, 2022 – 2031
Figure 131: Asia Pacific Smart and Mobile Supply Chain Solutions Market Absolute Opportunity (US$ Bn), by Transportation & Logistics, 2022 – 2031
Figure 132: Asia Pacific Smart and Mobile Supply Chain Solutions Market Absolute Opportunity (US$ Bn), by Others, 2022 – 2031
Figure 133: Asia Pacific Smart and Mobile Supply Chain Solutions Market Value Share Analysis, by Country, 2022
Figure 134: Asia Pacific Smart and Mobile Supply Chain Solutions Market Value Share Analysis, by Country, 2031
Figure 135: China Smart and Mobile Supply Chain Solutions Market Opportunity Growth Analysis (US$ Bn) Forecast, 2022 – 2031
Figure 136: India Smart and Mobile Supply Chain Solutions Market Opportunity Growth Analysis (US$ Bn) Forecast, 2022 – 2031
Figure 137: Japan Smart and Mobile Supply Chain Solutions Market Opportunity Growth Analysis (US$ Bn) Forecast, 2022 – 2031
Figure 138: ASEAN Smart and Mobile Supply Chain Solutions Market Opportunity Growth Analysis (US$ Bn) Forecast, 2022 – 2031
Figure 139: Middle East & Africa Absolute Dollar Opportunity
Figure 140: Middle East & Africa Smart and Mobile Supply Chain Solutions Market Revenue Opportunity Share, by Solutions
Figure 141: Middle East & Africa Smart and Mobile Supply Chain Solutions Market Revenue Opportunity Share, by Enterprise Size
Figure 142: Middle East & Africa Smart and Mobile Supply Chain Solutions Market Revenue Opportunity Share, by End-user
Figure 143: Middle East & Africa Smart and Mobile Supply Chain Solutions Market Revenue Opportunity Share, by Country
Figure 144: Middle East & Africa Smart and Mobile Supply Chain Solutions Market Value Share Analysis, by Solutions, 2022
Figure 145: Middle East & Africa Smart and Mobile Supply Chain Solutions Market Value Share Analysis, by Solutions, 2031
Figure 146: Middle East & Africa Smart and Mobile Supply Chain Solutions Market Absolute Opportunity (US$ Bn), by Transportation Management Systems (TMS), 2022 – 2031
Figure 147: Middle East & Africa Smart and Mobile Supply Chain Solutions Market Absolute Opportunity (US$ Bn), by Warehouse Management Systems (WMS), 2022 – 2031
Figure 148: Middle East & Africa Smart and Mobile Supply Chain Solutions Market Absolute Opportunity (US$ Bn), by Sourcing and Procurement, 2022 – 2031
Figure 149: Middle East & Africa Smart and Mobile Supply Chain Solutions Market Absolute Opportunity (US$ Bn), by Supply Chain Planning (SCP), 2022 – 2031
Figure 150: Middle East & Africa Smart and Mobile Supply Chain Solutions Market Absolute Opportunity (US$ Bn), by Manufacturing Execution Systems (MES), 2022 – 2031
Figure 151: Middle East & Africa Smart and Mobile Supply Chain Solutions Market Value Share Analysis, by Enterprise Size, 2022
Figure 152: Middle East & Africa Smart and Mobile Supply Chain Solutions Market Value Share Analysis, by Enterprise Size, 2031
Figure 153: Middle East & Africa Smart and Mobile Supply Chain Solutions Market Absolute Opportunity (US$ Bn), by SMEs, 2022 – 2031
Figure 154: Middle East & Africa Smart and Mobile Supply Chain Solutions Market Absolute Opportunity (US$ Bn), by Large Enterprises, 2022 – 2031
Figure 155: North Middle East & Africa Smart and Mobile Supply Chain Solutions Market Value Share Analysis, by End-user, 2022
Figure 156: Middle East & Africa Smart and Mobile Supply Chain Solutions Market Value Share Analysis, by End-user, 2031
Figure 157: Middle East & Africa Smart and Mobile Supply Chain Solutions Market Absolute Opportunity (US$ Bn), by Retail & Consumer Goods, 2022 – 2031
Figure 158: Middle East & Africa Smart and Mobile Supply Chain Solutions Market Absolute Opportunity (US$ Bn), by IT & Telecom, 2022 – 2031
Figure 159: Middle East & Africa Smart and Mobile Supply Chain Solutions Market Absolute Opportunity (US$ Bn), by Manufacturing, 2022 – 2031
Figure 160: Middle East & Africa Smart and Mobile Supply Chain Solutions Market Absolute Opportunity (US$ Bn), by Government, 2022 – 2031
Figure 161: Middle East & Africa Smart and Mobile Supply Chain Solutions Market Absolute Opportunity (US$ Bn), by Energy & Utilities, 2022 – 2031
Figure 162: Middle East & Africa Smart and Mobile Supply Chain Solutions Market Absolute Opportunity (US$ Bn), by Healthcare, 2022 – 2031
Figure 163: Middle East & Africa Smart and Mobile Supply Chain Solutions Market Absolute Opportunity (US$ Bn), by Transportation & Logistics, 2022 – 2031
Figure 164: Middle East & Africa Smart and Mobile Supply Chain Solutions Market Absolute Opportunity (US$ Bn), by Others, 2022 – 2031
Figure 165: Middle East & Africa Smart and Mobile Supply Chain Solutions Market Value Share Analysis, by Country, 2022
Figure 166: Middle East & Africa Smart and Mobile Supply Chain Solutions Market Value Share Analysis, by Country, 2031
Figure 167: Saudi Arabia Smart and Mobile Supply Chain Solutions Market Opportunity Growth Analysis (US$ Bn) Forecast, 2022 – 2031
Figure 168: United Arab Emirates Smart and Mobile Supply Chain Solutions Market Opportunity Growth Analysis (US$ Bn) Forecast, 2022 – 2031
Figure 169: South Africa Smart and Mobile Supply Chain Solutions Market Opportunity Growth Analysis (US$ Bn) Forecast, 2022 – 2031
Figure 170: South America Absolute Dollar Opportunity
Figure 171: South America Smart and Mobile Supply Chain Solutions Market Revenue Opportunity Share, by Solutions
Figure 172: South America Smart and Mobile Supply Chain Solutions Market Revenue Opportunity Share, by Enterprise Size
Figure 173: South America Smart and Mobile Supply Chain Solutions Market Revenue Opportunity Share, by End-user
Figure 174: South America Smart and Mobile Supply Chain Solutions Market Revenue Opportunity Share, by Country
Figure 175: South America Smart and Mobile Supply Chain Solutions Market Value Share Analysis, by Solutions, 2022
Figure 176: South America Smart and Mobile Supply Chain Solutions Market Value Share Analysis, by Solutions, 2031
Figure 177: South America Smart and Mobile Supply Chain Solutions Market Absolute Opportunity (US$ Bn), by Transportation Management Systems (TMS), 2022 – 2031
Figure 178: South America Smart and Mobile Supply Chain Solutions Market Absolute Opportunity (US$ Bn), by Warehouse Management Systems (WMS), 2022 – 2031
Figure 179: South America Smart and Mobile Supply Chain Solutions Market Absolute Opportunity (US$ Bn), by Sourcing and Procurement, 2022 – 2031
Figure 180: South America Smart and Mobile Supply Chain Solutions Market Absolute Opportunity (US$ Bn), by Supply Chain Planning (SCP), 2022 – 2031
Figure 181: South America Smart and Mobile Supply Chain Solutions Market Absolute Opportunity (US$ Bn), by Manufacturing Execution Systems (MES), 2022 – 2031
Figure 182: South America Smart and Mobile Supply Chain Solutions Market Value Share Analysis, by Enterprise Size, 2022
Figure 183: South America Smart and Mobile Supply Chain Solutions Market Value Share Analysis, by Enterprise Size, 2031
Figure 184: South America Smart and Mobile Supply Chain Solutions Market Absolute Opportunity (US$ Bn), by SMEs, 2022 – 2031
Figure 185: South America Smart and Mobile Supply Chain Solutions Market Absolute Opportunity (US$ Bn), by Large Enterprises, 2022 – 2031
Figure 186: South America Smart and Mobile Supply Chain Solutions Market Value Share Analysis, by End-user, 2022
Figure 187: South America Smart and Mobile Supply Chain Solutions Market Value Share Analysis, by End-user, 2031
Figure 188: South America Smart and Mobile Supply Chain Solutions Market Absolute Opportunity (US$ Bn), by Retail & Consumer Goods, 2022 – 2031
Figure 189: South America Smart and Mobile Supply Chain Solutions Market Absolute Opportunity (US$ Bn), by IT & Telecom, 2022 – 2031
Figure 190: South America Smart and Mobile Supply Chain Solutions Market Absolute Opportunity (US$ Bn), by Manufacturing, 2022 – 2031
Figure 191: South America Smart and Mobile Supply Chain Solutions Market Absolute Opportunity (US$ Bn), by Government, 2022 – 2031
Figure 192: South America Smart and Mobile Supply Chain Solutions Market Absolute Opportunity (US$ Bn), by Energy & Utilities, 2022 – 2031
Figure 193: South America Smart and Mobile Supply Chain Solutions Market Absolute Opportunity (US$ Bn), by Healthcare, 2022 – 2031
Figure 194: South America Smart and Mobile Supply Chain Solutions Market Absolute Opportunity (US$ Bn), by Transportation & Logistics, 2022 – 2031
Figure 195: South America Smart and Mobile Supply Chain Solutions Market Absolute Opportunity (US$ Bn), by Others, 2022 – 2031
Figure 196: South America Smart and Mobile Supply Chain Solutions Market Value Share Analysis, by Country, 2022
Figure 197: South America Smart and Mobile Supply Chain Solutions Market Value Share Analysis, by Country, 2031
Figure 198: Brazil Smart and Mobile Supply Chain Solutions Market Opportunity Growth Analysis (US$ Bn) Forecast, 2022 – 2031
Figure 199: Argentina Smart and Mobile Supply Chain Solutions Market Opportunity Growth Analysis (US$ Bn) Forecast, 2022 – 2031
Copyright © Transparency Market Research, Inc. All Rights reserved
Trust Online

Smart and Mobile Supply Chain Solutions Market