
Reports
Reports
Analysts’ Viewpoint on SLS, SLES, and LAS Market Scenario
Rise in demand for anionic surfactants is likely to provide lucrative opportunities for manufacturers of SLS, SLES, and LAS. Sodium Lauryl Sulfate (SLS), Sodium Lauryl Ether Sulfate (SLES), and Linear Alkylbenzene Sulfonate (LAS) are major types of anionic surfactants used in personal care products. Surfactants with high biodegradability, strong detergency, and good solubility are preferred in various end-use industries such as personal care, oil & gas, construction, agriculture, and food processing. Key players are launching new products to increase their market share in the home care products sector.
Sodium Laureth Sulfate (SLS) is a highly effective surfactant employed in applications that require the elimination of oily stains and residues. SLS, in high concentration, is used in engine degreasers and industrial floor cleaners. In low concentration, it is utilized in personal care products such as soaps, bubble baths, toothpastes, and shower gels.
SLES is a high-foaming anionic surfactant that exerts emulsifying action, thereby removing oil and soil from the hair and skin. Sodium lauryl ether sulfate is used in shampoos, shower gels, face wash, and other personal care products. SLES is considered less irritant than SLS, as it is manufactured by the ethoxylation of SLS. It is a higher-foaming variation of SLS; therefore, it is largely employed in the manufacture of detergents and personal care products.
Linear Alkylbenzene Sulfonate (LAS) is an anionic surfactant that consists of a hydrophilic sulfonate head-group and hydrophobic alkylbenzene tail-group. Linear alkylbenzene is a key raw material required in the production of LAS. It is manufactured through the alkylation of benzene with n-paraffins in the presence of hydrogen fluoride or aluminum chloride as a catalyst. Physical and chemical properties of LAS vary in accordance with the alkyl chain length, resulting in formulations for usage in various household applications such as laundry powders, liquid detergents, and dishwashing liquids. LAS is also employed in industrial applications such as emulsification and wetting agents.
Surfactants are surface active agents that are used as foaming agents, dispersants, emulsifiers, solubilizing agents, cleansers, and conditioners in various laundry care and personal care products. Anionic surfactants are one the most consumed surface active agents in household detergents, personal care products, and industrial & institutional cleaners, as they possess high pH, and are easy to formulate and less expensive.
China is the leading consumer of anionic surfactants in Asia Pacific, led by the rise in awareness about hygiene products and increase in demand for liquid soaps in the country. Rapid industrialization is prompting surfactant manufacturers in China to boost their production capacity.
Other emerging economies in Asia Pacific such as India, Vietnam, and Indonesia are also exhibiting positive trends in the consumption of anionic surfactants. Low manufacturing and labor costs, and tax rate cuts on detergent manufacturing are encouraging industry players to shift their production base to emerging economies in order to achieve economies of scale. In November 2018, the Government of India slashed the Goods and Service Tax (GST) applicable to detergents and other mass consumption goods from 28% to 18%. This is expected to encourage domestic players in the detergent industry to increase their production capacity.
LAS is widely used in the manufacture of household detergents, as it helps remove stains from fabrics by reducing the surface tension of water. It is also used in manual dishwashing liquids, soap bars, and detergent tablets. Rapid expansion in the global food & beverages industry is anticipated to boost the demand for dishwashing liquids, thereby fueling the global market size.
SLS is used as a food additive to make marshmallows fluffier. Dishwashing liquids and other hygiene chemicals aid in maintaining health and safety standards in the food & beverages industry.
Sodium Lauryl Sulfate (SLS) is an anionic surfactant naturally derived from coconut and/or palm kernel oil. It lowers the surface tension of aqueous solutions. SLS is used as a fat emulsifier, wetting agent, and surfactant in various cosmetic products and industrial cleaners. Currently, SLS is being replaced by its ethoxylated derivative SLES, as the latter is inexpensive and offers excellent cleaning, emulsifying, wetting, solubilizing, and foaming properties.
SLES is widely employed in liquid detergents and personal care products due to its high solvency, wide compatibility, strong resistance to hard water, high biodegradation, and low irritation to skin and eyes. It is gentler on hair and skin. Adoption of SLES in bergamot oil, orange seed oil, and fruit extracts helps provide soft, smooth, and nourished skin and hair. SLES is also employed as a lubricant, dyeing agent, cleanser, foaming agent, and degreasing agent in printing & dyeing, petroleum, and leather industries. Thus, surge in usage of SLES and LAS in household and personal care products is driving the SLS, SLES, and LAS industry size.
Anionic surfactants such as SLS, SLES, and LAS effectively reduce the surface tension of water. They are used as emulsifiers in aqueous emulsion polymerization, a process employed to produce polymer dispersions such as copolymers and homopolymers of styrene and vinyl acetate and plastics such as PVC and synthetic rubber.
SLS, SLES, and LAS exhibit excellent stabilization properties in emulsion polymerization manufacturing processes of acrylic, vinylic, styrene-acrylic, vinyl acrylic, and other polymer resin systems. They also help improve product performance in terms of appearance, mechanical resistance, and storage stability.
SLS, SLES, and LAS prevent coagulation due to electrostatic repulsions. They reduce the particle size and enhance mechanical, electrolyte, freeze-thaw, and thermal stabilities when combined with non-ionic surfactants. Increase in usage of waterborne coating technology in water-based paints, coatings, and adhesives industries is anticipated to fuel the demand for emulsion polymers in China and developing countries in Southeast Asia. Waterborne coatings are projected to replace solvent-borne formulations in the next few years.
The LAS segment held major share of 76.1% of the global market in 2021. It is estimated to dominate the market during the forecast period. LAS is one of the widely used anionic surfactants in detergents and other cleaning products, as it is highly efficient and versatile. It also has low environmental impact. SLES and SLS segments are anticipated to grow at a steady pace during the forecast period.
According to the latest trends in the SLS, SLES, and LAS industry, the detergents & cleaners segment held major share of 70.1% of the global market in 2021. Availability of a wide range of detergents and cleaners is a key factor propelling the segment. Oilfield chemicals and personal care segments are likely to grow at a steady pace during the forecast period.
Asia Pacific accounted for prominent share of 44.2% of the global market in 2021. It is expected to dominate the market during the forecast period. China is a key country of the market in Asia Pacific. Rise in demand for detergents & cleaners and personal care products, expansion in end-use industries, and increase in usage of washing machines are driving the demand for SLS, SLES, and LAS in the region. Europe also held significant share of the global market in 2021.
The global market is consolidated, with a small number of large-scale vendors controlling majority of the share. Most of the firms are investing significantly in comprehensive R&D activities to expand their product portfolio. Huntsman International LLC, Kao Corporation, BASF SE, Clariant AG, Lion Specialty Chemicals Co., Ltd., Nouryon, Stepan Company, Taiwan NJC Corporation, Godrej Industries Limited, Henkel AG & Co. KGaA, Evonik Industries AG, Solvay, Galaxy Surfactants Ltd., Dow, Oxiteno, and AK ChemTech Co., Ltd. are the leading players in the global market.
Each of these players has been profiled in the market report based on parameters such as company overview, financial overview, business strategies, product portfolio, business segments, and recent developments.
|
Attribute |
Detail |
|
Market Size Value in 2021 |
US$ 10.2 Bn |
|
Market Forecast Value in 2031 |
US$ 15.7 Bn |
|
Growth Rate (CAGR) |
4.4% |
|
Forecast Period |
2022–2031 |
|
Historical Data Available for |
2020 |
|
Quantitative Units |
US$ Bn for Value and Kilo Tons for Volume |
|
Market Analysis |
It includes cross segment analysis at global as well as regional level. Furthermore, qualitative analysis includes drivers, restraints, opportunities, key trends, Porter’s Five Forces analysis, value chain analysis, and key trend analysis. |
|
Competition Landscape |
|
|
Format |
Electronic (PDF) + Excel |
|
Market Segmentation |
|
|
Regions Covered |
|
|
Countries Covered |
|
|
Companies Profiled |
|
|
Customization Scope |
Available upon request |
|
Pricing |
Available upon request |
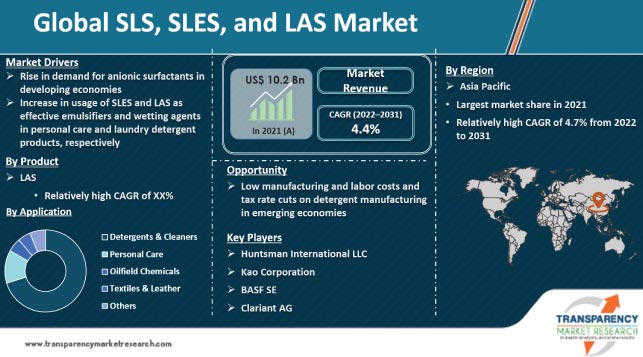
The global market stood at US$ 10.2 Bn in 2021
The market is expected to grow at a CAGR of 4.4% from 2022 to 2031
Rise in demand for anionic surfactants in developing economies and surge in adoption of SLES and LAS in personal care and laundry detergent products
The LAS segment accounted for 76.1% share of the worldwide market in 2021
Asia Pacific is a more attractive region for vendors in the global market for SLS, SLES, and LAS
Huntsman International LLC, Kao Corporation, BASF SE, Clariant AG, Lion Specialty Chemicals Co., Ltd., Nouryon, Stepan Company, Taiwan NJC Corporation, Godrej Industries Limited, Henkel AG & Co. KGaA, Evonik Industries AG, Solvay, Galaxy Surfactants Ltd., Dow, Oxiteno, and AK ChemTech Co., Ltd.
1. Executive Summary
1.1. Global Market Outlook
1.2. Demand Side Trends
1.3. Key Facts and Figures
1.4. Trends Impacting Market
1.5. TMR’s Growth Opportunity Wheel
2. Market Overview
2.1. Market Segmentation
2.2. Market Trends
2.3. Market Dynamics
2.3.1. Drivers
2.3.2. Restraints
2.3.3. Opportunities
2.4. Porter’s Five Forces Analysis
2.5. Regulatory Analysis
2.6. Value Chain Analysis
2.6.1. List of SLS, SLES, and LAS Manufacturers
2.6.2. List of Dealers/Distributors
2.6.3. List of Potential Customers
2.7. Cost Structure Analysis
3. COVID-19 Impact Analysis
3.1. Impact on the Supply Chain of SLS, SLES, and LAS Sector
3.2. Impact on SLS, SLES, and LAS Market – Pre & Post Crisis
4. Production Output Analysis, 2020
5. Price Trend Analysis
6. Global SLS, SLES, and LAS Market Analysis and Forecast, by Product, 2020–2031
6.1. Introduction and Definitions
6.2. Global SLS, SLES, and LAS Market Volume (Kilo Tons) and Value (US$ Bn) Forecast, by Product, 2020–2031
6.3. SLS
6.3.1. SLS Dry
6.3.2. SLS Liquid
6.4. SLES
6.5. LAS
7. Global SLS, SLES, and LAS Market Attractiveness, by Product
8. Global SLS, SLES, and LAS Market Analysis and Forecast, by Application, 2020–2031
8.1. Introduction and Definitions
8.2. Global SLS, SLES, and LAS Market Volume (Kilo Tons) and Value (US$ Bn) Forecast, by Application, 2020–2031
8.2.1. Detergents & Cleaners
8.2.2. Personal Care
8.2.3. Oilfield Chemicals
8.2.4. Textiles & Leather
8.2.5. Others
8.3. Global SLS, SLES, and LAS Market Attractiveness, by Application
9. Global SLS, SLES, and LAS Market Analysis and Forecast, by Region, 2020–2031
9.1. Key Findings
9.2. Global SLS, SLES, and LAS Market Volume (Kilo Tons) and Value (US$ Bn) Forecast, by Region, 2020–2031
9.2.1. North America
9.2.2. Europe
9.2.3. Asia Pacific
9.2.4. Middle East & Africa
9.2.5. Latin America
9.3. Global SLS, SLES, and LAS Market Attractiveness, by Region
10. North America SLS, SLES, and LAS Market Analysis and Forecast, 2020–2031
10.1. Key Findings
10.2. North America SLS, SLES, and LAS Market Volume (Kilo Tons) and Value (US$ Bn) Forecast, by Product, 2020–2031
10.3. North America SLS, SLES, and LAS Market Volume (Kilo Tons) and Value (US$ Bn) Forecast, by Application, 2020–2031
10.4. North America SLS, SLES, and LAS Market Volume (Kilo Tons) and Value (US$ Bn) Forecast, by Country, 2020–2031
10.4.1. U.S. SLS, SLES, and LAS Market Volume (Kilo Tons) and Value (US$ Bn) Forecast, by Product, 2020–2031
10.4.2. U.S. SLS, SLES, and LAS Market Volume (Kilo Tons) and Value (US$ Bn) Forecast, by Application, 2020–2031
10.4.3. Canada SLS, SLES, and LAS Market Volume (Kilo Tons) and Value (US$ Bn) Forecast, by Product, 2020–2031
10.4.4. Canada SLS, SLES, and LAS Market Volume (Kilo Tons) and Value (US$ Bn) Forecast, by Application, 2020–2031
10.5. North America SLS, SLES, and LAS Market Attractiveness Analysis
11. Europe SLS, SLES, and LAS Market Analysis and Forecast, 2020–2031
11.1. Key Findings
11.2. Europe SLS, SLES, and LAS Market Volume (Kilo Tons) and Value (US$ Bn) Forecast, by Product, 2020–2031
11.3. Europe SLS, SLES, and LAS Market Volume (Kilo Tons) and Value (US$ Bn) Forecast, by Application, 2020–2031
11.4. Europe SLS, SLES, and LAS Market Volume (Kilo Tons) and Value (US$ Bn) Forecast, by Country and Sub-region, 2020-2031
11.4.1. Germany SLS, SLES, and LAS Market Volume (Kilo Tons) and Value (US$ Bn) Forecast, by Product, 2020–2031
11.4.2. Germany SLS, SLES, and LAS Market Volume (Kilo Tons) and Value (US$ Bn) Forecast, by Application, 2020–2031
11.4.3. France SLS, SLES, and LAS Market Volume (Kilo Tons) and Value (US$ Bn) Forecast, by Product, 2020–2031
11.4.4. France SLS, SLES, and LAS Market Volume (Kilo Tons) and Value (US$ Bn) Forecast, by Application, 2020–2031
11.4.5. U.K. SLS, SLES, and LAS Market Volume (Kilo Tons) and Value (US$ Bn) Forecast, by Product, 2020–2031
11.4.6. U.K. SLS, SLES, and LAS Market Volume (Kilo Tons) and Value (US$ Bn) Forecast, by Application, 2020–2031
11.4.7. Italy SLS, SLES, and LAS Market Volume (Kilo Tons) and Value (US$ Bn) Forecast, by Product, 2020–2031
11.4.8. Italy SLS, SLES, and LAS Market Volume (Kilo Tons) and Value (US$ Bn) Forecast, by Application, 2020–2031
11.4.9. Spain SLS, SLES, and LAS Market Volume (Kilo Tons) and Value (US$ Bn) Forecast, by Product, 2020–2031
11.4.10. Spain SLS, SLES, and LAS Market Volume (Kilo Tons) and Value (US$ Bn) Forecast, by Application, 2020–2031
11.4.11. Russia & CIS SLS, SLES, and LAS Market Volume (Kilo Tons) and Value (US$ Bn) Forecast, by Product, 2020–2031
11.4.12. Russia & CIS SLS, SLES, and LAS Market Volume (Kilo Tons) and Value (US$ Bn) Forecast, by Application, 2020–2031
11.4.13. Rest of Europe SLS, SLES, and LAS Market Volume (Kilo Tons) and Value (US$ Bn) Forecast, by Product, 2020–2031
11.4.14. Rest of Europe SLS, SLES, and LAS Market Volume (Kilo Tons) and Value (US$ Bn) Forecast, by Application, 2020–2031
11.5. Europe SLS, SLES, and LAS Market Attractiveness Analysis
12. Asia Pacific SLS, SLES, and LAS Market Analysis and Forecast, 2020–2031
12.1. Key Findings
12.2. Asia Pacific SLS, SLES, and LAS Market Volume (Kilo Tons) and Value (US$ Bn) Forecast, by Product, 2020–2031
12.3. Asia Pacific SLS, SLES, and LAS Market Volume (Kilo Tons) and Value (US$ Bn) Forecast, by Application, 2020–2031
12.4. Asia Pacific SLS, SLES, and LAS Market Volume (Kilo Tons) and Value (US$ Bn) Forecast, by Country and Sub-region, 2020-2031
12.4.1. China SLS, SLES, and LAS Market Volume (Kilo Tons) and Value (US$ Bn) Forecast, by Product, 2020–2031
12.4.2. China SLS, SLES, and LAS Market Volume (Kilo Tons) and Value (US$ Bn) Forecast, by Application, 2020–2031
12.4.3. Japan SLS, SLES, and LAS Market Volume (Kilo Tons) and Value (US$ Bn) Forecast, by Product, 2020–2031
12.4.4. Japan SLS, SLES, and LAS Market Volume (Kilo Tons) and Value (US$ Bn) Forecast, by Application, 2020–2031
12.4.5. India SLS, SLES, and LAS Market Volume (Kilo Tons) and Value (US$ Bn) Forecast, by Product, 2020–2031
12.4.6. India SLS, SLES, and LAS Market Volume (Kilo Tons) and Value (US$ Bn) Forecast, by Application, 2020–2031
12.4.7. South Korea SLS, SLES, and LAS Market Volume (Kilo Tons) and Value (US$ Bn) Forecast, by Product, 2020–2031
12.4.8. South Korea SLS, SLES, and LAS Market Volume (Kilo Tons) and Value (US$ Bn) Forecast, by Application, 2020–2031
12.4.9. Australia SLS, SLES, and LAS Market Volume (Kilo Tons) and Value (US$ Bn) Forecast, by Product, 2020–2031
12.4.10. Australia SLS, SLES, and LAS Market Volume (Kilo Tons) and Value (US$ Bn) Forecast, by Application, 2020–2031
12.4.11. ASEAN SLS, SLES, and LAS Market Volume (Kilo Tons) and Value (US$ Bn) Forecast, by Product, 2020–2031
12.4.12. ASEAN SLS, SLES, and LAS Market Volume (Kilo Tons) and Value (US$ Bn) Forecast, by Application, 2020–2031
12.4.13. Rest of Asia Pacific SLS, SLES, and LAS Market Volume (Kilo Tons) and Value (US$ Bn) Forecast, by Product, 2020–2031
12.4.14. Rest of Asia Pacific SLS, SLES, and LAS Market Volume (Kilo Tons) and Value (US$ Bn) Forecast, by Application, 2020–2031
12.5. Asia Pacific SLS, SLES, and LAS Market Attractiveness Analysis
13. Latin America SLS, SLES, and LAS Market Analysis and Forecast, 2020–2031
13.1. Key Findings
13.2. Latin America SLS, SLES, and LAS Market Volume (Kilo Tons) and Value (US$ Bn) Forecast, by Product, 2020–2031
13.3. Latin America SLS, SLES, and LAS Market Volume (Kilo Tons) and Value (US$ Bn) Forecast, by Application, 2020–2031
13.4. Latin America SLS, SLES, and LAS Market Volume (Kilo Tons) and Value (US$ Bn) Forecast, by Country and Sub-region, 2020-2031
13.4.1. Brazil SLS, SLES, and LAS Market Volume (Kilo Tons) and Value (US$ Bn) Forecast, by Product, 2020–2031
13.4.2. Brazil SLS, SLES, and LAS Market Volume (Kilo Tons) and Value (US$ Bn) Forecast, by Application, 2020–2031
13.4.3. Mexico SLS, SLES, and LAS Market Volume (Kilo Tons) and Value (US$ Bn) Forecast, by Product, 2020–2031
13.4.4. Mexico SLS, SLES, and LAS Market Volume (Kilo Tons) and Value (US$ Bn) Forecast, by Application, 2020–2031
13.4.5. Rest of Latin America SLS, SLES, and LAS Market Volume (Kilo Tons) and Value (US$ Bn) Forecast, by Product, 2020–2031
13.4.6. Rest of Latin America SLS, SLES, and LAS Market Volume (Kilo Tons) and Value (US$ Bn) Forecast, by Application, 2020–2031
13.5. Latin America SLS, SLES, and LAS Market Attractiveness Analysis
14. Middle East & Africa SLS, SLES, and LAS Market Analysis and Forecast, 2020–2031
14.1. Key Findings
14.2. Middle East & Africa SLS, SLES, and LAS Market Volume (Kilo Tons) and Value (US$ Bn) Forecast, by Product, 2020–2031
14.3. Middle East & Africa SLS, SLES, and LAS Market Volume (Kilo Tons) and Value (US$ Bn) Forecast, by Application, 2020–2031
14.4. Middle East & Africa SLS, SLES, and LAS Market Volume (Kilo Tons) and Value (US$ Bn) Forecast, by Country and Sub-region, 2020-2031
14.4.1. GCC SLS, SLES, and LAS Market Volume (Kilo Tons) and Value (US$ Bn) Forecast, by Product, 2020–2031
14.4.2. GCC SLS, SLES, and LAS Market Volume (Kilo Tons) and Value (US$ Bn) Forecast, by Application, 2020–2031
14.4.3. South Africa SLS, SLES, and LAS Market Volume (Kilo Tons) and Value (US$ Bn) Forecast, by Product, 2020–2031
14.4.4. South Africa SLS, SLES, and LAS Market Volume (Kilo Tons) and Value (US$ Bn) Forecast, by Application, 2020–2031
14.4.5. Rest of Middle East & Africa SLS, SLES, and LAS Market Volume (Kilo Tons) and Value (US$ Bn) Forecast, by Product, 2020–2031
14.4.6. Rest of Middle East & Africa SLS, SLES, and LAS Market Volume (Kilo Tons) and Value (US$ Bn) Forecast, by Application, 2020–2031
14.5. Middle East & Africa SLS, SLES, and LAS Market Attractiveness Analysis
15. Competition Landscape
15.1. Global SLS, SLES, and LAS Company Market Share Analysis, 2020
15.2. Company Profiles (Details – Overview, Financials, Recent Developments, and Strategy)
15.2.1. Huntsman International LLC
15.2.1.1. Company Description
15.2.1.2. Business Overview
15.2.1.3. Financial Overview
15.2.1.4. Strategic Overview
15.2.2. Kao Corporation
15.2.2.1. Company Description
15.2.2.2. Business Overview
15.2.2.3. Financial Overview
15.2.2.4. Strategic Overview
15.2.3. BASF SE
15.2.3.1. Company Description
15.2.3.2. Business Overview
15.2.3.3. Financial Overview
15.2.3.4. Strategic Overview
15.2.4. Clariant AG
15.2.4.1. Company Description
15.2.4.2. Business Overview
15.2.4.3. Financial Overview
15.2.4.4. Strategic Overview
15.2.5. Lion Specialty Chemicals Co., Ltd.
15.2.5.1. Company Description
15.2.5.2. Business Overview
15.2.5.3. Financial Overview
15.2.5.4. Strategic Overview
15.2.6. Nouryon
15.2.6.1. Company Description
15.2.6.2. Business Overview
15.2.6.3. Financial Overview
15.2.6.4. Strategic Overview
15.2.7. Stepan Company
15.2.7.1. Company Description
15.2.7.2. Business Overview
15.2.7.3. Financial Overview
15.2.7.4. Strategic Overview
15.2.8. Taiwan NJC Corporation
15.2.8.1. Company Description
15.2.8.2. Business Overview
15.2.8.3. Financial Overview
15.2.8.4. Strategic Overview
15.2.9. Godrej Industries Limited
15.2.9.1. Company Description
15.2.9.2. Business Overview
15.2.9.3. Financial Overview
15.2.9.4. Strategic Overview
15.2.10. Henkel AG & Co. KGaA
15.2.10.1. Company Description
15.2.10.2. Business Overview
15.2.10.3. Financial Overview
15.2.10.4. Strategic Overview
15.2.11. Evonik Industries AG
15.2.11.1. Company Description
15.2.11.2. Business Overview
15.2.11.3. Financial Overview
15.2.11.4. Strategic Overview
15.2.12. Solvay
15.2.12.1. Company Description
15.2.12.2. Business Overview
15.2.12.3. Financial Overview
15.2.12.4. Strategic Overview
15.2.13. Galaxy Surfactants Ltd.
15.2.13.1. Company Description
15.2.13.2. Business Overview
15.2.13.3. Financial Overview
15.2.13.4. Strategic Overview
15.2.14. Dow
15.2.14.1. Company Description
15.2.14.2. Business Overview
15.2.14.3. Financial Overview
15.2.14.4. Strategic Overview
15.2.15. Oxiteno
15.2.15.1. Company Description
15.2.15.2. Business Overview
15.2.15.3. Financial Overview
15.2.15.4. Strategic Overview
15.2.16. AK ChemTech Co., Ltd.
15.2.16.1. Company Description
15.2.16.2. Business Overview
15.2.16.3. Financial Overview
15.2.16.4. Strategic Overview
16. Primary Research: Key Insights
17. Appendix
List of Tables
Table 1: Global SLS, SLES, and LAS Market Volume (Kilo Tons) Forecast, by Product, 2020–2031
Table 2: Global SLS, SLES, and LAS Market Value (US$ Bn) Forecast, by Product, 2020–2031
Table 3: Global SLS, SLES, and LAS Market Volume (Kilo Tons) Forecast, by Application, 2020–2031
Table 4: Global SLS, SLES, and LAS Market Value (US$ Bn) Forecast, by Application, 2020–2031
Table 5: Global SLS, SLES, and LAS Market Volume (Kilo Tons) Forecast, by Region, 2020–2031
Table 6: Global SLS, SLES, and LAS Market Value (US$ Bn) Forecast, by Region, 2020–2031
Table 7: North America SLS, SLES, and LAS Market Volume (Kilo Tons) Forecast, by Product, 2020–2031
Table 8: North America SLS, SLES, and LAS Market Value (US$ Bn) Forecast, by Product, 2020–2031
Table 9: North America SLS, SLES, and LAS Market Volume (Kilo Tons) Forecast, by Application, 2020–2031
Table 10: North America SLS, SLES, and LAS Market Value (US$ Bn) Forecast, by Application, 2020–2031
Table 11: North America SLS, SLES, and LAS Market Volume (Kilo Tons) Forecast, by Country, 2020–2031
Table 12: North America SLS, SLES, and LAS Market Value (US$ Bn) Forecast, by Country, 2020–2031
Table 13: U.S. SLS, SLES, and LAS Market Volume (Kilo Tons) Forecast, by Product, 2020–2031
Table 14: U.S. SLS, SLES, and LAS Market Value (US$ Bn) Forecast, by Product, 2020–2031
Table 15: U.S. SLS, SLES, and LAS Market Volume (Kilo Tons) Forecast, by Application, 2020–2031
Table 16: U.S. SLS, SLES, and LAS Market Value (US$ Bn) Forecast, by Application, 2020–2031
Table 17: Canada SLS, SLES, and LAS Market Volume (Kilo Tons) Forecast, by Product, 2020–2031
Table 18: Canada SLS, SLES, and LAS Market Value (US$ Bn) Forecast, by Product, 2020–2031
Table 19: Canada SLS, SLES, and LAS Market Volume (Kilo Tons) Forecast, by Application, 2020–2031
Table 20: Canada SLS, SLES, and LAS Market Value (US$ Bn) Forecast, by Application, 2020–2031
Table 21: Europe SLS, SLES, and LAS Market Volume (Kilo Tons) Forecast, by Product, 2020–2031
Table 22: Europe SLS, SLES, and LAS Market Value (US$ Bn) Forecast, by Product, 2020–2031
Table 23: Europe SLS, SLES, and LAS Market Volume (Kilo Tons) Forecast, by Application, 2020–2031
Table 24: Europe SLS, SLES, and LAS Market Value (US$ Bn) Forecast, by Application, 2020–2031
Table 25: Europe SLS, SLES, and LAS Market Volume (Kilo Tons) Forecast, by Country and Sub-region, 2020–2031
Table 26: Europe SLS, SLES, and LAS Market Value (US$ Bn) Forecast, by Country and Sub-region, 2020–2031
Table 27: Germany SLS, SLES, and LAS Market Volume (Kilo Tons) Forecast, by Product, 2020–2031
Table 28: Germany SLS, SLES, and LAS Market Value (US$ Bn) Forecast, by Product, 2020–2031
Table 29: Germany SLS, SLES, and LAS Market Volume (Kilo Tons) Forecast, by Application, 2020–2031
Table 30: Germany SLS, SLES, and LAS Market Value (US$ Bn) Forecast, by Application, 2020–2031
Table 31: France SLS, SLES, and LAS Market Volume (Kilo Tons) Forecast, by Product, 2020–2031
Table 32: France SLS, SLES, and LAS Market Value (US$ Bn) Forecast, by Product, 2020–2031
Table 33: France SLS, SLES, and LAS Market Volume (Kilo Tons) Forecast, by Application, 2020–2031
Table 34: France SLS, SLES, and LAS Market Value (US$ Bn) Forecast, by Application, 2020–2031
Table 35: U.K. SLS, SLES, and LAS Market Volume (Kilo Tons) Forecast, by Product, 2020–2031
Table 36: U.K. SLS, SLES, and LAS Market Value (US$ Bn) Forecast, by Product, 2020–2031
Table 37: U.K. SLS, SLES, and LAS Market Volume (Kilo Tons) Forecast, by Application, 2020–2031
Table 38: U.K. SLS, SLES, and LAS Market Value (US$ Bn) Forecast, by Application, 2020–2031
Table 39: Italy SLS, SLES, and LAS Market Volume (Kilo Tons) Forecast, by Product, 2020–2031
Table 40: Italy SLS, SLES, and LAS Market Value (US$ Bn) Forecast, by Product, 2020–2031
Table 41: Italy SLS, SLES, and LAS Market Volume (Kilo Tons) Forecast, by Application, 2020–2031
Table 42: Italy SLS, SLES, and LAS Market Value (US$ Bn) Forecast, by Application, 2020–2031
Table 43: Spain SLS, SLES, and LAS Market Volume (Kilo Tons) Forecast, by Product, 2020–2031
Table 44: Spain SLS, SLES, and LAS Market Value (US$ Bn) Forecast, by Product, 2020–2031
Table 45: Spain SLS, SLES, and LAS Market Volume (Kilo Tons) Forecast, by Application, 2020–2031
Table 46: Spain SLS, SLES, and LAS Market Volume (Kilo Tons) Forecast, by Application, 2020–2031
Table 47: Russia & CIS SLS, SLES, and LAS Market Volume (Kilo Tons) Forecast, by Product, 2020–2031
Table 48: Russia & CIS SLS, SLES, and LAS Market Value (US$ Bn) Forecast, by Product, 2020–2031
Table 49: Russia & CIS SLS, SLES, and LAS Market Volume (Kilo Tons) Forecast, by Application, 2020–2031
Table 50: Russia & CIS SLS, SLES, and LAS Market Value (US$ Bn) Forecast, by Application, 2020–2031
Table 51: Rest of Europe SLS, SLES, and LAS Market Volume (Kilo Tons) Forecast, by Product, 2020–2031
Table 52: Rest of Europe SLS, SLES, and LAS Market Value (US$ Bn) Forecast, by Product, 2020–2031
Table 53: Rest of Europe SLS, SLES, and LAS Market Volume (Kilo Tons) Forecast, by Application, 2020–2031
Table 54: Rest of Europe SLS, SLES, and LAS Market Value (US$ Bn) Forecast, by Application, 2020–2031
Table 55: Asia Pacific SLS, SLES, and LAS Market Volume (Kilo Tons) Forecast, by Product, 2020–2031
Table 56: Asia Pacific SLS, SLES, and LAS Market Value (US$ Bn) Forecast, by Product, 2020–2031
Table 57: Asia Pacific SLS, SLES, and LAS Market Volume (Kilo Tons) Forecast, by Application, 2020–2031
Table 58: Asia Pacific SLS, SLES, and LAS Market Value (US$ Bn) Forecast, by Application, 2020–2031
Table 59: Asia Pacific SLS, SLES, and LAS Market Volume (Kilo Tons) Forecast, by Country and Sub-region, 2020–2031
Table 60: Asia Pacific SLS, SLES, and LAS Market Value (US$ Bn) Forecast, by Country and Sub-region, 2020–2031
Table 61: China SLS, SLES, and LAS Market Volume (Kilo Tons) Forecast, by Product, 2020–2031
Table 62: China SLS, SLES, and LAS Market Value (US$ Bn) Forecast, by Product, 2020–2031
Table 63: China SLS, SLES, and LAS Market Volume (Kilo Tons) Forecast, by Application, 2020–2031
Table 64: China SLS, SLES, and LAS Market Value (US$ Bn) Forecast, by Application, 2020–2031
Table 65: Japan SLS, SLES, and LAS Market Volume (Kilo Tons) Forecast, by Product, 2020–2031
Table 66: Japan SLS, SLES, and LAS Market Value (US$ Bn) Forecast, by Product, 2020–2031
Table 67: Japan SLS, SLES, and LAS Market Volume (Kilo Tons) Forecast, by Application, 2020–2031
Table 68: Japan SLS, SLES, and LAS Market Value (US$ Bn) Forecast, by Application, 2020–2031
Table 69: India SLS, SLES, and LAS Market Volume (Kilo Tons) Forecast, by Product, 2020–2031
Table 70: India SLS, SLES, and LAS Market Value (US$ Bn) Forecast, by Product, 2020–2031
Table 71: India SLS, SLES, and LAS Market Volume (Kilo Tons) Forecast, by Application, 2020–2031
Table 72: India SLS, SLES, and LAS Market Value (US$ Bn) Forecast, by Application, 2020–2031
Table 73: South Korea SLS, SLES, and LAS Market Volume (Kilo Tons) Forecast, by Product, 2020–2031
Table 74: South Korea SLS, SLES, and LAS Market Value (US$ Bn) Forecast, by Product, 2020–2031
Table 75: South Korea SLS, SLES, and LAS Market Volume (Kilo Tons) Forecast, by Application, 2020–2031
Table 76: South Korea SLS, SLES, and LAS Market Value (US$ Bn) Forecast, by Application, 2020–2031
Table 77: Australia SLS, SLES, and LAS Market Volume (Kilo Tons) Forecast, by Product, 2020–2031
Table 78: Australia SLS, SLES, and LAS Market Value (US$ Bn) Forecast, by Product, 2020–2031
Table 79: Australia SLS, SLES, and LAS Market Volume (Kilo Tons) Forecast, by Application, 2020–2031
Table 80: Australia SLS, SLES, and LAS Market Value (US$ Bn) Forecast, by Application, 2020–2031
Table 81: ASEAN SLS, SLES, and LAS Market Volume (Kilo Tons) Forecast, by Product, 2020–2031
Table 82: ASEAN SLS, SLES, and LAS Market Value (US$ Bn) Forecast, by Product, 2020–2031
Table 83: ASEAN SLS, SLES, and LAS Market Volume (Kilo Tons) Forecast, by Application, 2020–2031
Table 84: ASEAN SLS, SLES, and LAS Market Value (US$ Bn) Forecast, by Application, 2020–2031
Table 85: Rest of Asia Pacific SLS, SLES, and LAS Market Volume (Kilo Tons) Forecast, by Product, 2020–2031
Table 86: Rest of Asia Pacific SLS, SLES, and LAS Market Value (US$ Bn) Forecast, by Product, 2020–2031
Table 87: Rest of Asia Pacific SLS, SLES, and LAS Market Volume (Kilo Tons) Forecast, by Application, 2020–2031
Table 88: Rest of Asia Pacific SLS, SLES, and LAS Market Value (US$ Bn) Forecast, by Application, 2020–2031
Table 89: Latin America SLS, SLES, and LAS Market Volume (Kilo Tons) Forecast, by Product, 2020–2031
Table 90: Latin America SLS, SLES, and LAS Market Value (US$ Bn) Forecast, by Product, 2020–2031
Table 91: Latin America SLS, SLES, and LAS Market Volume (Kilo Tons) Forecast, by Application, 2020–2031
Table 92: Latin America SLS, SLES, and LAS Market Value (US$ Bn) Forecast, by Application, 2020–2031
Table 93: Latin America SLS, SLES, and LAS Market Volume (Kilo Tons) Forecast, by Country and Sub-region, 2020–2031
Table 94: Latin America SLS, SLES, and LAS Market Value (US$ Bn) Forecast, by Country and Sub-region, 2020–2031
Table 95: Brazil SLS, SLES, and LAS Market Volume (Kilo Tons) Forecast, by Product, 2020–2031
Table 96: Brazil SLS, SLES, and LAS Market Value (US$ Bn) Forecast, by Product, 2020–2031
Table 97: Brazil SLS, SLES, and LAS Market Volume (Kilo Tons) Forecast, by Application, 2020–2031
Table 98: Brazil SLS, SLES, and LAS Market Value (US$ Bn) Forecast, by Application, 2020–2031
Table 99: Mexico SLS, SLES, and LAS Market Volume (Kilo Tons) Forecast, by Product, 2020–2031
Table 100: Mexico SLS, SLES, and LAS Market Value (US$ Bn) Forecast, by Product, 2020–2031
Table 101: Mexico SLS, SLES, and LAS Market Volume (Kilo Tons) Forecast, by Application, 2020–2031
Table 102: Mexico SLS, SLES, and LAS Market Value (US$ Bn) Forecast, by Application, 2020–2031
Table 103: Rest of Latin America SLS, SLES, and LAS Market Volume (Kilo Tons) Forecast, by Product, 2020–2031
Table 104: Rest of Latin America SLS, SLES, and LAS Market Value (US$ Bn) Forecast, by Product, 2020–2031
Table 105: Rest of Latin America SLS, SLES, and LAS Market Volume (Kilo Tons) Forecast, by Application, 2020–2031
Table 106: Rest of Latin America SLS, SLES, and LAS Market Value (US$ Bn) Forecast, by Application, 2020–2031
Table 107: Middle East & Africa SLS, SLES, and LAS Market Volume (Kilo Tons) Forecast, by Product, 2020–2031
Table 108: Middle East & Africa SLS, SLES, and LAS Market Value (US$ Bn) Forecast, by Product, 2020–2031
Table 109: Middle East & Africa SLS, SLES, and LAS Market Volume (Kilo Tons) Forecast, by Application, 2020–2031
Table 110: Middle East & Africa SLS, SLES, and LAS Market Value (US$ Bn) Forecast, by Application, 2020–2031
Table 111: Middle East & Africa SLS, SLES, and LAS Market Volume (Kilo Tons) Forecast, by Country and Sub-region, 2020–2031
Table 112: Middle East & Africa SLS, SLES, and LAS Market Value (US$ Bn) Forecast, by Country and Sub-region, 2020–2031
Table 113: GCC SLS, SLES, and LAS Market Volume (Kilo Tons) Forecast, by Product, 2020–2031
Table 114: GCC SLS, SLES, and LAS Market Value (US$ Bn) Forecast, by Product, 2020–2031
Table 115: GCC SLS, SLES, and LAS Market Volume (Kilo Tons) Forecast, by Application, 2020–2031
Table 116: GCC SLS, SLES, and LAS Market Value (US$ Bn) Forecast, by Application, 2020–2031
Table 117: South Africa SLS, SLES, and LAS Market Volume (Kilo Tons) Forecast, by Product, 2020–2031
Table 118: South Africa SLS, SLES, and LAS Market Value (US$ Bn) Forecast, by Product, 2020–2031
Table 119: South Africa SLS, SLES, and LAS Market Volume (Kilo Tons) Forecast, by Application, 2020–2031
Table 120: South Africa SLS, SLES, and LAS Market Value (US$ Bn) Forecast, by Application, 2020–2031
Table 121: Rest of Middle East & Africa SLS, SLES, and LAS Market Volume (Kilo Tons) Forecast, by Product, 2020–2031
Table 122: Rest of Middle East & Africa SLS, SLES, and LAS Market Value (US$ Bn) Forecast, by Product, 2020–2031
Table 123: Rest of Middle East & Africa SLS, SLES, and LAS Market Volume (Kilo Tons) Forecast, by Application, 2020–20
Table 124: Rest of Middle East & Africa SLS, SLES, and LAS Market Value (US$ Bn) Forecast, by Application, 2020–2031
List of Figures
Figure 1: Global SLS, SLES, and LAS Market Volume Share Analysis, by Product, 2020, 2025, and 2031
Figure 2: Global SLS, SLES, and LAS Market Attractiveness, by Product
Figure 3: Global SLS, SLES, and LAS Market Volume Share Analysis, by Application, 2020, 2025, and 2031
Figure 4: Global SLS, SLES, and LAS Market Attractiveness, by Application
Figure 5: Global SLS, SLES, and LAS Market Volume Share Analysis, by Region, 2020, 2025, and 2031
Figure 6: Global SLS, SLES, and LAS Market Attractiveness, by Region
Figure 7: North America SLS, SLES, and LAS Market Volume Share Analysis, by Product, 2020, 2025, and 2031
Figure 8: North America SLS, SLES, and LAS Market Attractiveness, by Product
Figure 9: North America SLS, SLES, and LAS Market Volume Share Analysis, by Application, 2020, 2025, and 2031
Figure 10: North America SLS, SLES, and LAS Market Attractiveness, by Application
Figure 11: North America SLS, SLES, and LAS Market Attractiveness, by Country
Figure 12: Europe SLS, SLES, and LAS Market Volume Share Analysis, by Product, 2020, 2025, and 2031
Figure 13: Europe SLS, SLES, and LAS Market Attractiveness, by Product
Figure 14: Europe SLS, SLES, and LAS Market Volume Share Analysis, by Application, 2020, 2025, and 2031
Figure 15: Europe SLS, SLES, and LAS Market Attractiveness, by Application
Figure 16: Europe SLS, SLES, and LAS Market Volume Share Analysis, by Country and Sub-region, 2020, 2025, and 2031
Figure 17: Europe SLS, SLES, and LAS Market Attractiveness, by Country and Sub-region
Figure 18: Asia Pacific SLS, SLES, and LAS Market Volume Share Analysis, by Product, 2020, 2025, and 2031
Figure 19: Asia Pacific SLS, SLES, and LAS Market Attractiveness, by Product
Figure 20: Asia Pacific SLS, SLES, and LAS Market Volume Share Analysis, by Application, 2020, 2025, and 2031
Figure 21: Asia Pacific SLS, SLES, and LAS Market Attractiveness, by Application
Figure 22: Asia Pacific SLS, SLES, and LAS Market Volume Share Analysis, by Country and Sub-region, 2020, 2025, and 2031
Figure 23: Asia Pacific SLS, SLES, and LAS Market Attractiveness, by Country and Sub-region
Figure 24: Latin America SLS, SLES, and LAS Market Volume Share Analysis, by Product, 2020, 2025, and 2031
Figure 25: Latin America SLS, SLES, and LAS Market Attractiveness, by Product
Figure 26: Latin America SLS, SLES, and LAS Market Volume Share Analysis, by Application, 2020, 2025, and 2031
Figure 27: Latin America SLS, SLES, and LAS Market Attractiveness, by Application
Figure 28: Latin America SLS, SLES, and LAS Market Volume Share Analysis, by Country and Sub-region, 2020, 2025, and 2031
Figure 29: Latin America SLS, SLES, and LAS Market Attractiveness, by Country and Sub-region
Figure 30: Middle East & Africa SLS, SLES, and LAS Market Volume Share Analysis, by Product, 2020, 2025, and 2031
Figure 31: Middle East & Africa SLS, SLES, and LAS Market Attractiveness, by Product
Figure 32: Middle East & Africa SLS, SLES, and LAS Market Volume Share Analysis, by Application, 2020, 2025, and 2031
Figure 33: Middle East & Africa SLS, SLES, and LAS Market Attractiveness, by Application
Figure 34: Middle East & Africa SLS, SLES, and LAS Market Volume Share Analysis, by Country and Sub-region, 2020, 2025, and 2031
Figure 35: Middle East & Africa SLS, SLES, and LAS Market Attractiveness, by Country and Sub-region
Copyright © Transparency Market Research, Inc. All Rights reserved
Trust Online

SLS, SLES and LAS Market