
Reports
Reports
Analysts’ Viewpoint on silicon photomultiplier Market Scenario
Companies operating in the silicon photomultiplier market are focusing on high-growth applications such as LIDAR, medical imaging, and analytical instrumentation in order to grow post COVID-19 pandemic. Consequently, the market is expected to rise signicantly during the forecast period, owing to the numerous advantages offered by silicon photomultipliers such as low voltage operation, excellent timing performance, high sensitivity, immunity to the magnetic field, etc. The silicon photomultiplier market in Asia Pacific is anticipated to advance considerably during the coming years due to increase in demand for LiDAR technology primarily in the automotive industry, and the presence of a significant number of automakers in Japan, India, and China. COVID-19 had disrupted the supply chain of silicon photomultipliers. However, the supply of raw materials has improved post-COVID-19, thereby enabling silicon photomultiplier manufacturers to keep pace with the increased demand from end-use industries such as consumer electronics, industrial, and automotive, which rely heavily on silicon photomultipliers.
The silicon photomultiplier (SiPM) is a radiation detector that offers high efficiency, high sensitivity, and very low time jitter. It is based on reversed biased p/n diodes and can directly help detect light from near ultraviolet to near-infrared. SiPMs are used in those applications where low light radiation levels must be measured and quantified with high precision. Silicon photomultiplier (SiPM) addresses the challenge related to timing, sensing, and quantifying low-light signals down to the single-photon level.
SiPM has rapidly gained popularity in the field of hazard and threat detection, biophotonics, high energy physics, LiDAR, etc., due to features such as mechanical robustness and excellent uniformity of response, low voltage operation. Consequently, the global silicon photomultiplier market is likely to expand at a steady pace during the forecast period owing to its growing applications in medical imaging and hazard & threat detection.
The LiDAR has become an important requirement for Advanced Driver Assistance Systems (ADAS) as the automotive industry moves toward improved driver safety and autonomous cars. The key advantage offered by modern LiDAR systems in the automotive industry is the distance at which objects with low reflectivity can be detected.
Key players are adopting several strategic initiatives to penetrate deeper in LiDAR technology. For instance, in May 2018, On Semiconductor acquired SensL Technologies to expand On Semiconductor's product portfolio for automotive sensing applications such as ADAS and autonomous driving. SensL Technologies’ SPADs and SiPM detectors are designed for long-range LIDAR that would allow LIDAR systems to operate at a range of 200 meters or more. Single Photon Avalanche Diode (SPAD) and silicon photomultipliers (SiPM) sensors are developing as the most promising sensor technology for long-range >100m, and direct time-of-flight LiDAR that needs to function in bright daylight and with low reflectance targets.
Manufacturers are also focusing on the development a low-level light sensor for LiDAR application. For instance, In March 2021, ElectroOptical Components had launched RED silicon photomultipliers (SiPMs), which is silicon-based solid-state low-level light sensor, used for LIDAR applications. SiPMs offer several advantages such as low-temperature dependency, high gain, ease of operation, and improved next-generation sensor performance for LiDAR applications.
The silicon photomultiplier (SiPM) is replacing the photomultiplier tube (PMT) in positron emission tomography (PET) systems due to its superior properties, such as fast single-photon timing response, small gap between adjacent photosensitive pixels in the array, and insensitivity to magnetic fields. Therefore, rapid replacement of conventional photomultiplier tubes (PMT) by silicon photomultiplier in medical imaging system is fueling the market. Moreover, silicon photomultipliers help these systems lower their price, become compact in size, offer high sensitivity, resolution, and efficiency.
In current scenario, silicon photomultipliers are widely integrated with new generation medical imaging devices that operate in low light and produce very small amount of noise as compared to photomultiplier tubes (PMT). Several major players are developing advanced silicon based low light sensor for medical applications and gaining attraction of medical device manufacturers. This, in turn, is contributing to the significant increase silicon photomultiplier market size.
In terms of device type, the global silicon photomultiplier market can be segregated into analog and digital device types. The digital silicon photomultiplier held a share of 68.3% in 2021. It is likely to maintain the status quo and expand at a growth rate of 6.6% during the forecast period. The digital silicon photomultiplier dominated the global silicon photomultiplier market due to rise in demand from the healthcare industry. In the healthcare industry, the digital silicon photomultiplier is used in various imaging systems such as x-ray, MRI machines, and Positron Emission Tomography (PET) diagnostic systems.
Development of advanced digital silicon photomultipliers structure for various applications is likely to grow at a rapid pace due to consistency advancements in modern semiconductor technology. This, in turn, is projected to further drive the digital silicon photomultiplier market.
In terms of the type, the silicon photomultiplier market has been classified into NUV SiPMs and RGB SiPMs. The silicon photomultipliers gained popularity in the RGB SiPM type segment and held a share of 59.3% in 2021. Furthermore, the segment is expected to register a CAGR of 8.5% during the forecast period. The RGB SiPMs segment dominated the global silicon photomultiplier market owing to the increasing use of energy physics, nuclear medicine, homeland security, medical diagnostics, and analytical instruments.
Moreover, the RGB SiPMs offer extremely low temperature coefficient of the breakdown voltage and gain. The manufacturer are focusing to improve detector for red, green and blue (RGB) light detection with peak sensitivities at 420 nm or 550 nm. These factors are contributing to the growth of the global silicon photomultiplier market.
Asia Pacific has a major market for silicon photomultiplier, and the region held 35.6% share of the global market in 2021. Asia pacific dominated the global silicon photomultiplier market owing to the presence of leading automobile manufacturers in major economies such as Japan, India, and China. According to International Labor Organization, the sale of motor vehicles in Asia Pacific increased by 60%, from 25 million unit in 2010 to 47 million units in 2018. In 2018, China sold nearly 1.1 million EVs and had 2.3 million units on the road by 2018, making it the world’s largest EV market. Consequently, the adoption of silicon photomultipliers is likely to increase further in the next few years.
North America held a prominent share of 28.4% of the global silicon photomultiplier market in 2021. The silicon photomultiplier market in North America is expected to expand in the upcoming year due to rising demand for silicon photomultipliers from the aerospace and defense industry. Increase in the use of LiDAR by military and armed forces for a wide range of defense applications such as determining line of sight, battlefield mapping, and autonomous navigation of military vehicles has fuelled the demand for silicon photomultipliers. Furthermore, the LiDAR is used as part of navigations systems in autonomous military vehicles, such as self-driving trucks, and drones, to detect the exact distance between the vehicle and other objects in order to support collision avoidance and to build a map of the surrounding. This is expected to further propel the silicon photomultiplier market in North America.
The global silicon photomultiplier market is consolidated, as limited number of players are catering to the global demand. Expansion of product portfolios and mergers and acquisitions are major strategies adopted by leading manufacturers operating in the global market. AdvanSiD, Broadcom Inc., CAEN S.p.A, Cremat Inc., Excelitas Technologies Corp, Fraunhofer IM, Hamamatsu Photonics K.K, Onsemi, Philips, TE connectivity are among the prominent manufacturers operating in the global silicon photomultiplier market.
Each of these players has been profiled in the silicon photomultiplier market report based on parameters such as company overview, financial overview, business strategies, product portfolio, business segments, and recent developments
|
Attribute |
Detail |
|
Market Size Value in 2021 |
US$ 123.7 Mn |
|
Market Forecast Value in 2031 |
US$ 274.4 Mn |
|
Growth Rate (CAGR) |
8.3% |
|
Forecast Period |
2022–2031 |
|
Historical Data Available for |
2017–2020 |
|
Quantitative Units |
US$ Mn for Value & Million Units for Volume |
|
Market Analysis |
It includes cross segment analysis at global as well as regional level. Furthermore, qualitative analysis includes drivers, restraints, opportunities, key trends, Porter’s Five Forces analysis, value chain analysis, and key trend analysis. |
|
Competition Landscape |
|
|
Format |
Example: Electronic (PDF) + Excel |
|
Market Segmentation |
|
|
Regions Covered |
|
|
Countries Covered |
|
|
Companies Profiled |
|
|
Customization Scope |
Available upon request |
|
Pricing |
Available upon request |
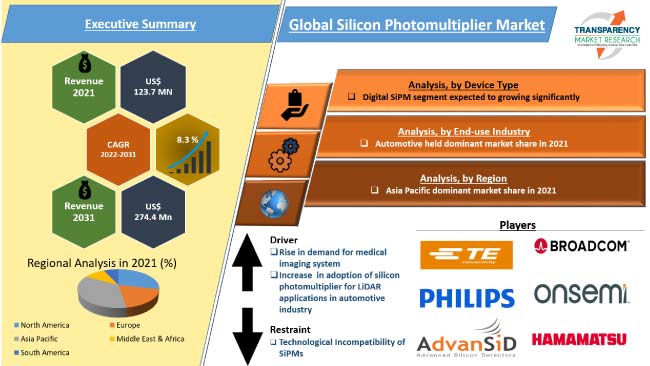
The silicon photomultiplier market stood at US$ 123.7 Mn in 2021
The silicon photomultiplier market is expected to rise at a CAGR of 8.3% from 2022 to 2031
Increase in adoption of silicon photomultiplier for LiDAR applications in automotive industry and rise in demand for medical imaging system
The RGB type segment accounted for major share of 59.3% of the silicon photomultiplier market in 2021
The automotive segment accounted for major share of 34.2% of the silicon photomultiplier market in 2021
Asia Pacific region accounted for major share of 35.6% of the silicon photomultiplier market
China accounted for 41.6% share of the silicon photomultiplier market
AdvanSiD, Broadcom Inc., CAEN S.p.A, Cremat Inc, Excelitas Technologies Corp, Fraunhofer IM, Hamamatsu Photonics K.K, Onsemi, Philips, TE connectivity
1. Preface
1.1. Market Introduction
1.2. Market and Segments Definition
1.3. Market Taxonomy
1.4. Research Methodology
1.5. Assumption and Acronyms
2. Executive Summary
2.1. Global Silicon Photomultiplier Market Overview
2.2. Regional Outline
2.3. Industry Outline
2.4. Market Dynamics Snapshot
2.5. Competition Blueprint
3. Market Dynamics
3.1. Macro-economic Factors
3.2. Drivers
3.3. Restraints
3.4. Opportunities
3.5. Key Trends
3.6. Regulatory Framework
4. Associated Industry and Key Indicator Assessment
4.1. Parent Industry Overview – Global Capacitor Industry Overview
4.2. Supply Chain Analysis
4.3. Pricing Analysis
4.4. Technology Roadmap Analysis
4.5. Industry SWOT Analysis
4.6. Porter Five Forces Analysis
4.7. Covid-19 Impact and Recovery Analysis
5. Global Silicon Photomultiplier Market Analysis, by Type
5.1. Silicon Photomultiplier Market Value (US$ Mn) and Volume (Million Units) Analysis & Forecast, by Type, 2017–2031
5.1.1. NUV SiPMs
5.1.2. RGB SiPMs
5.2. Market Attractiveness Analysis, By Type
6. Global Silicon Photomultiplier Market Analysis, by Device Type
6.1. Silicon Photomultiplier Market Value (US$ Mn) Analysis & Forecast, by Device Type, 2017–2031
6.1.1. Analog SiPMs
6.1.2. Digital SiPMs
6.2. Market Attractiveness Analysis, By Device Type
7. Global Silicon Photomultiplier Market Analysis, by Application
7.1. Silicon Photomultiplier Market Value (US$ Mn) Analysis & Forecast, by Application, 2017–2031
7.1.1. LiDAR
7.1.2. Medical Imaging
7.1.3. Hazard & Threat Detection
7.1.4. Gamma Ray Spectroscopy
7.1.5. Handheld and Mobile Devices
7.1.6. Analytical Instrumentation
7.1.7. Others
7.2. Market Attractiveness Analysis, By Application
8. Global Silicon Photomultiplier Market Analysis, by End-use Industry
8.1. Silicon Photomultiplier Market Value (US$ Mn) Analysis & Forecast, by End-use Industry, 2017–2031
8.1.1. Automotive
8.1.2. Healthcare
8.1.3. Consumer Electronics
8.1.4. Aerospace and Defense
8.1.5. Industrial
8.1.6. Others
8.2. Market Attractiveness Analysis, By End-use Industry
9. Silicon Photomultiplier Market Analysis and Forecast, by Region
9.1. Silicon Photomultiplier Market Value (US$ Mn) and Volume (Million Units) Analysis & Forecast, by Region, 2017–2031
9.1.1. North America
9.1.2. Europe
9.1.3. Asia Pacific
9.1.4. Middle East & Africa
9.1.5. South America
9.2. Market Attractiveness Analysis, By Region
10. North America Silicon Photomultiplier Market Analysis and Forecast
10.1. Market Snapshot
10.2. Drivers and Restraints: Impact Analysis
10.3. Silicon Photomultiplier Market Value (US$ Mn) and Volume (Million Units) Analysis & Forecast, by Type, 2017–2031
10.3.1. NUV SiPMs
10.3.2. RGB SiPMs
10.4. Silicon Photomultiplier Market Value (US$ Mn) Analysis & Forecast, by Device Type, 2017–2031
10.4.1. Analog SiPMs
10.4.2. Digital SiPMs
10.5. Silicon Photomultiplier Market Value (US$ Mn) Analysis & Forecast, by Application, 2017–2031
10.5.1. LiDAR
10.5.2. Medical Imaging
10.5.3. Hazard & Threat Detection
10.5.4. Gamma Ray Spectroscopy
10.5.5. Handheld and Mobile Devices
10.5.6. Analytical Instrumentation
10.5.7. Others
10.6. Silicon Photomultiplier Market Value (US$ Mn) Analysis & Forecast, by End-use Industry, 2017–2031
10.6.1. Automotive
10.6.2. Healthcare
10.6.3. Consumer Electronics
10.6.4. Aerospace and Defense
10.6.5. Industrial
10.6.6. Others
10.7. Silicon Photomultiplier Value (US$ Mn) and Volume (Million Units) Analysis & Forecast, by Country and Sub-region, 2017–2031
10.7.1. U.S.
10.7.2. Canada
10.7.3. Rest of North America
10.8. Market Attractiveness Analysis
10.8.1. By Type
10.8.2. By Device Type
10.8.3. By Application
10.8.4. By End-use Industry
10.8.5. By Country/Sub-region
11. Europe Silicon Photomultiplier Market Analysis and Forecast
11.1. Market Snapshot
11.2. Drivers and Restraints: Impact Analysis
11.3. Silicon Photomultiplier Market Value (US$ Mn) and Volume (Million Units) Analysis & Forecast, by Type, 2017–2031
11.3.1. NUV SiPMs
11.3.2. RGB SiPMs
11.4. Silicon Photomultiplier Market Value (US$ Mn) Analysis & Forecast, by Device Type, 2017–2031
11.4.1. Analog SiPMs
11.4.2. Digital SiPMs
11.5. Silicon Photomultiplier Market Value (US$ Mn) Analysis & Forecast, by Application, 2017–2031
11.5.1. LiDAR
11.5.2. Medical Imaging
11.5.3. Hazard & Threat Detection
11.5.4. Gamma Ray Spectroscopy
11.5.5. Handheld and Mobile Devices
11.5.6. Analytical Instrumentation
11.5.7. Others
11.6. Silicon Photomultiplier Market Value (US$ Mn) Analysis & Forecast, by End-use Industry, 2017–2031
11.6.1. Automotive
11.6.2. Healthcare
11.6.3. Consumer Electronics
11.6.4. Aerospace and Defense
11.6.5. Industrial
11.6.6. Others
11.7. Silicon Photomultiplier Value (US$ Mn) and Volume (Million Units) Analysis & Forecast, by Country and Sub-region, 2017–2031
11.7.1. The U.K.
11.7.2. Germany
11.7.3. France
11.7.4. Rest of Europe
11.8. Market Attractiveness Analysis
11.8.1. By Type
11.8.2. By Device Type
11.8.3. By Application
11.8.4. By End-use Industry
11.8.5. By Country/Sub-region
12. Asia Pacific Silicon Photomultiplier Market Analysis and Forecast
12.1. Market Snapshot
12.2. Drivers and Restraints: Impact Analysis
12.3. Silicon Photomultiplier Market Value (US$ Mn) and Volume (Million Units) Analysis & Forecast, by Type, 2017–2031
12.3.1. NUV SiPMs
12.3.2. RGB SiPMs
12.4. Silicon Photomultiplier Market Value (US$ Mn) Analysis & Forecast, by Device Type, 2017–2031
12.4.1. Analog SiPMs
12.4.2. Digital SiPMs
12.5. Silicon Photomultiplier Market Value (US$ Mn) Analysis & Forecast, by Application, 2017–2031
12.5.1. LiDAR
12.5.2. Medical Imaging
12.5.3. Hazard & Threat Detection
12.5.4. Gamma Ray Spectroscopy
12.5.5. Handheld and Mobile Devices
12.5.6. Analytical Instrumentation
12.5.7. Others
12.6. Silicon Photomultiplier Market Value (US$ Mn) Analysis & Forecast, by End-use Industry, 2017–2031
12.6.1. Automotive
12.6.2. Healthcare
12.6.3. Consumer Electronics
12.6.4. Aerospace and Defense
12.6.5. Industrial
12.6.6. Others
12.7. Silicon Photomultiplier Value (US$ Mn) and Volume (Million Units) Analysis & Forecast, by Country and Sub-region, 2017–2031
12.7.1. China
12.7.2. India
12.7.3. Japan
12.7.4. South Korea
12.7.5. ASEAN
12.7.6. Rest of Asia Pacific
12.8. Market Attractiveness Analysis
12.8.1. By Type
12.8.2. By Device Type
12.8.3. By Application
12.8.4. By End-use Industry
12.8.5. By Country/Sub-region
13. Middle East & Africa Silicon Photomultiplier Market Analysis and Forecast
13.1. Market Snapshot
13.2. Drivers and Restraints: Impact Analysis
13.3. Silicon Photomultiplier Market Value (US$ Mn) and Volume (Million Units) Analysis & Forecast, by Type, 2017–2031
13.3.1. NUV SiPMs
13.3.2. RGB SiPMs
13.4. Silicon Photomultiplier Market Value (US$ Mn) Analysis & Forecast, by Device Type, 2017–2031
13.4.1. Analog SiPMs
13.4.2. Digital SiPMs
13.5. Silicon Photomultiplier Market Value (US$ Mn) Analysis & Forecast, by Application, 2017–2031
13.5.1. LiDAR
13.5.2. Medical Imaging
13.5.3. Hazard & Threat Detection
13.5.4. Gamma Ray Spectroscopy
13.5.5. Handheld and Mobile Devices
13.5.6. Analytical Instrumentation
13.5.7. Others
13.6. Silicon Photomultiplier Market Value (US$ Mn) Analysis & Forecast, by End-use Industry, 2017–2031
13.6.1. Automotive
13.6.2. Healthcare
13.6.3. Consumer Electronics
13.6.4. Aerospace and Defense
13.6.5. Industrial
13.6.6. Others
13.7. Silicon Photomultiplier Value (US$ Mn) and Volume (Million Units) Analysis & Forecast, by Country and Sub-region, 2017–2031
13.7.1. GCC
13.7.2. South Africa
13.7.3. Rest of the Middle East & Africa
13.8. Market Attractiveness Analysis
13.8.1. By Type
13.8.2. By Device Type
13.8.3. By Application
13.8.4. By End-use Industry
13.8.5. By Country/Sub-region
14. South America Silicon Photomultiplier Market Analysis and Forecast
14.1. Market Snapshot
14.2. Drivers and Restraints: Impact Analysis
14.3. Silicon Photomultiplier Market Value (US$ Mn) and Volume (Million Units) Analysis & Forecast, by Type, 2017–2031
14.3.1. NUV SiPMs
14.3.2. RGB SiPMs
14.4. Silicon Photomultiplier Market Value (US$ Mn) Analysis & Forecast, by Device Type, 2017–2031
14.4.1. Analog SiPMs
14.4.2. Digital SiPMs
14.5. Silicon Photomultiplier Market Value (US$ Mn) Analysis & Forecast, by Application, 2017–2031
14.5.1. LiDAR
14.5.2. Medical Imaging
14.5.3. Hazard & Threat Detection
14.5.4. Gamma Ray Spectroscopy
14.5.5. Handheld and Mobile Devices
14.5.6. Analytical Instrumentation;
14.5.7. Others
14.6. Silicon Photomultiplier Market Value (US$ Mn) Analysis & Forecast, by End-use Industry, 2017–2031
14.6.1. Automotive
14.6.2. Healthcare
14.6.3. Consumer Electronics
14.6.4. Aerospace and Defense
14.6.5. Industrial
14.6.6. Others
14.7. Silicon Photomultiplier Value (US$ Mn) and Volume (Million Units) Analysis & Forecast, by Country and Sub-region, 2017–2031
14.7.1. Brazil
14.7.2. Rest of South America
14.8. Market Attractiveness Analysis
14.8.1. By Type
14.8.2. By Device Type
14.8.3. By Application
14.8.4. By End-use Industry
14.8.5. By Country/Sub-region
15. Competition Assessment
15.1. Global Silicon Photomultiplier Market Competition Matrix - a Dashboard View
15.1.1. Global Silicon Photomultiplier Market Company Share Analysis, by Value (2021)
15.1.2. Technological Differentiator
16. Company Profiles (Global Manufacturers/Suppliers)
16.1. AdvanSiD
16.1.1. Overview
16.1.2. Product Portfolio
16.1.3. Sales Footprint
16.1.4. Key Subsidiaries or Distributors
16.1.5. Strategy and Recent Developments
16.1.6. Key Financials
16.2. Broadcom Inc.
16.2.1. Overview
16.2.2. Product Portfolio
16.2.3. Sales Footprint
16.2.4. Key Subsidiaries or Distributors
16.2.5. Strategy and Recent Developments
16.2.6. Key Financials
16.3. CAEN S.p.A
16.3.1. Overview
16.3.2. Product Portfolio
16.3.3. Sales Footprint
16.3.4. Key Subsidiaries or Distributors
16.3.5. Strategy and Recent Developments
16.3.6. Key Financials
16.4. Cremat Inc.
16.4.1. Overview
16.4.2. Product Portfolio
16.4.3. Sales Footprint
16.4.4. Key Subsidiaries or Distributors
16.4.5. Strategy and Recent Developments
16.4.6. Key Financials
16.5. Excelitas Technologies Corp.
16.5.1. Overview
16.5.2. Product Portfolio
16.5.3. Sales Footprint
16.5.4. Key Subsidiaries or Distributors
16.5.5. Strategy and Recent Developments
16.5.6. Key Financials
16.6. Fraunhofer IM
16.6.1. Overview
16.6.2. Product Portfolio
16.6.3. Sales Footprint
16.6.4. Key Subsidiaries or Distributors
16.6.5. Strategy and Recent Developments
16.6.6. Key Financials
16.7. Hamamatsu Photonics K.K.
16.7.1. Overview
16.7.2. Product Portfolio
16.7.3. Sales Footprint
16.7.4. Key Subsidiaries or Distributors
16.7.5. Strategy and Recent Developments
16.7.6. Key Financials
16.8. Onsemi
16.8.1. Overview
16.8.2. Product Portfolio
16.8.3. Sales Footprint
16.8.4. Key Subsidiaries or Distributors
16.8.5. Strategy and Recent Developments
16.8.6. Key Financials
16.9. Philips
16.9.1. Overview
16.9.2. Product Portfolio
16.9.3. Sales Footprint
16.9.4. Key Subsidiaries or Distributors
16.9.5. Strategy and Recent Developments
16.9.6. Key Financials
16.10. TE connectivity
16.10.1. Overview
16.10.2. Product Portfolio
16.10.3. Sales Footprint
16.10.4. Key Subsidiaries or Distributors
16.10.5. Strategy and Recent Developments
16.10.6. Key Financials
17. Recommendation
17.1. Opportunity Assessment
17.1.1. By Type
17.1.2. By Device Type
17.1.3. By Application
17.1.4. By End-use Industry
17.1.5. By Region
List of Tables
Table 1: Global Silicon Photomultiplier Market Value (US$ Mn) & Forecast, by Type, 2017‒2031
Table 2: Global Silicon Photomultiplier Market Volume (Million Units) & Forecast, by Type, 2017‒2031
Table 3: Global Silicon Photomultiplier Market Value (US$ Mn) & Forecast, by Device Type, 2017‒2031
Table 4: Global Silicon Photomultiplier Market Value (US$ Mn) & Forecast, by Application, 2017‒2031
Table 5: Global Silicon Photomultiplier Market Value (US$ Mn) & Forecast, by End-use Industry, 2017‒2031
Table 6: Global Silicon Photomultiplier Market Value (US$ Mn) & Forecast, by Region, 2017‒2031
Table 7: Global Silicon Photomultiplier Market Volume (Million Units) & Forecast, by Region, 2017‒2031
Table 8: North America Silicon Photomultiplier Market Value (US$ Mn) & Forecast, by Type, 2017‒2031
Table 9: North America Silicon Photomultiplier Market Volume (Million Units) & Forecast, by Type, 2017‒2031
Table 10: North America Silicon Photomultiplier Market Value (US$ Mn) & Forecast, by Device Type, 2017‒2031
Table 11: North America Silicon Photomultiplier Market Value (US$ Mn) & Forecast, by Application, 2017‒2031
Table 12: North America Silicon Photomultiplier Market Value (US$ Mn) & Forecast, by End-use Industry, 2017‒2031
Table 13: North America Silicon Photomultiplier Market Value (US$ Mn) & Forecast, by Country/Sub-region, 2017‒2031
Table 14: North America Silicon Photomultiplier Market Volume (Million Units) & Forecast, by Country/Sub-region, 2017‒2031
Table 15: Europe Silicon Photomultiplier Market Value (US$ Mn) & Forecast, by Type, 2017‒2031
Table 16: Europe Silicon Photomultiplier Market Volume (Million Units) & Forecast, by Type, 2017‒2031
Table 17: Europe Silicon Photomultiplier Market Value (US$ Mn) & Forecast, by Device Type, 2017‒2031
Table 18: Europe Silicon Photomultiplier Market Value (US$ Mn) & Forecast, by Application, 2017‒2031
Table 19: Europe Silicon Photomultiplier Market Value (US$ Mn) & Forecast, by End-use Industry, 2017‒2031
Table 20: Europe Silicon Photomultiplier Market Value (US$ Mn) & Forecast, by Country/Sub-region, 2017‒2031
Table 21: Europe Silicon Photomultiplier Market Volume (Million Units) & Forecast, by Country/Sub-region, 2017‒2031
Table 22: Asia Pacific Silicon Photomultiplier Market Value (US$ Mn) & Forecast, by Type, 2017‒2031
Table 23: Asia Pacific Silicon Photomultiplier Market Volume (Million Units) & Forecast, by Type, 2017‒2031
Table 24: Asia Pacific Silicon Photomultiplier Market Value (US$ Mn) & Forecast, by Device Type, 2017‒2031
Table 25: Asia Pacific Silicon Photomultiplier Market Value (US$ Mn) & Forecast, by Application, 2017‒2031
Table 26: Asia Pacific Silicon Photomultiplier Market Value (US$ Mn) & Forecast, by End-use Industry, 2017‒2031
Table 27: Asia Pacific Silicon Photomultiplier Market Value (US$ Mn) & Forecast, by Country/Sub-region, 2017‒2031
Table 28: Asia Pacific Silicon Photomultiplier Market Volume (Million Units) & Forecast, by Country/Sub-region, 2017‒2031
Table 29: Middle East & Africa Silicon Photomultiplier Market Value (US$ Mn) & Forecast, by Type, 2017‒2031
Table 30: Middle East & Africa Silicon Photomultiplier Market Volume (Million Units) & Forecast, by Type, 2017‒2031
Table 31: Middle East & Africa Silicon Photomultiplier Market Value (US$ Mn) & Forecast, by Device Type, 2017‒2031
Table 32: Middle East & Africa Silicon Photomultiplier Market Value (US$ Mn) & Forecast, by Application, 2017‒2031
Table 33: Middle East & Africa Silicon Photomultiplier Market Value (US$ Mn) & Forecast, by End-use Industry, 2017‒2031
Table 34: Middle East & Africa Silicon Photomultiplier Market Value (US$ Mn) & Forecast, by Country/Sub-region, 2017‒2031
Table 35: Middle East & Africa Silicon Photomultiplier Market Volume (Million Units) & Forecast, by Country/Sub-region, 2017‒2031
Table 36: South America Silicon Photomultiplier Market Value (US$ Mn) & Forecast, by Type, 2017‒2031
Table 37: South America Silicon Photomultiplier Market Volume (Million Units) & Forecast, by Type, 2017‒2031
Table 38: South America Silicon Photomultiplier Market Value (US$ Mn) & Forecast, by Device Type, 2017‒2031
Table 39: South America Silicon Photomultiplier Market Value (US$ Mn) & Forecast, by Application, 2017‒2031
Table 40: South America Silicon Photomultiplier Market Value (US$ Mn) & Forecast, by End-use Industry, 2017‒2031
Table 41: South America Silicon Photomultiplier Market Value (US$ Mn) & Forecast, by Country/Sub-region, 2017‒2031
Table 42: South America Silicon Photomultiplier Market Volume (Million Units) & Forecast, by Country/Sub-region, 2017‒2031
List of Figures
Figure 01: Supply Chain Analysis - Global Silicon Photomultiplier
Figure 02: Global Silicon Photomultiplier Price Trend Analysis (Average Price, US$)
Figure 03: Porter Five Forces Analysis - Global Silicon Photomultiplier
Figure 04: Technology Road Map - Global Silicon Photomultiplier
Figure 05: Global Silicon Photomultipliers Market, Value (US$ Mn), 2017-2031
Figure 06: Global Silicon Photomultiplier Market Size & Forecast, Y-O-Y, Value (US$ Mn), 2017‒2031
Figure 07: Global Silicon Photomultipliers Market, Volume (Million Units), 2017-2031
Figure 08: Global Silicon Photomultiplier Market Size & Forecast, Y-O-Y, Volume (Million Units), 2017‒2031
Figure 09: Global Silicon Photomultiplier Market Projections by Type, Value (US$ Mn), 2017‒2031
Figure 10: Global Silicon Photomultiplier Market, Incremental Opportunity, by Type, 2021‒2031
Figure 11: Global Silicon Photomultiplier Market Share Analysis, by Type, 2021 and 2031
Figure 12: Global Silicon Photomultiplier Market Projections by Device Type, Value (US$ Mn), 2017‒2031
Figure 13: Global Silicon Photomultiplier Market, Incremental Opportunity, by Device Type, 2021‒2031
Figure 14: Global Silicon Photomultiplier Market Share Analysis, by Device Type, 2021 and 2031
Figure 15: Global Silicon Photomultiplier Market Projections by Application, Value (US$ Mn), 2017‒2031
Figure 16: Global Silicon Photomultiplier Market, Incremental Opportunity, by Application, 2021‒2031
Figure 17: Global Silicon Photomultiplier Market Share Analysis, by Application, 2021 and 2031
Figure 18: Global Silicon Photomultiplier Market Projections by End-use Industry, Value (US$ Mn), 2017‒2031
Figure 19: Global Silicon Photomultiplier Market, Incremental Opportunity, by End-use Industry, 2021‒2031
Figure 20: Global Silicon Photomultiplier Market Share Analysis, by End-use Industry, 2021 and 2031
Figure 21: Global Silicon Photomultiplier Market Projections by Region, Value (US$ Mn), 2017‒2031
Figure 22: Global Silicon Photomultiplier Market, Incremental Opportunity, by Region, 2021‒2031
Figure 23: Global Silicon Photomultiplier Market Share Analysis, by Region, 2021 and 2031
Figure 24: North America Silicon Photomultiplier Market Size & Forecast, Value (US$ Mn), 2017‒2031
Figure 25: North America Silicon Photomultiplier Market Size & Forecast, Y-O-Y, Value (US$ Mn), 2017‒2031
Figure 26: North America Silicon Photomultipliers Market, Volume (Million Units), 2017-2031
Figure 27: North America Silicon Photomultiplier Market Size & Forecast, Y-O-Y, Volume (Million Units), 2017‒2031
Figure 28: North America Silicon Photomultiplier Market Projections by Type Value (US$ Mn), 2017‒2031
Figure 29: North America Silicon Photomultiplier Market, Incremental Opportunity, by Type, 2021‒2031
Figure 30: North America Silicon Photomultiplier Market Share Analysis, by Type, 2021 and 2031
Figure 31: North America Silicon Photomultiplier Market Projections by Device Type, Value (US$ Mn), 2017‒2031
Figure 32: North America Silicon Photomultiplier Market, Incremental Opportunity, by Device Type, 2021‒2031
Figure 33: North America Silicon Photomultiplier Market Share Analysis, by Device Type, 2021 and 2031
Figure 34: North America Silicon Photomultiplier Market Projections by Application, Value (US$ Mn), 2017‒2031
Figure 35: North America Silicon Photomultiplier Market, Incremental Opportunity, by Application, 2021‒2031
Figure 36: North America Silicon Photomultiplier Market Share Analysis, by Application, 2021 and 2031
Figure 37: North America Silicon Photomultiplier Market Projections by End-use Industry, Value (US$ Mn), 2017‒2031
Figure 38: North America Silicon Photomultiplier Market, Incremental Opportunity, by End-use Industry, 2021‒2031
Figure 39: North America Silicon Photomultiplier Market Share Analysis, by End-use Industry, 2021 and 2031
Figure 40: North America Silicon Photomultiplier Market Projections by Country/Sub-region, Value (US$ Mn), 2017‒2031
Figure 41: North America Silicon Photomultiplier Market, Incremental Opportunity, by Country/Sub-region, 2021‒2031
Figure 42: North America Silicon Photomultiplier Market Share Analysis, by Country/Sub-region 2021 and 2031
Figure 43: Europe Silicon Photomultiplier Market Size & Forecast, Value (US$ Mn), 2017‒2031
Figure 44: Europe Silicon Photomultiplier Market Size & Forecast, Y-O-Y, Value (US$ Mn), 2017‒2031
Figure 45: Europe Silicon Photomultipliers Market, Volume (Million Units), 2017-2031
Figure 46: Europe Silicon Photomultiplier Market Size & Forecast, Y-O-Y, Volume (Million Units), 2017‒2031
Figure 47: Europe Silicon Photomultiplier Market Projections by Type Value (US$ Mn), 2017‒2031
Figure 48: Europe Silicon Photomultiplier Market, Incremental Opportunity, by Type, 2021‒2031
Figure 49: Europe Silicon Photomultiplier Market Share Analysis, by Type, 2021 and 2031
Figure 50: Europe Silicon Photomultiplier Market Projections by Device Type, Value (US$ Mn), 2017‒2031
Figure 51: Europe Silicon Photomultiplier Market, Incremental Opportunity, by Device Type, 2021‒2031
Figure 52: Europe Silicon Photomultiplier Market Share Analysis, by Device Type, 2021 and 2031
Figure 53: Europe Silicon Photomultiplier Market Projections by Application, Value (US$ Mn), 2017‒2031
Figure 54: Europe Silicon Photomultiplier Market, Incremental Opportunity, by Application, 2021‒2031
Figure 55: Europe Silicon Photomultiplier Market Share Analysis, by Application, 2021 and 2031
Figure 56: Europe Silicon Photomultiplier Market Projections by End-use Industry, Value (US$ Mn), 2017‒2031
Figure 57: Europe Silicon Photomultiplier Market, Incremental Opportunity, by End-use Industry, 2021‒2031
Figure 58: Europe Silicon Photomultiplier Market Share Analysis, by End-use Industry, 2021 and 2031
Figure 59: Europe Silicon Photomultiplier Market Projections by Country/Sub-region, Value (US$ Mn), 2017‒2031
Figure 60: Europe Silicon Photomultiplier Market, Incremental Opportunity, by Country/Sub-region, 2021‒2031
Figure 61: Europe Silicon Photomultiplier Market Share Analysis, by Country/Sub-region 2021 and 2031
Figure 62: Asia Pacific Silicon Photomultiplier Market Size & Forecast, Value (US$ Mn), 2017‒2031
Figure 63: Asia Pacific Silicon Photomultiplier Market Size & Forecast, Y-O-Y, Value (US$ Mn), 2017‒2031
Figure 64: Asia Pacific Silicon Photomultipliers Market, Volume (Million Units), 2017-2031
Figure 65: Asia Pacific Silicon Photomultiplier Market Size & Forecast, Y-O-Y, Volume (Million Units), 2017‒2031
Figure 66: Asia Pacific Silicon Photomultiplier Market Projections by Type Value (US$ Mn), 2017‒2031
Figure 67: Asia Pacific Silicon Photomultiplier Market, Incremental Opportunity, by Type, 2021‒2031
Figure 68: Asia Pacific Silicon Photomultiplier Market Share Analysis, by Type, 2021 and 2031
Figure 69: Asia Pacific Silicon Photomultiplier Market Projections by Device Type, Value (US$ Mn), 2017‒2031
Figure 70: Asia Pacific Silicon Photomultiplier Market, Incremental Opportunity, by Device Type, 2021‒2031
Figure 71: Asia Pacific Silicon Photomultiplier Market Share Analysis, by Device Type, 2021 and 2031
Figure 72: Asia Pacific Silicon Photomultiplier Market Projections by Application, Value (US$ Mn), 2017‒2031
Figure 73: Asia Pacific Silicon Photomultiplier Market, Incremental Opportunity, by Application, 2021‒2031
Figure 74: Asia Pacific Silicon Photomultiplier Market Share Analysis, by Application, 2021 and 2031
Figure 75: Asia Pacific Silicon Photomultiplier Market Projections by End-use Industry, Value (US$ Mn), 2017‒2031
Figure 76: Asia Pacific Silicon Photomultiplier Market, Incremental Opportunity, by End-use Industry, 2021‒2031
Figure 77: Asia Pacific Silicon Photomultiplier Market Share Analysis, by End-use Industry, 2021 and 2031
Figure 78: Asia Pacific Silicon Photomultiplier Market Projections by Country/Sub-region, Value (US$ Mn), 2017‒2031
Figure 79: Asia Pacific Silicon Photomultiplier Market, Incremental Opportunity, by Country/Sub-region, 2021‒2031
Figure 80: Asia Pacific Silicon Photomultiplier Market Share Analysis, by Country/Sub-region 2021 and 2031
Figure 81: MEA Silicon Photomultiplier Market Size & Forecast, Value (US$ Mn), 2017‒2031
Figure 82: MEA Silicon Photomultiplier Market Size & Forecast, Y-O-Y, Value (US$ Mn), 2017‒2031
Figure 83: MEA Silicon Photomultipliers Market, Volume (Million Units), 2017-2031
Figure 84: MEA Silicon Photomultiplier Market Size & Forecast, Y-O-Y, Volume (Million Units), 2017‒2031
Figure 85: MEA Silicon Photomultiplier Market Projections by Type Value (US$ Mn), 2017‒2031
Figure 86: MEA Silicon Photomultiplier Market, Incremental Opportunity, by Type, 2021‒2031
Figure 87: MEA Silicon Photomultiplier Market Share Analysis, by Type, 2021 and 2031
Figure 88: MEA Silicon Photomultiplier Market Projections by Device Type, Value (US$ Mn), 2017‒2031
Figure 89: MEA Silicon Photomultiplier Market, Incremental Opportunity, by Device Type, 2021‒2031
Figure 90: MEA Silicon Photomultiplier Market Share Analysis, by Device Type, 2021 and 2031
Figure 91: MEA Silicon Photomultiplier Market Projections by Application, Value (US$ Mn), 2017‒2031
Figure 92: MEA Silicon Photomultiplier Market, Incremental Opportunity, by Application, 2021‒2031
Figure 93: MEA Silicon Photomultiplier Market Share Analysis, by Application, 2021 and 2031
Figure 94: MEA Silicon Photomultiplier Market Projections by End-use Industry, Value (US$ Mn), 2017‒2031
Figure 95: MEA Silicon Photomultiplier Market, Incremental Opportunity, by End-use Industry, 2021‒2031
Figure 96: MEA Silicon Photomultiplier Market Share Analysis, by End-use Industry, 2021 and 2031
Figure 97: MEA Silicon Photomultiplier Market Projections by Country/Sub-region, Value (US$ Mn), 2017‒2031
Figure 98: MEA Silicon Photomultiplier Market, Incremental Opportunity, by Country/Sub-region, 2021‒2031
Figure 99: MEA Silicon Photomultiplier Market Share Analysis, by Country/Sub-region 2021 and 2031
Figure 100: South America Silicon Photomultiplier Market Size & Forecast, Value (US$ Mn), 2017‒2031
Figure 101: South America Silicon Photomultiplier Market Size & Forecast, Y-O-Y, Value (US$ Mn), 2017‒2031
Figure 102: South America Silicon Photomultipliers Market, Volume (Million Units), 2017-2031
Figure 103: South America Silicon Photomultiplier Market Size & Forecast, Y-O-Y, Volume (Million Units), 2017‒2031
Figure 104: South America Silicon Photomultiplier Market Projections by Type Value (US$ Mn), 2017‒2031
Figure 105: South America Silicon Photomultiplier Market, Incremental Opportunity, by Type, 2021‒2031
Figure 106: South America Silicon Photomultiplier Market Share Analysis, by Type, 2021 and 2031
Figure 107: South America Silicon Photomultiplier Market Projections by Device Type, Value (US$ Mn), 2017‒2031
Figure 108: South America Silicon Photomultiplier Market, Incremental Opportunity, by Device Type, 2021‒2031
Figure 109: South America Silicon Photomultiplier Market Share Analysis, by Device Type, 2021 and 2031
Figure 110: South America Silicon Photomultiplier Market Projections by Application, Value (US$ Mn), 2017‒2031
Figure 111: South America Silicon Photomultiplier Market, Incremental Opportunity, by Application, 2021‒2031
Figure 112: South America Silicon Photomultiplier Market Share Analysis, by Application, 2021 and 2031
Figure 113: South America Silicon Photomultiplier Market Projections by End-use Industry, Value (US$ Mn), 2017‒2031
Figure 114: South America Silicon Photomultiplier Market, Incremental Opportunity, by End-use Industry, 2021‒2031
Figure 115: South America Silicon Photomultiplier Market Share Analysis, by End-use Industry, 2021 and 2031
Figure 116: South America Silicon Photomultiplier Market Projections by Country/Sub-region, Value (US$ Mn), 2017‒2031
Figure 117: South America Silicon Photomultiplier Market, Incremental Opportunity, by Country/Sub-region, 2021‒2031
Figure 118: South America Silicon Photomultiplier Market Share Analysis, by Country/Sub-region 2021 and 2031
Figure 119: Global Silicon Photomultipliers Market Competition
Figure 120: Global Silicon Photomultiplier Market Company Share Analysis
Copyright © Transparency Market Research, Inc. All Rights reserved
Trust Online

Silicon Photomultiplier Market