
Reports
Reports
Analysts’ Viewpoint on Silicon Alloys Market Scenario
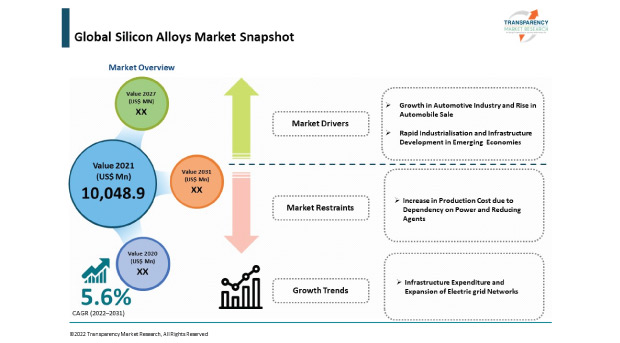
Increasing demand from the automobile industry, rapid industrialization, and infrastructure development in emerging economies is driving the silicon alloys market. A rise in production cost due to dependency on power and reducing agents has inadvertently hampered the growth of the silicon alloys market. The gap between actual infrastructure spending and required infrastructure expenditure presents significant opportunities for stakeholders in the silicon alloys market. Currently, global infrastructure spending stands at around US$ 2.5 Trn per year. This is proving inadequate in helping to cater to the increasing need of infrastructure across the world. This gap also results in lower economic growth and deprives people of essential services. Stakeholders in the silicon alloys market should strive to meet this gap in expenditure. This could provide new opportunities to the iron & steel industry. This, in turn, is expected to fuel the demand for silicon alloys such as ferrosilicon.
Alloy is generally referred to as a metallic substance comprising two or more substances in the form of compounds or solutions. Silicon alloys are alloys with a significant presence of silicon as an element in the compound. Silicon is an important alloying element, i.e., it is added in small quantities in various compounds to impart desirable properties. Steel, iron, and automotive industries are the key end-use industries for silicon alloys. Ferrosilicon is considered an important silicon alloy due to the large content of silicon in the composition.
Aluminum-silicon alloys are gaining popularity in the automotive and aerospace industries, as automotive & aerospace applications require materials with enhanced mechanical properties. Aluminum-silicon alloy material manufactured with powder metallurgy refines microstructure, resulting in unique property sets. It also helps with weight reduction and improves stability at elevated temperatures. Aluminum-silicon casting alloys possess a high strength-to-weight ratio, good corrosion resistance, castability, and recycling potential. Silicon enhances the favorable properties in metallic alloys used for casting, hence it is extensively utilized in aluminum-silicon casting alloys. Challenging environments such as automotive and defense applications require materials with enhanced mechanical properties, which in turn is fueling the demand for aluminum silicon alloys. On the other hand, calcium silicon alloy (calcium silicide) is used as a deoxidizer and desulfurizer in steel manufacturing.
The iron & steel industry is a leading consumer of silicon alloys. Steel production across the globe increased by 3.4% in 2018. Global crude steel production stood at 1869.9 million tons in 2019.
Consumption of steel has been rising at a rapid pace, especially in infrastructure projects such as highways, commercial and residential buildings, airports, and rail projects. The manufacturing sector is also an important end-user of the iron & steel industry. The value and volume growth of the silicon alloys market is directly linked to the rapid transformation of the iron & steel industry. Almost 85% of ferrosilicon is used in the manufacture of iron and steel. Thus, the iron & steel industry is a key consumer of ferrosilicon.
According to the latest report published by Transparency Market Research, the global silicon alloys market is projected to advance at a fair growth rate during the forecast period, owing to its wide applications in the steel and iron industry.
The automotive sector is a large-scale consumer of steel and cast iron products, wherein ferrosilicon is used. The global automotive industry, comprising passenger cars, trucks, and heavy-duty vehicles is anticipated to propel at a significant pace during the forecast period. Around 91.5 million units of passenger cars and commercial vehicles were produced in 2018. Global sales of cars and commercial vehicles have also increased at a steady pace in the past five years.
Sales of vehicles have been rising due to a rise in the disposable income of consumers and availability of easy finance options. These have made it easier to purchase cars. Therefore, an increase in production and sales of automobiles is estimated to propel the demand for cast iron and steel in the automotive industry. Thus, the value & volume growth of the global automotive industry and a rise in sales of automobiles are projected to drive the demand for silicon alloys during the forecast period.
Based on application, the global silicon alloys market has been classified into carbon steel & other alloy steel, stainless steel, electrical steel, cast iron, and others. Carbon steel & other alloy steel held a significant share of 45.8% of the market in 2021. It is estimated to grow at a CAGR of 5.38% during the forecast period. Demand for carbon steel & other alloy steel is increasing mostly due to a rise in the demand for steel, and iron in the automotive industry.
The stainless steel segment held a key share of the global silicon alloys market in 2021. The segment is anticipated to grow at a significant pace during the forecast period, primarily due to an increase in the demand for stainless steel from the infrastructure, chemical, power, oil & gas, and other end-user industries due to its corrosion resistance and high strength.
In terms of CAGR, stainless steel is anticipated to be a highly attractive segment of the market during the forecast period. This is due to rapid industrialization, especially in emerging economies, which is fueling the demand for stainless steel owing to its high corrosion resistance, high strength, and high ductility applications. An increase in usage of stainless steel in the infrastructure, chemicals, oil &gas, power, and automotive end-user industries is likely to boost the attractiveness of the segment.
Ferrosilicon is an intensive power consumer industry. Around 50% to 70% of production cost is spent on power consumption in the industry. An increase in power costs is expected to adversely affect the industry. Power cuts and power shortages, especially in developing nations such as China and India, are also anticipated to negatively impact the functioning of ferrosilicon plants.
Carbonaceous reducing agents are employed in the production of ferrosilicon. Extensive usage of reducing agents compromises the quality of final products. Furthermore, a company that produces byproducts — these are formed due to the presence of reducing agents — is liable to face certain environmental regulations.
In terms of value, Asia Pacific accounted for a notable share of 66.6% of the market in 2021. It is estimated to grow at a CAGR of 5.6% during the forecast period. The region is anticipated to create a significant opportunity of US$ 11,559.7 Mn during the forecast period. The market in the region is likely to advance at a rapid pace in the near future. This can be primarily ascribed to a rise in the demand for iron & steel and ferrosilicon in the region and rapid industrialization, especially in developing economies such as China and India.
Europe held a significant share of 16.4% of the global market in 2021. This can be ascribed to the demand for silicon alloys from Germany and Russia & CIS countries.
North America is a prominent region of the global silicon alloys market. The market in the region is likely to create an incremental opportunity of US$ 1833.5 Mn during the forecast period. The Middle East & Africa and Latin America held a relatively minor share of the global silicon market in 2021.
The global silicon alloys market is consolidated with a small number of large-scale vendors controlling a majority of the market share. An increasing number of firms are spending significantly on comprehensive research and development, primarily to enhance properties at elevated temperatures for silicon alloys.
Diversification of product portfolios and mergers and acquisitions are the key strategies adopted by the key players. Ferroglobe, Elkem ASA, OM Holdings Ltd., RFA International, Dragon Northwest Ferroalloy Co.,Ltd, Kuwait United Chemalloys Manufacturing, DMS Powder (Pty) Ltd, SKP Group, American Elements, Arcelor Mittal, Jindal Stainless Ltd., Metal & Alloys Corporation, Georgian American Alloys, Lalwani Ferro Alloy ltd., Pioneer Carbide Pvt Ltd., Tata Steel Ltd., and Steelmin Ltd., are the prominent entities operating in the market.
Each of these players has been profiled in the silicon alloys market report based on parameters such as company overview, financial overview, business strategies, product portfolio, business segments, and recent developments.
|
Attribute |
Detail |
|
Market Size Value in 2021 |
US$ 10 Bn |
|
Market Forecast Value in 2031 |
US$ 17.3 Bn |
|
Growth Rate (CAGR) |
5.6% |
|
Forecast Period |
2022–2031 |
|
Historical Data Available for |
2020 |
|
Quantitative Units |
US$ Mn for Value & Kilo Tons for Volume |
|
Market Analysis |
It includes cross segment analysis at global as well as regional level. Furthermore, qualitative analysis includes drivers, restraints, opportunities, key trends, Porter’s Five Forces analysis, value chain analysis, and key trend analysis. |
|
Competition Landscape |
|
|
Format |
Electronic (PDF) + Excel |
|
Market Segmentation |
|
|
Regions Covered |
|
|
Countries Covered |
|
|
Companies Profiled |
|
|
Customization Scope |
Available upon request |
|
Pricing |
Available upon request |
The market size of silicon alloys stood over US$ 10 Bn in 2021.
The silicon alloys market is expected to expand at a CAGR of 5.6% from 2022 to 2031.
Rising demand for silicon alloys from steel, iron, and automobile industries; and rapid industrialization and infrastructure development in emerging economies are key factors that are driving the silicon alloys market.
The carbon steel & other alloy steel segment accounted for a major share of 45.8% of the silicon alloys market in 2021. This is due to use of ferrosilicon in the production of steel and other alloys.
Asia Pacific is a more attractive region for vendors in the silicon alloys market due to the presence of iron and steel manufacturing plants in the region.
Key players operating in the silicon alloys market include Ferroglobe, Elkem ASA, OM Holdings Ltd., RFA International, Dragon Northwest Ferroalloy Co.,Ltd, Kuwait United Chemalloys Manufacturing, DMS Powder (Pty) Ltd, SKP Group, American Elements, Arcelor Mittal, Jindal Stainless Ltd., Metal & Alloys Corporation, Georgian American Alloys, Lalwani Ferro Alloy ltd., Pioneer Carbide Pvt Ltd., Tata Steel Ltd., and Steelmin Ltd.
1. Executive Summary
1.1. Silicon Alloys Market Snapshot
1.2. Current Market and Future Potential
2. Market Overview
2.1. Market Segmentation
2.2. Market Trends
2.3. Market Dynamics
2.3.1. Drivers
2.3.2. Restraints
2.3.3. Opportunities
2.4. Porter’s Five Forces Analysis
2.5. Regulatory Analysis
2.6. Value Chain Analysis
2.6.1. List of Raw Material Providers – Metallic Iron
2.6.2. List of Raw Material Providers - Silica
2.6.3. List of Raw Material Providers – Carbonaceous Reducing Agent
2.6.4. List of Key Manufacturers
2.6.5. List of Suppliers/ Distributors
2.6.6. List of Potential Customers
2.6.7. Production Overview/ Route of Synthesis
3. COVID-19 Impact Analysis
4. Production Output Analysis, 2021
5. Price Trend Analysis
6. Global Silicon Alloys Market Analysis and Forecast, by Type, 2020–2031
6.1. Introduction and Definitions
6.2. Global Silicon Alloys Market Volume (Kilo tons) and Value (US$ Mn) Forecast, by Type, 2020–2031
6.2.1. Ferrosilicon
6.2.1.1. Deoxidizers
6.2.1.2. Inoculants
6.2.1.3. Others
6.3. Global Silicon Alloys Market Attractiveness, by Type
7. Global Silicon Alloys Market Analysis and Forecast, by Application, 2020–2031
7.1. Introduction and Definitions
7.2. Global Silicon Alloys Market Volume (Kilo tons) and Value (US$ Mn) Forecast, by Application, 2020–2031
7.2.1. Carbon Steel & Other Alloy Steel
7.2.2. Stainless Steel
7.2.3. Electrical Steel
7.2.4. Cast Iron
7.2.5. Others
7.3. Global Silicon Alloys Market Attractiveness, by Application
8. Global Silicon Alloys Market Analysis and Forecast, by Region, 2020–2031
8.1. Key Findings
8.2. Global Silicon Alloys Market Volume (Kilo tons) and Value (US$ Mn) Forecast, by Region, 2020–2031
8.2.1. North America
8.2.2. Europe
8.2.3. Asia Pacific
8.2.4. Middle East & Africa
8.2.5. Latin America
8.3. Global Silicon Alloys Market Attractiveness, by Region
9. North America Silicon Alloys Market Analysis and Forecast, 2020–2031
9.1. Key Findings
9.2. North America Silicon Alloys Market Volume (Kilo tons) and Value (US$ Mn) Forecast, by Type, 2020–2031
9.3. North America Silicon Alloys Market Volume (Kilo tons) and Value (US$ Mn) Forecast, by Application, 2020–2031
9.4. North America Silicon Alloys Market Volume (Kilo tons) and Value (US$ Mn) Forecast, by Country, 2020–2031
9.4.1. U.S. Silicon Alloys Market Volume (Kilo tons) and Value (US$ Mn) Forecast, by Type, 2020–2031
9.4.2. U.S. Silicon Alloys Market Volume (Kilo tons) and Value (US$ Mn) Forecast, by Application, 2020–2031
9.4.3. Canada Silicon Alloys Market Volume (Kilo tons) and Value (US$ Mn) Forecast, by Type, 2020–2031
9.4.4. Canada Silicon Alloys Market Volume (Kilo tons) and Value (US$ Mn) Forecast, by Application, 2020–2031
9.5. North America Silicon Alloys Market Attractiveness Analysis
10. Europe Silicon Alloys Market Analysis and Forecast, 2020–2031
10.1. Key Findings
10.2. Europe Silicon Alloys Market Volume (Kilo tons) and Value (US$ Mn) Forecast, by Type, 2020–2031
10.3. Europe Silicon Alloys Market Volume (Kilo tons) and Value (US$ Mn) Forecast, by Application, 2020–2031
10.4. Europe Silicon Alloys Market Volume (Kilo tons) and Value (US$ Mn) Forecast, by Country and Sub-region, 2022-2031
10.4.1. Germany Silicon Alloys Market Volume (Kilo tons) and Value (US$ Mn) Forecast, by Type, 2020–2031
10.4.2. Germany Silicon Alloys Market Volume (Kilo tons) and Value (US$ Mn) Forecast, by Application, 2020–2031
10.4.3. France Silicon Alloys Market Volume (Kilo tons) and Value (US$ Mn) Forecast, by Type, 2020–2031
10.4.4. France Silicon Alloys Market Volume (Kilo tons) and Value (US$ Mn) Forecast, by Application, 2020–2031
10.4.5. U.K. Silicon Alloys Market Volume (Kilo tons) and Value (US$ Mn) Forecast, by Type, 2020–2031
10.4.6. U.K. Silicon Alloys Market Volume (Kilo tons) and Value (US$ Mn) Forecast, by Application, 2020–2031
10.4.7. Italy Silicon Alloys Market Volume (Kilo tons) and Value (US$ Mn) Forecast, by Type, 2020–2031
10.4.8. Italy Silicon Alloys Market Volume (Kilo tons) and Value (US$ Mn) Forecast, by Application, 2020–2031
10.4.9. Russia & CIS Silicon Alloys Market Volume (Kilo tons) and Value (US$ Mn) Forecast, by Type, 2020–2031
10.4.10. Russia & CIS Silicon Alloys Market Volume (Kilo tons) and Value (US$ Mn) Forecast, by Application, 2020–2031
10.4.11. Rest of Europe Silicon Alloys Market Volume (Kilo tons) and Value (US$ Mn) Forecast, by Type, 2020–2031
10.4.12. Rest of Europe Silicon Alloys Market Volume (Kilo tons) and Value (US$ Mn) Forecast, by Application, 2020–2031
10.5. Europe Silicon Alloys Market Attractiveness Analysis
11. Asia Pacific Silicon Alloys Market Analysis and Forecast, 2020–2031
11.1. Key Findings
11.2. Asia Pacific Silicon Alloys Market Volume (Kilo tons) and Value (US$ Mn) Forecast, by Type
11.3. Asia Pacific Silicon Alloys Market Volume (Kilo tons) and Value (US$ Mn) Forecast, by Application, 2020–2031
11.4. Asia Pacific Silicon Alloys Market Volume (Kilo tons) and Value (US$ Mn) Forecast, by Country and Sub-region, 2022-2031
11.4.1. China Silicon Alloys Market Volume (Kilo tons) and Value (US$ Mn) Forecast, by Type, 2020–2031
11.4.2. China Silicon Alloys Market Volume (Kilo tons) and Value (US$ Mn) Forecast, by Application, 2020–2031
11.4.3. Japan Silicon Alloys Market Volume (Kilo tons) and Value (US$ Mn) Forecast, by Type, 2020–2031
11.4.4. Japan Silicon Alloys Market Volume (Kilo tons) and Value (US$ Mn) Forecast, by Application, 2020–2031
11.4.5. India Silicon Alloys Market Volume (Kilo tons) and Value (US$ Mn) Forecast, by Type, 2020–2031
11.4.6. India Silicon Alloys Market Volume (Kilo tons) and Value (US$ Mn) Forecast, by Application, 2020–2031
11.4.7. ASEAN Silicon Alloys Market Volume (Kilo tons) and Value (US$ Mn) Forecast, by Type, 2020–2031
11.4.8. ASEAN Silicon Alloys Market Volume (Kilo tons) and Value (US$ Mn) Forecast, by Application, 2020–2031
11.4.9. Rest of Asia Pacific Silicon Alloys Market Volume (Kilo tons) and Value (US$ Mn) Forecast, by Type, 2020–2031
11.4.10. Rest of Asia Pacific Silicon Alloys Market Volume (Kilo tons) and Value (US$ Mn) Forecast, by Application, 2020–2031
11.5. Asia Pacific Silicon Alloys Market Attractiveness Analysis
12. Latin America Silicon Alloys Market Analysis and Forecast, 2020–2031
12.1. Key Findings
12.2. Latin America Silicon Alloys Market Volume (Kilo tons) and Value (US$ Mn) Forecast, by Type, 2020–2031
12.3. Latin America Silicon Alloys Market Volume (Kilo tons) and Value (US$ Mn) Forecast, by Application, 2020–2031
12.4. Latin America Silicon Alloys Market Volume (Kilo tons) and Value (US$ Mn) Forecast, by Country and Sub-region, 2022-2031
12.4.1. Brazil Silicon Alloys Market Volume (Kilo tons) and Value (US$ Mn) Forecast, by Type, 2020–2031
12.4.2. Brazil Silicon Alloys Market Volume (Kilo tons) and Value (US$ Mn) Forecast, by Application, 2020–2031
12.4.3. Mexico Silicon Alloys Market Volume (Kilo tons) and Value (US$ Mn) Forecast, by Type, 2020–2031
12.4.4. Mexico Silicon Alloys Market Volume (Kilo tons) and Value (US$ Mn) Forecast, by Application, 2020–2031
12.4.5. Rest of Latin America Silicon Alloys Market Volume (Kilo tons) and Value (US$ Mn) Forecast, by Type, 2020–2031
12.4.6. Rest of Latin America Silicon Alloys Market Volume (Kilo tons) and Value (US$ Mn) Forecast, by Application, 2020–2031
12.5. Latin America Silicon Alloys Market Attractiveness Analysis
13. Middle East & Africa Silicon Alloys Market Analysis and Forecast, 2020–2031
13.1. Key Findings
13.2. Middle East & Africa Silicon Alloys Market Volume (Kilo tons) and Value (US$ Mn) Forecast, by Type, 2020–2031
13.3. Middle East & Africa Silicon Alloys Market Volume (Kilo tons) and Value (US$ Mn) Forecast, by Application, 2020–2031
13.4. Middle East & Africa Silicon Alloys Market Volume (Kilo tons) and Value (US$ Mn) Forecast, by Country and Sub-region, 2022-2031
13.4.1. GCC Silicon Alloys Market Volume (Kilo tons) and Value (US$ Mn) Forecast, by Type, 2020–2031
13.4.2. GCC Silicon Alloys Market Volume (Kilo tons) and Value (US$ Mn) Forecast, by Application, 2020–2031
13.4.3. South Africa Silicon Alloys Market Volume (Kilo tons) and Value (US$ Mn) Forecast, by Type, 2020–2031
13.4.4. South Africa Silicon Alloys Market Volume (Kilo tons) and Value (US$ Mn) Forecast, by Application, 2020–2031
13.4.5. Rest of Middle East & Africa Silicon Alloys Market Volume (Kilo tons) and Value (US$ Mn) Forecast, by Type, 2020–2031
13.4.6. Rest of Middle East & Africa Silicon Alloys Market Volume (Kilo tons) and Value (US$ Mn) Forecast, by Application, 2020–2031
13.5. Middle East & Africa Silicon Alloys Market Attractiveness Analysis
14. Competition Landscape
14.1. Global Silicon Alloys Company Market Share Analysis, 2021
14.2. Company Profiles (Details – Overview, Financials, Recent Developments, and Strategy)
14.2.1. Ferroglobe
14.2.1.1. Company Description
14.2.1.2. Business Overview
14.2.1.3. Financial Overview
14.2.1.4. Strategic Overview
14.2.2. Elkem ASA
14.2.2.1. Company Description
14.2.2.2. Business Overview
14.2.2.3. Financial Overview
14.2.2.4. Strategic Overview
14.2.3. OM Holdings Ltd.
14.2.3.1. Company Description
14.2.3.2. Business Overview
14.2.3.3. Financial Overview
14.2.3.4. Strategic Overview
14.2.4. RFA International
14.2.4.1. Company Description
14.2.4.2. Business Overview
14.2.4.3. Financial Overview
14.2.4.4. Strategic Overview
14.2.5. Dragon Northwest Ferroalloy Co.,Ltd
14.2.5.1. Company Description
14.2.5.2. Business Overview
14.2.5.3. Financial Overview
14.2.5.4. Strategic Overview
14.2.6. Kuwait United Chemalloys Manufacturing
14.2.6.1. Company Description
14.2.6.2. Business Overview
14.2.6.3. Financial Overview
14.2.6.4. Strategic Overview
14.2.7. DMS Powder (Pty) Ltd
14.2.7.1. Company Description
14.2.7.2. Business Overview
14.2.7.3. Financial Overview
14.2.7.4. Strategic Overview
14.2.8. SKP Group
14.2.8.1. Company Description
14.2.8.2. Business Overview
14.2.8.3. Financial Overview
14.2.8.4. Strategic Overview
14.2.9. American Elements
14.2.9.1. Company Description
14.2.9.2. Business Overview
14.2.9.3. Financial Overview
14.2.9.4. Strategic Overview
14.2.10. Arcelor Mittal
14.2.10.1. Company Description
14.2.10.2. Business Overview
14.2.10.3. Financial Overview
14.2.10.4. Strategic Overview
14.2.11. Jindal Stainless Ltd
14.2.11.1. Company Description
14.2.11.2. Business Overview
14.2.11.3. Financial Overview
14.2.11.4. Strategic Overview
14.2.12. Metal & Alloys Corporation
14.2.12.1. Company Description
14.2.12.2. Business Overview
14.2.12.3. Financial Overview
14.2.12.4. Strategic Overview
14.2.13. Georgian American Alloys
14.2.13.1. Company Description
14.2.13.2. Business Overview
14.2.13.3. Financial Overview
14.2.13.4. Strategic Overview
14.2.14. Lalwani Ferro Alloys Ltd.
14.2.14.1. Company Description
14.2.14.2. Business Overview
14.2.14.3. Financial Overview
14.2.14.4. Strategic Overview
14.2.15. Pioneer Carbide Pvt Ltd
14.2.15.1. Company Description
14.2.15.2. Business Overview
14.2.15.3. Financial Overview
14.2.15.4. Strategic Overview
14.2.16. Tata Steel Ltd.
14.2.16.1. Company Description
14.2.16.2. Business Overview
14.2.16.3. Financial Overview
14.2.16.4. Strategic Overview
14.2.17. Steelmin Limited
14.2.17.1. Company Description
14.2.17.2. Business Overview
14.2.17.3. Financial Overview
14.2.17.4. Strategic Overview
15. Primary Research: Key Insights
16. Appendix
List of Tables
Table 1: Global Silicon Alloys Market Volume (Kilo tons) Forecast, by Type, 2020–2031
Table 2: Global Silicon Alloys Market Value (US$ Mn) Forecast, by Type, 2020–2031
Table 3: Global Silicon Alloys Market Volume (Kilo tons) Forecast, by Application, 2020–2031
Table 4: Global Silicon Alloys Market Value (US$ Mn) Forecast, by Application, 2020–2031
Table 5: Global Silicon Alloys Market Volume (Kilo tons) Forecast, by Region, 2020–2031
Table 6: Global Silicon Alloys Market Value (US$ Mn) Forecast, by Region, 2020–2031
Table 7: North America Silicon Alloys Market Volume (Kilo tons) Forecast, by Type, 2020–2031
Table 8: North America Silicon Alloys Market Value (US$ Mn) Forecast, by Type, 2020–2031
Table 9: North America Silicon Alloys Market Volume (Kilo tons) Forecast, by Application, 2020–2031
Table 10: North America Silicon Alloys Market Value (US$ Mn) Forecast, by Application, 2020–2031
Table 11: North America Silicon Alloys Market Volume (Kilo tons) Forecast, by Country, 2020–2031
Table 12: North America Silicon Alloys Market Value (US$ Mn) Forecast, by Country, 2020–2031
Table 13: U.S. Silicon Alloys Market Volume (Kilo tons) Forecast, by Type, 2020–2031
Table 14: U.S. Silicon Alloys Market Value (US$ Mn) Forecast, by Type, 2020–2031
Table 15: U.S. Silicon Alloys Market Volume (Kilo tons) Forecast, by Application, 2020–2031
Table 16: U.S. Silicon Alloys Market Value (US$ Mn) Forecast, by Application, 2020–2031
Table 17: Canada Silicon Alloys Market Volume (Kilo tons) Forecast, by Type, 2020–2031
Table 18: Canada Silicon Alloys Market Value (US$ Mn) Forecast, by Type, 2020–2031
Table 19: Canada Silicon Alloys Market Volume (Kilo tons) Forecast, by Application, 2020–2031
Table 20: Canada Silicon Alloys Market Value (US$ Mn) Forecast, by Application, 2020–2031
Table 21: Europe Silicon Alloys Market Volume (Kilo tons) Forecast, by Type, 2020–2031
Table 22: Europe Silicon Alloys Market Value (US$ Mn) Forecast, by Type, 2020–2031
Table 23: Europe Silicon Alloys Market Volume (Kilo tons) Forecast, by Application, 2020–2031
Table 24: Europe Silicon Alloys Market Value (US$ Mn) Forecast, by Application, 2020–2031
Table 25: Europe Silicon Alloys Market Volume (Kilo tons) Forecast, by Country and Sub-region, 2020–2031
Table 26: Europe Silicon Alloys Market Value (US$ Mn) Forecast, by Country and Sub-region, 2020–2031
Table 27: Germany Silicon Alloys Market Volume (Kilo tons) Forecast, by Type, 2020–2031
Table 28: Germany Silicon Alloys Market Value (US$ Mn) Forecast, by Type, 2020–2031
Table 29: Germany Silicon Alloys Market Volume (Kilo tons) Forecast, by Application, 2020–2031
Table 30: Germany Silicon Alloys Market Value (US$ Mn) Forecast, by Application, 2020–2031
Table 31: France Silicon Alloys Market Volume (Kilo tons) Forecast, by Type, 2020–2031
Table 32: France Silicon Alloys Market Value (US$ Mn) Forecast, by Type, 2020–2031
Table 33: France Silicon Alloys Market Volume (Kilo tons) Forecast, by Application, 2020–2031
Table 34: France Silicon Alloys Market Value (US$ Mn) Forecast, by Application, 2020–2031
Table 35: U.K. Silicon Alloys Market Volume (Kilo tons) Forecast, by Type, 2020–2031
Table 36: U.K. Silicon Alloys Market Value (US$ Mn) Forecast, by Type, 2020–2031
Table 37: U.K. Silicon Alloys Market Volume (Kilo tons) Forecast, by Application, 2020–2031
Table 38: U.K. Silicon Alloys Market Value (US$ Mn) Forecast, by Application, 2020–2031
Table 39: Italy Silicon Alloys Market Volume (Kilo tons) Forecast, by Type, 2020–2031
Table 40: Italy Silicon Alloys Market Value (US$ Mn) Forecast, by Type, 2020–2031
Table 41: Italy Silicon Alloys Market Volume (Kilo tons) Forecast, by Application, 2020–2031
Table 42: Italy Silicon Alloys Market Value (US$ Mn) Forecast, by Application, 2020–2031
Table 43: Spain Silicon Alloys Market Volume (Kilo tons) Forecast, by Type, 2020–2031
Table 44: Spain Silicon Alloys Market Value (US$ Mn) Forecast, by Type, 2020–2031
Table 45: Spain Silicon Alloys Market Volume (Kilo tons) Forecast, by Application, 2020–2031
Table 46: Spain Silicon Alloys Market Value (US$ Mn) Forecast, by Application, 2020–2031
Table 47: Russia & CIS Silicon Alloys Market Volume (Kilo tons) Forecast, by Type, 2020–2031
Table 48: Russia & CIS Silicon Alloys Market Value (US$ Mn) Forecast, by Type, 2020–2031
Table 49: Russia & CIS Silicon Alloys Market Volume (Kilo tons) Forecast, by Application, 2020–2031
Table 50: Russia & CIS Silicon Alloys Market Value (US$ Mn) Forecast, by Application, 2020–2031
Table 51: Rest of Europe Silicon Alloys Market Volume (Kilo tons) Forecast, by Type, 2020–2031
Table 52: Rest of Europe Silicon Alloys Market Value (US$ Mn) Forecast, by Type, 2020–2031
Table 53: Rest of Europe Silicon Alloys Market Volume (Kilo tons) Forecast, by Application, 2020–2031
Table 54: Rest of Europe Silicon Alloys Market Value (US$ Mn) Forecast, by Application, 2020–2031
Table 55: Asia Pacific Silicon Alloys Market Volume (Kilo tons) Forecast, by Type, 2020–2031
Table 56: Asia Pacific Silicon Alloys Market Value (US$ Mn) Forecast, by Type, 2020–2031
Table 57: Asia Pacific Silicon Alloys Market Volume (Kilo tons) Forecast, by Application, 2020–2031
Table 58: Asia Pacific Silicon Alloys Market Value (US$ Mn) Forecast, by Application, 2020–2031
Table 59: Asia Pacific Silicon Alloys Market Volume (Kilo tons) Forecast, by Country and Sub-region, 2020–2031
Table 60: Asia Pacific Silicon Alloys Market Value (US$ Mn) Forecast, by Country and Sub-region, 2020–2031
Table 61: China Silicon Alloys Market Volume (Kilo tons) Forecast, by Type, 2020–2031
Table 62: China Silicon Alloys Market Value (US$ Mn) Forecast, by Type 2020–2031
Table 63: China Silicon Alloys Market Volume (Kilo tons) Forecast, by Application, 2020–2031
Table 64: China Silicon Alloys Market Value (US$ Mn) Forecast, by Application, 2020–2031
Table 65: Japan Silicon Alloys Market Volume (Kilo tons) Forecast, by Type, 2020–2031
Table 66: Japan Silicon Alloys Market Value (US$ Mn) Forecast, by Type, 2020–2031
Table 67: Japan Silicon Alloys Market Volume (Kilo tons) Forecast, by Application, 2020–2031
Table 68: Japan Silicon Alloys Market Value (US$ Mn) Forecast, by Application, 2020–2031
Table 69: India Silicon Alloys Market Volume (Kilo tons) Forecast, by Type, 2020–2031
Table 70: India Silicon Alloys Market Value (US$ Mn) Forecast, by Type, 2020–2031
Table 71: India Silicon Alloys Market Volume (Kilo tons) Forecast, by Application, 2020–2031
Table 72: India Silicon Alloys Market Value (US$ Mn) Forecast, by Application, 2020–2031
Table 73: India Silicon Alloys Market Volume (Kilo tons) Forecast, by Application, 2020–2031
Table 74: India Silicon Alloys Market Value (US$ Mn) Forecast, by Application 2020–2031
Table 75: ASEAN Silicon Alloys Market Volume (Kilo tons) Forecast, by Type, 2020–2031
Table 76: ASEAN Silicon Alloys Market Value (US$ Mn) Forecast, by Type, 2020–2031
Table 77: ASEAN Silicon Alloys Market Volume (Kilo tons) Forecast, by Application, 2020–2031
Table 78: ASEAN Silicon Alloys Market Value (US$ Mn) Forecast, by Application, 2020–2031
Table 79: Rest of Asia Pacific Silicon Alloys Market Volume (Kilo tons) Forecast, by Type, 2020–2031
Table 80: Rest of Asia Pacific Silicon Alloys Market Value (US$ Mn) Forecast, by Type, 2020–2031
Table 81: Rest of Asia Pacific Silicon Alloys Market Volume (Kilo tons) Forecast, by Application, 2020–2031
Table 82: Rest of Asia Pacific Silicon Alloys Market Value (US$ Mn) Forecast, by Application, 2020–2031
Table 83: Latin America Silicon Alloys Market Volume (Kilo tons) Forecast, by Type, 2020–2031
Table 84: Latin America Silicon Alloys Market Value (US$ Mn) Forecast, by Type, 2020–2031
Table 85: Latin America Silicon Alloys Market Volume (Kilo tons) Forecast, by Application, 2020–2031
Table 86: Latin America Silicon Alloys Market Value (US$ Mn) Forecast, by Application, 2020–2031
Table 87: Latin America Silicon Alloys Market Volume (Kilo tons) Forecast, by Country and Sub-region, 2020–2031
Table 88: Latin America Silicon Alloys Market Value (US$ Mn) Forecast, by Country and Sub-region, 2020–2031
Table 89: Brazil Silicon Alloys Market Volume (Kilo tons) Forecast, by Type, 2020–2031
Table 90: Brazil Silicon Alloys Market Value (US$ Mn) Forecast, by Type, 2020–2031
Table 91: Brazil Silicon Alloys Market Volume (Kilo tons) Forecast, by Application, 2020–2031
Table 92: Brazil Silicon Alloys Market Value (US$ Mn) Forecast, by Application, 2020–2031
Table 93: Mexico Silicon Alloys Market Volume (Kilo tons) Forecast, by Type, 2020–2031
Table 94: Mexico Silicon Alloys Market Value (US$ Mn) Forecast, by Type, 2020–2031
Table 95: Mexico Silicon Alloys Market Volume (Kilo tons) Forecast, by Application, 2020–2031
Table 96: Mexico Silicon Alloys Market Value (US$ Mn) Forecast, by Application, 2020–2031
Table 97: Rest of Latin America Silicon Alloys Market Volume (Kilo tons) Forecast, by Type, 2020–2031
Table 98: Rest of Latin America Silicon Alloys Market Value (US$ Mn) Forecast, by Type, 2020–2031
Table 99: Rest of Latin America Silicon Alloys Market Volume (Kilo tons) Forecast, by Application, 2020–2031
Table 100: Rest of Latin America Silicon Alloys Market Value (US$ Mn) Forecast, by Application, 2020–2031
Table 101: Middle East & Africa Silicon Alloys Market Volume (Kilo tons) Forecast, by Type, 2020–2031
Table 102: Middle East & Africa Silicon Alloys Market Value (US$ Mn) Forecast, by Type, 2020–2031
Table 103: Middle East & Africa Silicon Alloys Market Volume (Kilo tons) Forecast, by Application, 2020–2031
Table 104: Middle East & Africa Silicon Alloys Market Value (US$ Mn) Forecast, by Application, 2020–2031
Table 105: Middle East & Africa Silicon Alloys Market Volume (Kilo tons) Forecast, by Country and Sub-region, 2020–2031
Table 106: Middle East & Africa Silicon Alloys Market Value (US$ Mn) Forecast, by Country and Sub-region, 2020–2031
Table 107: GCC Silicon Alloys Market Volume (Kilo tons) Forecast, by Type, 2020–2031
Table 108: GCC Silicon Alloys Market Value (US$ Mn) Forecast, by Type, 2020–2031
Table 109: GCC Silicon Alloys Market Volume (Kilo tons) Forecast, by Application, 2020–2031
Table 110: GCC Silicon Alloys Market Value (US$ Mn) Forecast, by Application, 2020–2031
Table 111: South Africa Silicon Alloys Market Volume (Kilo tons) Forecast, by Type, 2020–2031
Table 112: South Africa Silicon Alloys Market Value (US$ Mn) Forecast, by Type, 2020–2031
Table 113: South Africa Silicon Alloys Market Volume (Kilo tons) Forecast, by Application, 2020–2031
Table 114: South Africa Silicon Alloys Market Value (US$ Mn) Forecast, by Application, 2020–2031
Table 115: Rest of Middle East & Africa Silicon Alloys Market Volume (Kilo tons) Forecast, by Type, 2020–2031
Table 116: Rest of Middle East & Africa Silicon Alloys Market Value (US$ Mn) Forecast, by Type, 2020–2031
Table 117: Rest of Middle East & Africa Silicon Alloys Market Volume (Kilo tons) Forecast, by Application, 2020–2031
Table 118: Rest of Middle East & Africa Silicon Alloys Market Value (US$ Mn) Forecast, by Application, 2020–2031
List of Figures
Figure 1: Global Silicon Alloys Market Volume Share Analysis, by Type, 2021, 2025, and 2031
Figure 2: Global Silicon Alloys Market Attractiveness, by Type
Figure 3: Global Silicon Alloys Market Volume Share Analysis, by Application, 2021, 2025, and 2031
Figure 4: Global Silicon Alloys Market Attractiveness, by Application
Figure 5: Global Silicon Alloys Market Volume Share Analysis, by Region, 2021, 2025, and 2031
Figure 6: Global Silicon Alloys Market Attractiveness, by Region
Figure 7: North America Silicon Alloys Market Volume Share Analysis, by Type, 2021, 2025, and 2031
Figure 8: North America Silicon Alloys Market Attractiveness, by Type
Figure 9: North America Silicon Alloys Market Attractiveness, by Type
Figure 10: North America Silicon Alloys Market Volume Share Analysis, by Application, 2021, 2025, and 2031
Figure 11: North America Silicon Alloys Market Attractiveness, by Application
Figure 12: North America Silicon Alloys Market Attractiveness, by Country
Figure 13: Europe Silicon Alloys Market Volume Share Analysis, by Type, 2021, 2025, and 2031
Figure 14: Europe Silicon Alloys Market Attractiveness, by Type
Figure 15: Europe Silicon Alloys Market Volume Share Analysis, by Application, 2021, 2025, and 2031
Figure 16: Europe Silicon Alloys Market Attractiveness, by Application
Figure 17: Europe Silicon Alloys Market Volume Share Analysis, by Country and Sub-region, 2021, 2025, and 2031
Figure 18: Europe Silicon Alloys Market Attractiveness, by Country and Sub-region
Figure 19: Asia Pacific Silicon Alloys Market Volume Share Analysis, by Type, 2021, 2025, and 2031
Figure 20: Asia Pacific Silicon Alloys Market Attractiveness, by Type
Figure 21: Asia Pacific Silicon Alloys Market Volume Share Analysis, by Application, 2021, 2025, and 2031
Figure 22: Asia Pacific Silicon Alloys Market Attractiveness, by Application
Figure 23: Asia Pacific Silicon Alloys Market Volume Share Analysis, by Country and Sub-region, 2021, 2025, and 2031
Figure 24: Asia Pacific Silicon Alloys Market Attractiveness, by Country and Sub-region
Figure 25: Latin America Silicon Alloys Market Volume Share Analysis, by Type, 2021, 2025, and 2031
Figure 26: Latin America Silicon Alloys Market Attractiveness, by Type
Figure 27: Latin America Silicon Alloys Market Volume Share Analysis, by Application, 2021, 2025, and 2031
Figure 28: Latin America Silicon Alloys Market Attractiveness, by Application
Figure 29: Latin America Silicon Alloys Market Volume Share Analysis, by Country and Sub-region, 2021, 2025, and 2031
Figure 30: Latin America Silicon Alloys Market Attractiveness, by Country and Sub-region
Figure 31: Middle East & Africa Silicon Alloys Market Volume Share Analysis, by Type, 2021, 2025, and 2031
Figure 32: Middle East & Africa Silicon Alloys Market Attractiveness, by Type
Figure 33: Middle East & Africa Silicon Alloys Market Volume Share Analysis, by Application, 2021, 2025, and 2031
Figure 34: Middle East & Africa Silicon Alloys Market Attractiveness, by Application
Figure 35: Middle East & Africa Silicon Alloys Market Volume Share Analysis, by Country and Sub-region, 2021, 2025, and 2031
Figure 36: Middle East & Africa Silicon Alloys Market Attractiveness, by Country and Sub-region
Copyright © Transparency Market Research, Inc. All Rights reserved
Trust Online

Silicon Alloys Market