
Reports
Reports
Analysts’ Viewpoint on Sewage Submersible Pump Market Scenario
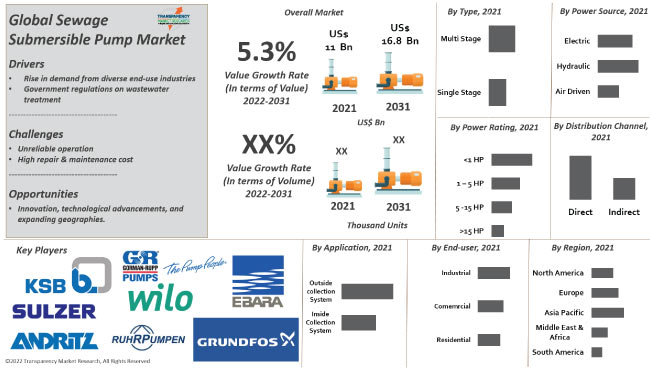
Rise in the number of residential dwellings leads to the generation of residential sewage, thereby increasing the need for wastewater treatment facilities, which in turn drives the demand for submersible sewage pumps. Additionally, increased government initiatives for wastewater treatment and environmental consciousness to conserve and reuse water globally are key factors driving the submersible wastewater pump market. The sewage submersible pumps market is estimated to grow at a decent pace during the forecast period, due to increase in adoption of electric submersible sewage pumps in residential and commercial sectors. However, technical issues and the maintenance cost may hamper the market. Trends in the submersible drainage pumps industry suggest that submersible sewage pump manufacturers operating in the sewage pumps market are focusing on introduction of new products with the help of technology in order to keep their businesses growing and to stay ahead of the competition. Demand for sewage pumps is expected to be high in applications such as raw/waste water treatment, drainage, dewatering, etc., for pumping excess water from work sites, basements, or rainwater flooded. The sewage submersible pumps system market is also expected to witness an increase in product diversity, as rising number of global companies with R&D capabilities are expected to enter the arena of submersible pump manufacturing to gain maximum submersible sewage pump market share.
A sewage submersible pump, also called as submersible wastewater pump, is a piece of electrical equipment that is designed to work when it is submerged in water. It is used to transport waste by directing the flow of sewage water towards a sewage treatment facility. Different types of submersible wastewater pumps are available, and they vary according to usage. For instance, a residential home would need a light model, i.e. low capacity electric submersible sewage pump, while a commercial or industrial property would need a heavy duty submersible sewage pump. Usually, hydraulic sewage submersible pumps or air operated submersible pumps are preferred in an industrial setup due to their increased efficiency in terms of generating power output. The most important thing about submersible wastewater pumps is that they have a sealed watertight design to prevent liquid from entering the mechanical parts of the unit; however, leakages may occur due to unnoticed wear and tear of seals.
The sewage submersible pump market is projected to expand at a decent growth rate during the forecast period due to increasing demand from end-use industries such as construction, agriculture, etc., as they are more effective and these pumps use direct pressure technology to release fluid. Sewage pumps provides cost-saving solutions to end-users, as they are efficient and save energy. Moreover these pumps don’t have to be primed before operating.
Sewage submersible pumps transport sewage and untreated wastewater, i.e. raw waste water. They are most commonly used in wastewater treatment, agriculture, food & beverage, bio gas, and construction industries. These industries emphasize on wastewater treatment, and therefore, need submersible pumps that can move fluids and solid waste from the input point to the discharge point without obstructing flow.
According to Oxford Economics, construction of infrastructure is projected to grow at 6.8% in 2021, and it is predicted to be the fastest growing sub-sector to 2030 with expected average annual growth of almost 4%. The global construction market was valued at US$10.7 trillion in 2020, and it is expected to grow by US$ 4.5 trillion between 2020 and 2030 to reach US$15.2 trillion, with US$ 8.9 trillion in emerging markets in 2030.
Urbanization is expected to rise at a rapid pace in emerging markets. The top three countries in terms of growth are China, the U.S., and India. India is expected to account for 57% of all global growth in the construction and engineering markets by 2030, amounting to US$ 4.5 trillion. Emerging economies would be looking to develop energy, transport networks, sewage and waste systems, and other large-scale projects. Expanding construction and infrastructure sectors are also likely to fuel the demand for efficient sewage and wastewater treatment, which in turn is estimated to drive the demand for submersible sewage pumps during the forecast period.
A common byproduct of modern lifestyle includes wastewater, which can either be in the form of water running down the shower or runoff from wet roads. This wastewater is unfit for human consumption or use. On a global level, regional governments are adopting methods and measures in order to save and reuse wastewater by employing wastewater treatment technologies that filter and treat the wastewater by removing contaminants such as sewage and chemicals. Thus, increasing government measures to treat wastewater is further boosting the demand for submersible wastewater pumps globally.
Globally, two million tons of sewage, industrial and agricultural waste is discharged into the world’s waterways. Efficiently investing in wastewater and other sanitation infrastructure is crucial to achieve public health benefits, improve the environment, and enhance quality of life. According to Jennifer Sara, Global Director, World Bank Water Global Practice, “At a time when 36% of the world’s population lives in water-scarce regions, wastewater treatment for reuse is part of the solution to water scarcity and pollution problems”. “Once treated, it can be used to replace freshwater for irrigation, industrial processes, or recreational purposes”.
The Drinking Water and Wastewater Infrastructure Act of 2021 includes US$ 55 billion in funding for the restoration and improvement of water and wastewater systems in the U.S. Clean and safe potable water is a main priority, with US$ 15 billion in funding dedicated to the identification, replacement, and monitoring of lead service lines. Therefore, governments in the different parts of the world are emphasizing on wastewater treatment, which is creating a positive environment for submersible sewage pump in the global market.
Asia Pacific dominates the global sewage submersible pump market with maximum share owing to growth in various end-use industries such as construction, agriculture, mining, etc., across China, India, and other countries in the region. Manufacturers operating in the region continue to focus on maximizing the potential of sewage submersible pump for wastewater treatment and related applications through technological advancements in order to expand their submersible sewage pump market size. Marketing strategies for sewage submersible pumps keep evolving owing to the changing government policies for waste water treatment industries and systematic adoption of technology.
The market in Europe and North America is anticipated to grow at a considerable pace in the near future owing to rise in the demand for sewage submersible pumps for water treatment and favorable government policies to clean and reuse wastewater in various sectors such as agriculture and industrial.
Prominent submersible sewage pump suppliers and manufacturers are spending significantly on comprehensive research and development to introduce new products. Statistics obtained from the sewage submersible pump industry indicate expansion of product portfolios and mergers and acquisitions are the major strategies adopted by key players. KSB SE & Co. KGaA, Grundfos Holding A/S, EBARA CORPORATION, The Gorman-Rupp Company, ANDRITZ, Sulzer Ltd, Ruhrpumpen Group, TSURUMI MANUFACTURING CO., LTD., WILO SE, Crompton Greaves and Consumer Electricals Limited. are the prominent entities operating in this market.
Each of these players has been profiled in the sewage submersible pumps market report based on parameters such as company overview, financial overview, business strategies, product portfolio, business segments, and recent developments.
|
Attribute |
Detail |
|
Market Size Value in 2021 |
US$ 11 Bn |
|
Market Forecast Value in 2031 |
US$ 16.8 Bn |
|
Growth Rate (CAGR) |
5.3 % |
|
Forecast Period |
2022–2031 |
|
Historical Data Available for |
2017–2020 |
|
Quantitative Units |
US$ Bn for Value & Thousand Units for Volume |
|
Market Analysis |
Includes cross segment analysis at regional as well as country level. Furthermore, qualitative analysis includes drivers, restraints, opportunities, key trends, Porter’s Five Forces analysis, value chain analysis, and key trend analysis. |
|
Competition Landscape |
|
|
Format |
Electronic (PDF) + Excel |
|
Market Segmentation |
|
|
Region Covered |
|
|
Countries Covered |
|
|
Companies Profiled |
|
|
Customization Scope |
Available upon request |
|
Pricing |
Available upon request |
The global sewage submersible pump market was valued at US$ 11 Bn in 2021.
The global sewage submersible pump market is projected to grow at a CAGR of 5.3% from 2022 to 2031.
Increase in adoption of sewage submersible pumps from diverse end-use industries and surge in government regulations for wastewater reuse.
The water & waste water segment accounted for significant share of the global market in 2021.
Asia Pacific is likely to be one of the lucrative markets in the next few years.
KSB SE & Co. KGaA, Grundfos Holding A/S, EBARA CORPORATION, The Gorman-Rupp Company, ANDRITZ, Sulzer Ltd, Ruhrpumpen Group, TSURUMI MANUFACTURING CO., LTD., WILO SE, Crompton Greaves Consumer Electricals Limited.
1. Preface
1.1. Market Definition and Scope
1.2. Market Segmentation
1.3. Key Research Objectives
1.4. Research Highlights
2. Assumptions
3. Research Methodology
4. Executive Summary
5. Market Overview
5.1. Regional Snapshot
5.2. Market Dynamics
5.2.1. Drivers
5.2.2. Restraints
5.2.3. Opportunities
5.3. Key Trends Analysis
5.3.1. Demand Side Analysis
5.3.2. Supply Side Analysis
5.4. Key Market Indicators
5.5. Porter’s Five Forces Analysis
5.6. Value Chain Analysis
5.7. Industry SWOT Analysis
5.8. Technological Overview Analysis
5.9. Regulatory Framework
5.10. Global Sewage Submersible Pump Market Analysis and Forecast, 2017 - 2031
5.10.1. Market Revenue Projections (US$ Billion)
5.10.2. Market Revenue Projections (Thousand Units)
6. Global Sewage Submersible Pump Market Analysis and Forecast, by Type
6.1. Sewage Submersible Pump Market (US$ Bn and Thousand Units) Forecast, by Type, 2017 - 2031
6.1.1. Single Stage
6.1.2. Multi Stage
6.2. Incremental Opportunity, by Type
7. Global Sewage Submersible Pump Market Analysis and Forecast, by Power Source
7.1. Sewage Submersible Pump Market (US$ Bn and Thousand Units) Forecast, by Power Source, 2017 - 2031
7.1.1. Electric
7.1.2. Hydraulic
7.1.3. Air Driven
7.2. Incremental Opportunity, by Power Source
8. Global Sewage Submersible Pump Market Analysis and Forecast, by Power Rating
8.1. Sewage Submersible Pump Market (US$ Bn and Thousand Units) Forecast, by Power Rating, 2017 - 2031
8.1.1. <1 HP
8.1.2. 1 – 5 HP
8.1.3. 5 – 15 HP
8.1.4. >15 HP
8.2. Incremental Opportunity, by Power Rating
9. Global Sewage Submersible Pump Market Analysis and Forecast, by Application
9.1. Sewage Submersible Pump Market (US$ Bn and Thousand Units) Forecast, by Application, 2017 - 2031
9.1.1. Inside Collection Tank/System
9.1.2. Outside Collection Tank/System
9.2. Incremental Opportunity, by Application
10. Global Sewage Submersible Pump Market Analysis and Forecast, by End-user
10.1. Sewage Submersible Pump Market (US$ Bn and Thousand Units) Forecast, by End-user, 2017 - 2031
10.1.1. Residential
10.1.2. Commercial
10.1.3. Industrial
10.1.3.1. Water & Waste Water
10.1.3.2. Construction
10.1.3.3. Food Processing Industries
10.1.3.4. Paper Mills
10.1.3.5. Others
10.2. Incremental Opportunity, by End-user
11. Global Sewage Submersible Pump Market Analysis and Forecast, by Distribution Channel
11.1. Sewage Submersible Pump Market (US$ Bn and Thousand Units) Forecast, by Distribution Channel,2017 - 2031
11.1.1. Direct
11.1.2. Indirect
11.2. Incremental Opportunity, by Distribution Channel
12. Global Sewage Submersible Pump Market Analysis and Forecast, by Region
12.1. Sewage Submersible Pump Market (US$ Bn and Thousand Units), Region, 2017 - 2031
12.1.1. North America
12.1.2. Europe
12.1.3. Asia Pacific
12.1.4. Middle East & Africa
12.1.5. South America
12.2. Incremental Opportunity, by Region
13. North America Sewage Submersible Pump Market Analysis and Forecast
13.1. Regional Snapshot
13.2. Price Trend Analysis
13.2.1. Weighted Average Selling Price (US$)
13.3. Key Trends Analysis
13.3.1. Demand Side
13.3.2. Supply Side
13.4. Key Supplier Analysis
13.5. Sewage Submersible Pump Market (US$ Bn and Thousand Units) Forecast, by Type, 2017 - 2031
13.5.1. Single Stage
13.5.2. Multi Stage
13.6. Sewage Submersible Pump Market (US$ Bn and Thousand Units) Forecast, by Power Source, 2017 - 2031
13.6.1. Electric
13.6.2. Hydraulic
13.6.3. Air Driven
13.7. Sewage Submersible Pump Market (US$ Bn and Thousand Units) Forecast, by Power Rating, 2017 - 2031
13.7.1. <1 HP
13.7.2. 1 – 5 HP
13.7.3. 5 – 15 HP
13.7.4. >15 HP
13.8. Sewage Submersible Pump Market (US$ Bn and Thousand Units) Forecast, by Application, 2017 - 2031
13.8.1. Inside Collection Tank/System
13.8.2. Outside Collection Tank/System
13.9. Sewage Submersible Pump Market (US$ Bn and Thousand Units) Forecast, by End-user, 2017 - 2031
13.9.1. Residential
13.9.2. Commercial
13.9.3. Industrial
13.9.3.1. Water & Waste Water
13.9.3.2. Construction
13.9.3.3. Food Processing Industries
13.9.3.4. Paper Mills
13.9.3.5. Others
13.10. Sewage Submersible Pump Market (US$ Bn and Thousand Units) Forecast, by Distribution Channel, 2017 - 2031
13.10.1. Direct
13.10.2. Indirect
13.11. Sewage Submersible Pump Market (US$ Bn and Thousand Units) Forecast, by Country & Sub-region, 2017 - 2031
13.11.1. U.S.
13.11.2. Canada
13.11.3. Rest of North America
13.12. Incremental Opportunity Analysis
14. Europe Sewage Submersible Pump Market Analysis and Forecast
14.1. Regional Snapshot
14.2. Price Trend Analysis
14.2.1. Weighted Average Selling Price (US$)
14.3. Key Trends Analysis
14.3.1. Demand Side
14.3.2. Supply Side
14.4. Key Supplier Analysis
14.5. Sewage Submersible Pump Market (US$ Bn and Thousand Units) Forecast, by Type, 2017 - 2031
14.5.1. Single Stage
14.5.2. Multi Stage
14.6. Sewage Submersible Pump Market (US$ Bn and Thousand Units) Forecast, by Power Source, 2017 - 2031
14.6.1. Electric
14.6.2. Hydraulic
14.6.3. Air Driven
14.7. Sewage Submersible Pump Market (US$ Bn and Thousand Units) Forecast, by Power Rating, 2017 - 2031
14.7.1. <1 HP
14.7.2. 1 – 5 HP
14.7.3. 5 – 15 HP
14.7.4. >15 HP
14.8. Sewage Submersible Pump Market (US$ Bn and Thousand Units) Forecast, by Application, 2017 - 2031
14.8.1. Inside Collection Tank/System
14.8.2. Outside Collection Tank/System
14.9. Sewage Submersible Pump Market (US$ Bn and Thousand Units) Forecast, by End-user, 2017 - 2031
14.9.1. Residential
14.9.2. Commercial
14.9.3. Industrial
14.9.3.1. Water & Waste Water
14.9.3.2. Construction
14.9.3.3. Food Processing Industries
14.9.3.4. Paper Mills
14.9.3.5. Others
14.10. Sewage Submersible Pump Market (US$ Bn and Thousand Units) Forecast, by Distribution Channel, 2017 - 2031
14.10.1. Direct
14.10.2. Indirect
14.11. Sewage Submersible Pump Market (US$ Bn and Thousand Units) Forecast, by Country& Sub-region, 2017 - 2031
14.11.1. U.K
14.11.2. Germany
14.11.3. France
14.11.4. Italy
14.11.5. Rest of Europe
14.12. Incremental Opportunity Analysis
15. Asia Pacific Sewage Submersible Pump Market Analysis and Forecast
15.1. Regional Snapshot
15.2. Price Trend Analysis
15.2.1. Weighted Average Selling Price (US$)
15.3. Key Trends Analysis
15.3.1. Demand Side
15.3.2. Supply Side
15.4. Key Supplier Analysis
15.5. Sewage Submersible Pump Market (US$ Bn and Thousand Units) Forecast, by Type, 2017 - 2031
15.5.1. Single Stage
15.5.2. Multi Stage
15.6. Sewage Submersible Pump Market (US$ Bn and Thousand Units) Forecast, by Power Source, 2017 - 2031
15.6.1. Electric
15.6.2. Hydraulic
15.6.3. Air Driven
15.7. Sewage Submersible Pump Market (US$ Bn and Thousand Units) Forecast, by Power Rating, 2017 - 2031
15.7.1. <1 HP
15.7.2. 1 – 5 HP
15.7.3. 5 – 15 HP
15.7.4. >15 HP
15.8. Sewage Submersible Pump Market (US$ Bn and Thousand Units) Forecast, by Application, 2017 - 2031
15.8.1. Inside Collection Tank/System
15.8.2. Outside Collection Tank/System
15.9. Sewage Submersible Pump Market (US$ Bn and Thousand Units) Forecast, by End-user, 2017 - 2031
15.9.1. Residential
15.9.2. Commercial
15.9.3. Industrial
15.9.3.1. Water & Waste Water
15.9.3.2. Construction
15.9.3.3. Food Processing Industries
15.9.3.4. Paper Mills
15.9.3.5. Others
15.10. Sewage Submersible Pump Market (US$ Bn and Thousand Units) Forecast, by Distribution Channel, 2017 - 2031
15.10.1. Direct
15.10.2. Indirect
15.11. Sewage Submersible Pump Market (US$ Bn and Thousand Units) Forecast, by Country& Sub-region, 2017 - 2031
15.11.1. China
15.11.2. India
15.11.3. Japan
15.11.4. Rest of Asia Pacific
15.12. Incremental Opportunity Analysis
16. Middle East & Africa Sewage Submersible Pump Market Analysis and Forecast
16.1. Regional Snapshot
16.2. Price Trend Analysis
16.2.1. Weighted Average Selling Price (US$)
16.3. Key Trends Analysis
16.3.1. Demand Side
16.3.2. Supply Side
16.4. Key Supplier Analysis
16.5. Sewage Submersible Pump Market (US$ Bn and Thousand Units) Forecast, by Type, 2017 - 2031
16.5.1. Single Stage
16.5.2. Multi Stage
16.6. Sewage Submersible Pump Market (US$ Bn and Thousand Units) Forecast, by Power Source, 2017 - 2031
16.6.1. Electric
16.6.2. Hydraulic
16.6.3. Air Driven
16.7. Sewage Submersible Pump Market (US$ Bn and Thousand Units) Forecast, by Power Rating, 2017 - 2031
16.7.1. <1 HP
16.7.2. 1 – 5 HP
16.7.3. 5 – 15 HP
16.7.4. >15 HP
16.8. Sewage Submersible Pump Market (US$ Bn and Thousand Units) Forecast, by Application, 2017 - 2031
16.8.1. Inside Collection Tank/System
16.8.2. Outside Collection Tank/System
16.9. Sewage Submersible Pump Market (US$ Bn and Thousand Units) Forecast, by End-user, 2017 - 2031
16.9.1. Residential
16.9.2. Commercial
16.9.3. Industrial
16.9.3.1. Water & Waste Water
16.9.3.2. Construction
16.9.3.3. Food Processing Industries
16.9.3.4. Paper Mills
16.9.3.5. Others
16.10. Sewage Submersible Pump Market (US$ Bn and Thousand Units) Forecast, by Distribution Channel, 2017 - 2031
16.10.1. Direct
16.10.2. Indirect
16.11. Sewage Submersible Pump Market (US$ Bn and Thousand Units) Forecast, by Country& Sub-region, 2017 - 2031
16.11.1. GCC
16.11.2. South Africa
16.11.3. Rest of Middle East & Africa
16.12. Incremental Opportunity Analysis
17. South America Sewage Submersible Pump Market Analysis and Forecast
17.1. Regional Snapshot
17.2. Price Trend Analysis
17.2.1. Weighted Average Selling Price (US$)
17.3. Key Trends Analysis
17.3.1. Demand Side
17.3.2. Supply Side
17.4. Key Supplier Analysis
17.5. Sewage Submersible Pump Market (US$ Bn and Thousand Units) Forecast, by Type, 2017 - 2031
17.5.1. Single Stage
17.5.2. Multi Stage
17.6. Sewage Submersible Pump Market (US$ Bn and Thousand Units) Forecast, by Power Source, 2017 - 2031
17.6.1. Electric
17.6.2. Hydraulic
17.6.3. Air Driven
17.7. Sewage Submersible Pump Market (US$ Bn and Thousand Units) Forecast, by Power Rating, 2017 - 2031
17.7.1. <1 HP
17.7.2. 1 – 5 HP
17.7.3. 5 – 15 HP
17.7.4. >15 HP
17.8. Sewage Submersible Pump Market (US$ Bn and Thousand Units) Forecast, by Application, 2017 - 2031
17.8.1. Inside Collection Tank/System
17.8.2. Outside Collection Tank/System
17.9. Sewage Submersible Pump Market (US$ Bn and Thousand Units) Forecast, by End-user, 2017 - 2031
17.9.1. Residential
17.9.2. Commercial
17.9.3. Industrial
17.9.3.1. Water & Waste Water
17.9.3.2. Construction
17.9.3.3. Food Processing Industries
17.9.3.4. Paper Mills
17.9.3.5. Others
17.10. Sewage Submersible Pump Market (US$ Bn and Thousand Units) Forecast, by Distribution Channel, 2017 - 2031
17.10.1. Direct
17.10.2. Indirect
17.11. Sewage Submersible Pump Market (US$ Bn and Thousand Units) Forecast, by Country& Sub-region, 2017 - 2031
17.11.1. Brazil
17.11.2. Rest of South America
17.12. Incremental Opportunity Analysis
18. Competition Landscape
18.1. Market Player – Competition Dashboard
18.2. Market Revenue Share Analysis (%), By Company, (2021)
18.3. Company Profiles (Details – Company Overview, Sales Area/Geographical Presence, Revenue, Strategy & Business Overview)
18.3.1. Andritz Group
18.3.1.1. Company Overview
18.3.1.2. Sales Area/Geographical Presence
18.3.1.3. Revenue
18.3.1.4. Strategy & Business Overview
18.3.2. Crompton Greaves Consumer Electricals Limited.
18.3.2.1. Company Overview
18.3.2.2. Sales Area/Geographical Presence
18.3.2.3. Revenue
18.3.2.4. Strategy & Business Overview
18.3.3. Ebara International Corporation
18.3.3.1. Company Overview
18.3.3.2. Sales Area/Geographical Presence
18.3.3.3. Revenue
18.3.3.4. Strategy & Business Overview
18.3.4. Gorman-Rupp Company
18.3.4.1. Company Overview
18.3.4.2. Sales Area/Geographical Presence
18.3.4.3. Revenue
18.3.4.4. Strategy & Business Overview
18.3.5. Grundfos Holding A/S
18.3.5.1. Company Overview
18.3.5.2. Sales Area/Geographical Presence
18.3.5.3. Revenue
18.3.5.4. Strategy & Business Overview
18.3.6. KSB SE and CO. KGAA
18.3.6.1. Company Overview
18.3.6.2. Sales Area/Geographical Presence
18.3.6.3. Revenue
18.3.6.4. Strategy & Business Overview
18.3.7. Ruhrpumpen Group
18.3.7.1. Company Overview
18.3.7.2. Sales Area/Geographical Presence
18.3.7.3. Revenue
18.3.7.4. Strategy & Business Overview
18.3.8. Sulzer LTD
18.3.8.1. Company Overview
18.3.8.2. Sales Area/Geographical Presence
18.3.8.3. Revenue
18.3.8.4. Strategy & Business Overview
18.3.9. Tsurumi Manufacturing co. Ltd
18.3.9.1. Company Overview
18.3.9.2. Sales Area/Geographical Presence
18.3.9.3. Revenue
18.3.9.4. Strategy & Business Overview
18.3.10. WILO SE
18.3.10.1. Company Overview
18.3.10.2. Sales Area/Geographical Presence
18.3.10.3. Revenue
18.3.10.4. Strategy & Business Overview
19. Key Takeaway
19.1. Identification of Potential Market Spaces
19.1.1. Type
19.1.2. Power Source
19.1.3. Power Rating
19.1.4. Application
19.1.5. End-user
19.1.6. Distribution Channel
19.1.7. Region
19.2. Prevailing Market Risks
List of Tables
Table 1: Global Sewage Submersible Pump Market Value (US$ Bn), by Type, 2017-2031
Table 2: Global Sewage Submersible Pump Market Volume (Thousand Units), by Type 2017-2031
Table 3: Global Sewage Submersible Pump Market Value (US$ Bn), by Power Source, 2017-2031
Table 4: Global Sewage Submersible Pump Market Volume (Thousand Units), by Power Source 2017-2031
Table 5: Global Sewage Submersible Pump Market Value (US$ Bn), by Power Rating, 2017-2031
Table 6: Global Sewage Submersible Pump Market Volume (Thousand Units), by Power Rating 2017-2031
Table 7: Global Sewage Submersible Pump Market Value (US$ Bn), by Application, 2017-2031
Table 8: Global Sewage Submersible Pump Market Volume (Thousand Units), by Application 2017-2031
Table 9: Global Sewage Submersible Pump Market Value (US$ Bn), by End-user, 2017-2031
Table 10: Global Sewage Submersible Pump Market Volume (Thousand Units), by End-user 2017-2031
Table 11: Global Sewage Submersible Pump Market Value (US$ Bn), by Distribution Channel, 2017-2031
Table 12: Global Sewage Submersible Pump Market Volume (Thousand Units), by Distribution Channel 2017-2031
Table 13: Global Sewage Submersible Pump Market Value (US$ Bn), by Region, 2017-2031
Table 14: Global Sewage Submersible Pump Market Volume (Thousand Units), by Region, 2017-2031
Table 15: North America Sewage Submersible Pump Market Value (US$ Bn), by Type, 2017-2031
Table 16: North America Sewage Submersible Pump Market Volume (Thousand Units), by Type 2017-2031
Table 17: North America Sewage Submersible Pump Market Value (US$ Bn), by Power Source, 2017-2031
Table 18: North America Sewage Submersible Pump Market Volume (Thousand Units), by Power Source 2017-2031
Table 19: North America Sewage Submersible Pump Market Value (US$ Bn), by Power Rating, 2017-2031
Table 20: North America Sewage Submersible Pump Market Volume (Thousand Units), by Power Rating 2017-2031
Table 21: North America Sewage Submersible Pump Market Value (US$ Bn), by Application, 2017-2031
Table 22: North America Sewage Submersible Pump Market Volume (Thousand Units), by Application 2017-2031
Table 23: North America Sewage Submersible Pump Market Value (US$ Bn), by End-user, 2017-2031
Table 24: North America Sewage Submersible Pump Market Volume (Thousand Units), by End-user 2017-2031
Table 25: North America Sewage Submersible Pump Market Value (US$ Bn), by Distribution Channel, 2017-2031
Table 26: North America Sewage Submersible Pump Market Volume (Thousand Units), by Distribution Channel 2017-2031
Table 27: North America Sewage Submersible Pump Market Value (US$ Bn), by Country & Sub-region, 2017-2031
Table 28: North America Sewage Submersible Pump Market Volume (Thousand Units), by Country & Sub-region, 2017-2031
Table 29: Europe Sewage Submersible Pump Market Value (US$ Bn), by Type, 2017-2031
Table 30: Europe Sewage Submersible Pump Market Volume (Thousand Units), by Type 2017-2031
Table 31: Europe Sewage Submersible Pump Market Value (US$ Bn), by Power Source, 2017-2031
Table 32: Europe Sewage Submersible Pump Market Volume (Thousand Units), by Power Source 2017-2031
Table 33: Europe Sewage Submersible Pump Market Value (US$ Bn), by Power Rating, 2017-2031
Table 34: Europe Sewage Submersible Pump Market Volume (Thousand Units), by Power Rating 2017-2031
Table 35: Europe Sewage Submersible Pump Market Value (US$ Bn), by Application, 2017-2031
Table 36: Europe Sewage Submersible Pump Market Volume (Thousand Units), by Application 2017-2031
Table 37: Europe Sewage Submersible Pump Market Value (US$ Bn), by End-user, 2017-2031
Table 38: Europe Sewage Submersible Pump Market Volume (Thousand Units), by End-user 2017-2031
Table 39: Europe Sewage Submersible Pump Market Value (US$ Bn), by Distribution Channel, 2017-2031
Table 40: Europe Sewage Submersible Pump Market Volume (Thousand Units), by Distribution Channel 2017-2031
Table 41: Europe Sewage Submersible Pump Market Value (US$ Bn), by Country & Sub-region, 2017-2031
Table 42: Europe Sewage Submersible Pump Market Volume (Thousand Units), by Country & Sub-region, 2017-2031
Table 43: Asia Pacific Sewage Submersible Pump Market Value (US$ Bn), by Type, 2017-2031
Table 44: Asia Pacific Sewage Submersible Pump Market Volume (Thousand Units), by Type 2017-2031
Table 45: Asia Pacific Sewage Submersible Pump Market Value (US$ Bn), by Power Source, 2017-2031
Table 46: Asia Pacific Sewage Submersible Pump Market Volume (Thousand Units), by Power Source 2017-2031
Table 47: Asia Pacific Sewage Submersible Pump Market Value (US$ Bn), by Power Rating, 2017-2031
Table 48: Asia Pacific Sewage Submersible Pump Market Volume (Thousand Units), by Power Rating 2017-2031
Table 49: Asia Pacific Sewage Submersible Pump Market Value (US$ Bn), by Application, 2017-2031
Table 50: Asia Pacific Sewage Submersible Pump Market Volume (Thousand Units), by Application 2017-2031
Table 51: Asia Pacific Sewage Submersible Pump Market Value (US$ Bn), by End-user, 2017-2031
Table 52: Asia Pacific Sewage Submersible Pump Market Volume (Thousand Units), by End-user 2017-2031
Table 53: Asia Pacific Sewage Submersible Pump Market Value (US$ Bn), by Distribution Channel, 2017-2031
Table 54: Asia Pacific Sewage Submersible Pump Market Volume (Thousand Units), by Distribution Channel 2017-2031
Table 55: Asia Pacific Sewage Submersible Pump Market Value (US$ Bn), by Country & Sub-region, 2017-2031
Table 56: Asia Pacific Sewage Submersible Pump Market Volume (Thousand Units), by Country & Sub-region, 2017-2031
Table 57: Middle East & Africa Sewage Submersible Pump Market Value (US$ Bn), by Type, 2017-2031
Table 58: Middle East & Africa Sewage Submersible Pump Market Volume (Thousand Units), by Type 2017-2031
Table 59: Middle East & Africa Sewage Submersible Pump Market Value (US$ Bn), by Power Source, 2017-2031
Table 60: Middle East & Africa Sewage Submersible Pump Market Volume (Thousand Units), by Power Source 2017-2031
Table 61: Middle East & Africa Sewage Submersible Pump Market Value (US$ Bn), by Power Rating, 2017-2031
Table 62: Middle East & Africa Sewage Submersible Pump Market Volume (Thousand Units), by Power Rating 2017-2031
Table 63: Middle East & Africa Sewage Submersible Pump Market Value (US$ Bn), by Application, 2017-2031
Table 64: Middle East & Africa Sewage Submersible Pump Market Volume (Thousand Units), by Application 2017-2031
Table 65: Middle East & Africa Sewage Submersible Pump Market Value (US$ Bn), by End-user, 2017-2031
Table 66: Middle East & Africa Sewage Submersible Pump Market Volume (Thousand Units), by End-user 2017-2031
Table 67: Middle East & Africa Sewage Submersible Pump Market Value (US$ Bn), by Distribution Channel, 2017-2031
Table 68: Middle East & Africa Sewage Submersible Pump Market Volume (Thousand Units), by Distribution Channel 2017-2031
Table 69: Middle East & Africa Sewage Submersible Pump Market Value (US$ Bn), by Country & Sub-region, 2017-2031
Table 70: Middle East & Africa Sewage Submersible Pump Market Volume (Thousand Units), by Country & Sub-region, 2017-2031
Table 71: South America Sewage Submersible Pump Market Value (US$ Bn), by Type, 2017-2031
Table 72: South America Sewage Submersible Pump Market Volume (Thousand Units), by Type 2017-2031
Table 73: South America Sewage Submersible Pump Market Value (US$ Bn), by Power Source, 2017-2031
Table 74: South America Sewage Submersible Pump Market Volume (Thousand Units), by Power Source 2017-2031
Table 75: South America Sewage Submersible Pump Market Value (US$ Bn), by Power Rating, 2017-2031
Table 76: South America Sewage Submersible Pump Market Volume (Thousand Units), by Power Rating 2017-2031
Table 77: South America Sewage Submersible Pump Market Value (US$ Bn), by Application, 2017-2031
Table 78: South America Sewage Submersible Pump Market Volume (Thousand Units), by Application 2017-2031
Table 79: South America Sewage Submersible Pump Market Value (US$ Bn), by End-user, 2017-2031
Table 80: South America Sewage Submersible Pump Market Volume (Thousand Units), by End-user 2017-2031
Table 81: South America Sewage Submersible Pump Market Value (US$ Bn), by Distribution Channel, 2017-2031
Table 82: South America Sewage Submersible Pump Market Volume (Thousand Units), by Distribution Channel 2017-2031
Table 83: South America Sewage Submersible Pump Market Value (US$ Bn), by Country & Sub-region, 2017-2031
Table 84: South America Sewage Submersible Pump Market Volume (Thousand Units), by Country & Sub-region, 2017-2031
List of Figures
Figure 1: Global Sewage Submersible Pump Market Value (US$ Bn), by Type, 2017-2031
Figure 2: Global Sewage Submersible Pump Market Volume (Thousand Units), by Type 2017-2031
Figure 3: Global Sewage Submersible Pump Market Incremental Opportunity (US$ Bn), Forecast, by Type, 2022-2031
Figure 4: Global Sewage Submersible Pump Market Value (US$ Bn), by Power Source, 2017-2031
Figure 5: Global Sewage Submersible Pump Market Volume (Thousand Units), by Power Source 2017-2031
Figure 6: Global Sewage Submersible Pump Market Incremental Opportunity (US$ Bn), Forecast, by Power Source, 2022-2031
Figure 7: Global Sewage Submersible Pump Market Value (US$ Bn), by Power Rating, 2017-2031
Figure 8: Global Sewage Submersible Pump Market Volume (Thousand Units), by Power Rating 2017-2031
Figure 9: Global Sewage Submersible Pump Market Incremental Opportunity (US$ Bn), Forecast, by Power Rating, 2022-2031
Figure 10: Global Sewage Submersible Pump Market Value (US$ Bn), by Application, 2017-2031
Figure 11: Global Sewage Submersible Pump Market Volume (Thousand Units), by Application 2017-2031
Figure 12: Global Sewage Submersible Pump Market Incremental Opportunity (US$ Bn), Forecast, by Application, 2022-2031
Figure 13: Global Sewage Submersible Pump Market Value (US$ Bn), by End-user, 2017-2031
Figure 14: Global Sewage Submersible Pump Market Volume (Thousand Units), by End-user 2017-2031
Figure 15: Global Sewage Submersible Pump Market Incremental Opportunity (US$ Bn), Forecast, by End-user, 2022-2031
Figure 16: Global Sewage Submersible Pump Market Value (US$ Bn), by Distribution Channel, 2017-2031
Figure 17: Global Sewage Submersible Pump Market Volume (Thousand Units), by Distribution Channel 2017-2031
Figure 18: Global Sewage Submersible Pump Market Incremental Opportunity (US$ Bn), Forecast, by Distribution Channel, 2022-2031
Figure 19: Global Sewage Submersible Pump Market Value (US$ Bn), by Region, 2017-2031
Figure 20: Global Sewage Submersible Pump Market Volume (Thousand Units), by Region, 2017-2031
Figure 21: Global Sewage Submersible Pump Market Incremental Opportunity (US$ Bn), Forecast, by Region, 2022-2031
Figure 22: North America Sewage Submersible Pump Market Value (US$ Bn), by Type, 2017-2031
Figure 23: North America Sewage Submersible Pump Market Volume (Thousand Units), by Type 2017-2031
Figure 24: North America Sewage Submersible Pump Market Incremental Opportunity (US$ Bn), Forecast, by Type, 2022-2031
Figure 25: North America Sewage Submersible Pump Market Value (US$ Bn), by Power Source, 2017-2031
Figure 26: North America Sewage Submersible Pump Market Volume (Thousand Units), by Power Source 2017-2031
Figure 27: North America Sewage Submersible Pump Market Incremental Opportunity (US$ Bn), Forecast, by Power Source, 2022-2031
Figure 28: North America Sewage Submersible Pump Market Value (US$ Bn), by Power Rating, 2017-2031
Figure 29: North America Sewage Submersible Pump Market Volume (Thousand Units), by Power Rating 2017-2031
Figure 30: North America Sewage Submersible Pump Market Incremental Opportunity (US$ Bn), Forecast, by Power Rating, 2022-2031
Figure 31: North America Sewage Submersible Pump Market Value (US$ Bn), by Application, 2017-2031
Figure 32: North America Sewage Submersible Pump Market Volume (Thousand Units), by Application 2017-2031
Figure 33: North America Sewage Submersible Pump Market Incremental Opportunity (US$ Bn), Forecast, by Application, 2022-2031
Figure 34: North America Sewage Submersible Pump Market Value (US$ Bn), by End-user, 2017-2031
Figure 35: North America Sewage Submersible Pump Market Volume (Thousand Units), by End-user 2017-2031
Figure 36: North America Sewage Submersible Pump Market Incremental Opportunity (US$ Bn), Forecast, by End-user, 2022-2031
Figure 37: North America Sewage Submersible Pump Market Value (US$ Bn), by Distribution Channel, 2017-2031
Figure 38: North America Sewage Submersible Pump Market Volume (Thousand Units), by Distribution Channel 2017-2031
Figure 39: North America Sewage Submersible Pump Market Incremental Opportunity (US$ Bn), Forecast, by Distribution Channel, 2022-2031
Figure 40: North America Sewage Submersible Pump Market Value (US$ Bn), by Country & Sub-region, 2017-2031
Figure 41: North America Sewage Submersible Pump Market Volume (Thousand Units), by Country & Sub-region, 2017-2031
Figure 42: North America Sewage Submersible Pump Market Incremental Opportunity (US$ Bn), Forecast, by Country & Sub-region, 2022-2031
Figure 43: Europe Sewage Submersible Pump Market Value (US$ Bn), by Type, 2017-2031
Figure 44: Europe Sewage Submersible Pump Market Volume (Thousand Units), by Type 2017-2031
Figure 45: Europe Sewage Submersible Pump Market Incremental Opportunity (US$ Bn), Forecast, by Type, 2022-2031
Figure 46: Europe Sewage Submersible Pump Market Value (US$ Bn), by Power Source, 2017-2031
Figure 47: Europe Sewage Submersible Pump Market Volume (Thousand Units), by Power Source 2017-2031
Figure 48: Europe Sewage Submersible Pump Market Incremental Opportunity (US$ Bn), Forecast, by Power Source, 2022-2031
Figure 49: Europe Sewage Submersible Pump Market Value (US$ Bn), by Power Rating, 2017-2031
Figure 50: Europe Sewage Submersible Pump Market Volume (Thousand Units), by Power Rating 2017-2031
Figure 51: Europe Sewage Submersible Pump Market Incremental Opportunity (US$ Bn), Forecast, by Power Rating, 2022-2031
Figure 52: Europe Sewage Submersible Pump Market Value (US$ Bn), by Application, 2017-2031
Figure 53: Europe Sewage Submersible Pump Market Volume (Thousand Units), by Application 2017-2031
Figure 54: Europe Sewage Submersible Pump Market Incremental Opportunity (US$ Bn), Forecast, by Application, 2022-2031
Figure 55: Europe Sewage Submersible Pump Market Value (US$ Bn), by End-user, 2017-2031
Figure 56: Europe Sewage Submersible Pump Market Volume (Thousand Units), by End-user 2017-2031
Figure 57: Europe Sewage Submersible Pump Market Incremental Opportunity (US$ Bn), Forecast, by End-user, 2022-2031
Figure 58: Europe Sewage Submersible Pump Market Value (US$ Bn), by Distribution Channel, 2017-2031
Figure 59: Europe Sewage Submersible Pump Market Volume (Thousand Units), by Distribution Channel 2017-2031
Figure 60: Europe Sewage Submersible Pump Market Incremental Opportunity (US$ Bn), Forecast, by Distribution Channel, 2022-2031
Figure 61: Europe Sewage Submersible Pump Market Value (US$ Bn), by Country & Sub-region, 2017-2031
Figure 62: Europe Sewage Submersible Pump Market Volume (Thousand Units), by Country & Sub-region, 2017-2031
Figure 63: Europe Sewage Submersible Pump Market Incremental Opportunity (US$ Bn), Forecast, by Country & Sub-region, 2022-2031
Figure 64: Asia Pacific Sewage Submersible Pump Market Value (US$ Bn), by Type, 2017-2031
Figure 65: Asia Pacific Sewage Submersible Pump Market Volume (Thousand Units), by Type 2017-2031
Figure 66: Asia Pacific Sewage Submersible Pump Market Incremental Opportunity (US$ Bn), Forecast, by Type, 2022-2031
Figure 67: Asia Pacific Sewage Submersible Pump Market Value (US$ Bn), by Power Source, 2017-2031
Figure 68: Asia Pacific Sewage Submersible Pump Market Volume (Thousand Units), by Power Source 2017-2031
Figure 69: Asia Pacific Sewage Submersible Pump Market Incremental Opportunity (US$ Bn), Forecast, by Power Source, 2022-2031
Figure 70: Asia Pacific Sewage Submersible Pump Market Value (US$ Bn), by Power Rating, 2017-2031
Figure 71: Asia Pacific Sewage Submersible Pump Market Volume (Thousand Units), by Power Rating 2017-2031
Figure 72: Asia Pacific Sewage Submersible Pump Market Incremental Opportunity (US$ Bn), Forecast, by Power Rating, 2022-2031
Figure 73: Asia Pacific Sewage Submersible Pump Market Value (US$ Bn), by Application, 2017-2031
Figure 74: Asia Pacific Sewage Submersible Pump Market Volume (Thousand Units), by Application 2017-2031
Figure 75: Asia Pacific Sewage Submersible Pump Market Incremental Opportunity (US$ Bn), Forecast, by Application, 2022-2031
Figure 76: Asia Pacific Sewage Submersible Pump Market Value (US$ Bn), by End-user, 2017-2031
Figure 77: Asia Pacific Sewage Submersible Pump Market Volume (Thousand Units), by End-user 2017-2031
Figure 78: Asia Pacific Sewage Submersible Pump Market Incremental Opportunity (US$ Bn), Forecast, by End-user, 2022-2031
Figure 79: Asia Pacific Sewage Submersible Pump Market Value (US$ Bn), by Distribution Channel, 2017-2031
Figure 80: Asia Pacific Sewage Submersible Pump Market Volume (Thousand Units), by Distribution Channel 2017-2031
Figure 81: Asia Pacific Sewage Submersible Pump Market Incremental Opportunity (US$ Bn), Forecast, by Distribution Channel, 2022-2031
Figure 82: Asia Pacific Sewage Submersible Pump Market Value (US$ Bn), by Country & Sub-region, 2017-2031
Figure 83: Asia Pacific Sewage Submersible Pump Market Volume (Thousand Units), by Country & Sub-region, 2017-2031
Figure 84: Asia Pacific Sewage Submersible Pump Market Incremental Opportunity (US$ Bn), Forecast, by Country & Sub-region, 2022-2031
Figure 85: Middle East & Africa Sewage Submersible Pump Market Value (US$ Bn), by Type, 2017-2031
Figure 86: Middle East & Africa Sewage Submersible Pump Market Volume (Thousand Units), by Type 2017-2031
Figure 87: Middle East & Africa Sewage Submersible Pump Market Incremental Opportunity (US$ Bn), Forecast, by Type, 2022-2031
Figure 88: Middle East & Africa Sewage Submersible Pump Market Value (US$ Bn), by Power Source, 2017-2031
Figure 89: Middle East & Africa Sewage Submersible Pump Market Volume (Thousand Units), by Power Source 2017-2031
Figure 90: Middle East & Africa Sewage Submersible Pump Market Incremental Opportunity (US$ Bn), Forecast, by Power Source, 2022-2031
Figure 91: Middle East & Africa Sewage Submersible Pump Market Value (US$ Bn), by Power Rating, 2017-2031
Figure 92: Middle East & Africa Sewage Submersible Pump Market Volume (Thousand Units), by Power Rating 2017-2031
Figure 93: Middle East & Africa Sewage Submersible Pump Market Incremental Opportunity (US$ Bn), Forecast, by Power Rating, 2022-2031
Figure 94: Middle East & Africa Sewage Submersible Pump Market Value (US$ Bn), by Application, 2017-2031
Figure 95: Middle East & Africa Sewage Submersible Pump Market Volume (Thousand Units), by Application 2017-2031
Figure 96: Middle East & Africa Sewage Submersible Pump Market Incremental Opportunity (US$ Bn), Forecast, by Application, 2022-2031
Figure 97: Middle East & Africa Sewage Submersible Pump Market Value (US$ Bn), by End-user, 2017-2031
Figure 98: Middle East & Africa Sewage Submersible Pump Market Volume (Thousand Units), by End-user 2017-2031
Figure 99: Middle East & Africa Sewage Submersible Pump Market Incremental Opportunity (US$ Bn), Forecast, by End-user, 2022-2031
Figure 100: Middle East & Africa Sewage Submersible Pump Market Value (US$ Bn), by Distribution Channel, 2017-2031
Figure 101: Middle East & Africa Sewage Submersible Pump Market Volume (Thousand Units), by Distribution Channel 2017-2031
Figure 102: Middle East & Africa Sewage Submersible Pump Market Incremental Opportunity (US$ Bn), Forecast, by Distribution Channel, 2022-2031
Figure 103: Middle East & Africa Sewage Submersible Pump Market Value (US$ Bn), by Country & Sub-region, 2017-2031
Figure 104: Middle East & Africa Sewage Submersible Pump Market Volume (Thousand Units), by Country & Sub-region, 2017-2031
Figure 105: Middle East & Africa Sewage Submersible Pump Market Incremental Opportunity (US$ Bn), Forecast, by Country & Sub-region, 2022-2031
Figure 106: South America Sewage Submersible Pump Market Value (US$ Bn), by Type, 2017-2031
Figure 107: South America Sewage Submersible Pump Market Volume (Thousand Units), by Type 2017-2031
Figure 108: South America Sewage Submersible Pump Market Incremental Opportunity (US$ Bn), Forecast, by Type, 2022-2031
Figure 109: South America Sewage Submersible Pump Market Value (US$ Bn), by Power Source, 2017-2031
Figure 110: South America Sewage Submersible Pump Market Volume (Thousand Units), by Power Source 2017-2031
Figure 111: South America Sewage Submersible Pump Market Incremental Opportunity (US$ Bn), Forecast, by Power Source, 2022-2031
Figure 112: South America Sewage Submersible Pump Market Value (US$ Bn), by Power Rating, 2017-2031
Figure 113: South America Sewage Submersible Pump Market Volume (Thousand Units), by Power Rating 2017-2031
Figure 114: South America Sewage Submersible Pump Market Incremental Opportunity (US$ Bn), Forecast, by Power Rating, 2022-2031
Figure 115: South America Sewage Submersible Pump Market Value (US$ Bn), by Application, 2017-2031
Figure 116: South America Sewage Submersible Pump Market Volume (Thousand Units), by Application 2017-2031
Figure 117: South America Sewage Submersible Pump Market Incremental Opportunity (US$ Bn), Forecast, by Application, 2022-2031
Figure 118: South America Sewage Submersible Pump Market Value (US$ Bn), by End-user, 2017-2031
Figure 119: South America Sewage Submersible Pump Market Volume (Thousand Units), by End-user 2017-2031
Figure 120: South America Sewage Submersible Pump Market Incremental Opportunity (US$ Bn), Forecast, by End-user, 2022-2031
Figure 121: South America Sewage Submersible Pump Market Value (US$ Bn), by Distribution Channel, 2017-2031
Figure 122: South America Sewage Submersible Pump Market Volume (Thousand Units), by Distribution Channel 2017-2031
Figure 123: South America Sewage Submersible Pump Market Incremental Opportunity (US$ Bn), Forecast, by Distribution Channel, 2022-2031
Figure 124: South America Sewage Submersible Pump Market Value (US$ Bn), by Country & Sub-region, 2017-2031
Figure 125: South America Sewage Submersible Pump Market Volume (Thousand Units), by Country & Sub-region, 2017-2031
Figure 126: South America Sewage Submersible Pump Market Incremental Opportunity (US$ Bn), Forecast, by Country & Sub-region, 2022-2031
Copyright © Transparency Market Research, Inc. All Rights reserved
Trust Online

Sewage Submersible Pump Market