
Reports
Reports
The growing number of insulin-dependent diabetics and the rising preference of home treatment are major factors that can steer the self-injection device market toward growth during the forecast period of 2018-2026. The new coronavirus outbreak has led to lockdown impositions in numerous countries across the globe. Frequent venturing out of patients who need injections is dangerous for them and can greatly affect their health. This is because the novel coronavirus affects a person with co-morbidities at a high level and also increases the chances of fatality due to the infection. Thus, the demand for self-injection devices may soar to a certain extent in the lockdown period and will continue to soar beyond the lockdown to tackle the transmission threat.
Based on the product type, the self-injection device market can be classified into wearable injectors, auto-injectors, and pen injectors.
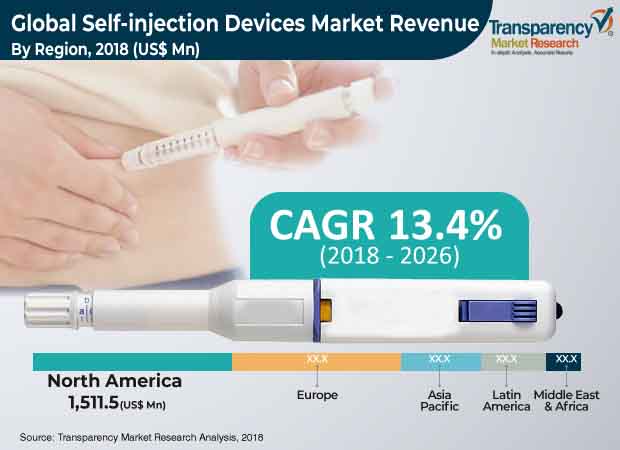
The global self-injection devices market is expanding at a rapid pace due to high prevalence and incidence rate of chronic diseases, technological advancements, new product development and commercialization, and product differentiation strategies adopted by leading pharmaceutical companies across the globe. In terms of revenue, the global market was valued at US$ 3,770.0 Mn in 2017. It is projected to reach US$ 11,380.9 Mn by 2026, expanding at a CAGR of 13.4% from 2018 to 2026. The global self-injection devices market is also driven by a significant rise in demand for home health care, owing to low cost of treatment and improvements in overall patient experience.
Self-injection devices are designed for multiple injections of medicines and hormones for patients requiring frequent dosage for long-term management of medical conditions such as diabetes. Self-injection devices are available in both disposable and reusable forms. The ability of self-administration of drugs or medicines is a key factor fueling demand for pen injectors. The devices offer advantages such as fewer visits to hospitals or clinics, low cost, and ease of use. Self-injection devices are widely used for the administration of insulin to diabetic patients, administration of growth hormones, and administration of biologic drugs for the management of long lasting chronic disorders. Extensive research and development activities by key players to develop self-injection products and rise in approvals of novel self-injection devices are anticipated to drive the global self-injection devices market.
The global self-injection devices market is estimated to be driven by the high prevalence and incidence rates of chronic disorders, especially diabetes and rheumatoid arthritis, across the globe. For instance, according to the International Diabetes Federation, globally, the number of adults with diabetes (diagnosed or undiagnosed) is projected to increase from 415 million in 2016 to 642 million by 2040. Also, over 200 million people worldwide are estimated to be suffering from osteoporosis. The number of people aged 60 years and above worldwide is projected to increase from 901 million in 2015 to 2.1 billion by 2050. Therefore, the incidence of osteoporosis is expected to increase rapidly. Globally, over 14 million new cases of osteoporosis-related fractures are recorded every year.
Technological advancements in self-injection devices, especially in auto injectors and wearable injectors, for the administration of high viscosity and large volume drugs represents a potential business development opportunity for leading players operating in the market. Moreover, the patent expiry of leading biologic drugs and increase in demand for biosimilar drugs are expected to propel the self-injection devices market during the forecast period.
In terms of product type, the global self-injection devices market has been segmented into pen injectors, auto injectors, and wearable injectors. The pen injectors segment held a significant share of 67.6% of the market in 2017. Research indicates that it is likely to be the leading product segment, owing to the applications of pen injectors in diabetes, easy availability, and low cost. The abundant availability of these products is expected to boost the pen injectors segment during the forecast period. Reports also suggest that the wearable injectors segment is projected to expand at a CAGR of 20.0% between 2018 and 2026.
In terms of region, the global self-injection devices market has been segmented into North America, Europe, Asia Pacific, Latin America, and Middle East & Africa. North America is expected to dominate the global market during the forecast period. The high volume of consumption of disposable self-injection devices, rapid increase in the population with diabetes and rheumatoid arthritis, and rise in home health care are expected to propel the market in North America in the coming years. Furthermore, patent expiry of leading biologic drugs in the U.S., rise in demand for biosimilars, and anticipated new product launches are likely to augment the growth of the self-injection devices market in the region. The market in Asia Pacific is projected to expand at a prominent CAGR during the forecast period. Increase in awareness about various chronic disorders, rapidly changing health care infrastructure in developing countries such as China and India, and well-established pharmaceutical market in Japan are anticipated to fuel the self-injection devices market in Asia Pacific during the forecast period.
A majority of pharmaceutical companies have established strategic partnerships with medical device companies to differentiate their products and are coming up with self-injection devices to tap the home health care market. Key players operating in the global self-injection devices market include Becton, Dickinson and Company, Gerresheimer AG, Insulet Corporation, Ypsomed AG, Antares Pharma, Inc., West Pharmaceutical Services, Inc., Consort Medical plc, Sensile Medical AG, Owen Mumford Ltd., SHL Group, and Wilhelm Haselmeier GmbH & Co. KG.
1. Preface
1.1. Market Definition and Scope
1.2. Market Segmentation
1.3. Key Research Objectives
1.4. Research Highlights
2. Assumptions and Research Methodology
3. Executive Summary : Global Self-injection Devices Market
4. Market Overview
4.1. Introduction
4.1.1. Product Definition
4.1.2. Industry Evolution/Developments
4.2. Overview
4.3. Market Dynamics
4.3.1. Drivers
4.3.2. Restraints
4.3.3. Opportunities
4.4. Global Self-injection Devices Market Analysis and Forecasts, 2016–2026
4.4.1. Market Revenue Projections (US$ Mn)
5. Key Insights
5.1.Technological Advancements
5.2.Key Mergers & Acquisitions
6. Global Self-injection Devices Market Analysis and Forecasts, by Product
6.1. Introduction & Definition
6.2. Key Findings/Developments
6.3. Market Value Forecast, by Product , 2016–2026
6.3.1. Pen Injectors
6.3.2. Autoinjectors
6.3.3. Wearable Injectors
6.4. Market Attractiveness, by Product
7. Global Self-injection Devices Market Analysis and Forecasts, by Usage
7.1. Introduction & Definition
7.2. Key Findings/Developments
7.3. Market Value Forecast, by Usage, 2016–2026
7.3.1. Disposable
7.3.2. Reusable
7.4. Market Attractiveness, by Usage
8. Global Self-injection Devices Market Analysis and Forecasts, by Region
8.1. Key Findings
8.2. Market Value Forecast, by Region
8.2.1. North America
8.2.2. Europe
8.2.3. Asia Pacific
8.2.4. Latin America
8.2.5. Middle East & Africa
8.3. Market Attractiveness, by Country/Region
9. North America Self-injection Devices Market Analysis and Forecast
9.1. Introduction
9.1.1. Key Findings
9.2. Market Value Forecast, by Product, 2016–2026
9.2.1. Pen Injectors
9.2.2. Autoinjectors
9.2.3. Wearable Injectors
9.3. Market Value Forecast, by Usage, 2016–2026
9.3.1. Disposable
9.3.2. Reusable
9.4. Market Value Forecast, by Country, 2016–2026
9.4.1. U.S.
9.4.2. Canada
9.5. Market Attractiveness Analysis
9.5.1. By Product
9.5.2. By Usage
9.5.3. By Country
10. Europe Self-injection Devices Market Analysis and Forecast
10.1. Introduction
10.1.1. Key Findings
10.2. Market Value Forecast, by Product, 2016–2026
10.2.1. Pen Injectors
10.2.2. Autoinjectors
10.2.3. Wearable Injectors
10.3. Market Value Forecast, by Usage, 2016–2026
10.3.1. Disposable
10.3.2. Reusable
10.4. Market Value Forecast, by Country/Sub-region, 2016–2026
10.4.1. Germany
10.4.2. U.K.
10.4.3. France
10.4.4. Spain
10.4.5. Italy
10.4.6. Rest of Europe
10.5. Market Attractiveness Analysis
10.5.1. By Product
10.5.2. By Usage
10.5.3. By Country/Sub-region
11. Asia Pacific Self-injection Devices Market Analysis and Forecast
11.1.Introduction
11.1.1. Key Findings
11.2.Market Value Forecast, by Product , 2016–2026
11.2.1. Pen Injectors
11.2.2. Autoinjectors
11.2.3. Wearable Injectors
11.3.Market Value Forecast, by Usage, 2016–2026
11.3.1. Disposable
11.3.2. Reusable
11.4.Market Value Forecast, by Country/Sub-region, 2016–2026
11.4.1. China
11.4.2. Japan
11.4.3. India
11.4.4. Australia & New Zealand
11.4.5. Rest of Asia Pacific
11.5.Market Attractiveness Analysis
11.5.1. By Product
11.5.2. By Usage
11.5.3. By Country/Sub-region
12. Latin America Self-injection Devices Market Analysis and Forecast
12.1.Introduction
12.1.1. Key Findings
12.2.Market Value Forecast, by Product , 2016–2026
12.2.1. Pen Injectors
12.2.2. Autoinjectors
12.2.3. Wearable Injectors
12.3.Market Value Forecast, by Usage, 2016–2026
12.3.1. Disposable
12.3.2. Reusable
12.4.Market Value Forecast, by Country/Sub-region, 2016–2026
12.4.1. Brazil
12.4.2. Mexico
12.4.3. Rest of Latin America
12.5.Market Attractiveness Analysis
12.5.1. By Product
12.5.2. By Usage
12.5.3. By Country/Sub-region
13. Middle East & Africa Self-injection Devices Market Analysis and Forecast
13.1.Introduction
13.1.1. Key Findings
13.2.Market Value Forecast, by Product , 2016–2026
13.2.1. Pen Injectors
13.2.2. Autoinjectors
13.2.3. Wearable Injectors
13.3.Market Value Forecast, by Usage, 2016–2026
13.3.1. Disposable
13.3.2. Reusable
13.4.Market Value Forecast, by Country/Sub-region, 2016–2026
13.4.1. GCC Countries
13.4.2. South Africa
13.4.3. Rest of Middle East & Africa
13.5.Market Attractiveness Analysis
13.5.1. By Product
13.5.2. By Usage
13.5.3. By Country/Sub-region
14. Competition Landscape
14.1.Market Player – Competition Matrix (By Tier and Size of Companies)
14.2.Market Share Analysis, by Company (2017)
14.3. Company Profiles
14.3.1. Becton, Dickinson and Company
14.3.2. Gerresheimer AG
14.3.3. Insulet Corporation
14.3.4. Ypsomed AG
14.3.5. Antares Pharma, Inc.
14.3.6. West Pharmaceutical Services, Inc.
14.3.7. Consort Medical plc
14.3.8. Sensile Medical AG
14.3.9. Owen Mumford Ltd.
14.3.10. SHL Group
14.3.11. Wilhelm Haselmeier GmbH & Co. KG
List of Tables
Table 01: Global Self-injection Devices Market Value (US$ Mn) Forecast, by Product Type, 2016–2026
Table 02: Global Self-injection Devices Market Value (US$ Mn) Forecast, by Usage, 2016–2026
Table 03: Global Self-injection Devices Market Value (US$ Mn) Forecast, by Region, 2016–2026
Table 04: North America Self-injection Devices Market Value (US$ Mn) Forecast, by Country, 2016–2026
Table 05: North America Self-injection Devices Value (US$ Mn) Forecast, by Product Type, 2016–2026
Table 06: North America Self-injection Devices Value (US$ Mn) Forecast, by Usage, 2016–2026
Table 07: Europe Self-injection Devices Market Value (US$ Mn) Forecast, by Country/Sub-region, 2016–2026
Table 08: Europe Self-injection Devices Market Value (US$ Mn) Forecast, by Product Type, 2016–2026
Table 09: Europe Self-injection Devices Value (US$ Mn) Forecast, by Usage, 2016–2026
Table 10: Asia Pacific Self-injection Devices Market Value (US$ Mn) Forecast, by Country/Sub-region, 2016–2026
Table 11: Asia Pacific Self-injection Devices Market Value (US$ Mn) Forecast, by Product Type, 2016–2026
Table 12: Asia Pacific v Devices Value (US$ Mn) Forecast, by Usage, 2016–2026
Table 13: Latin America Self-injection Devices Market Value (US$ Mn) Forecast, by Country/Sub-region, 2016–2026
Table 14: Latin America Self-injection Devices Market Value (US$ Mn) Forecast, by Product Type, 2016–2026
Table 15: Latin America Self-injection Devices Value (US$ Mn) Forecast, by Usage, 2016–2026
Table 16: Middle East & Africa Self-injection Devices Market Value (US$ Mn) Forecast, by Country/Sub-region, 2016–2026
Table 17: Middle East & Africa Self-injection Devices Value (US$ Mn) Forecast, by Product Type, 2016–2026
Table 18: Middle East & Africa Self-injection Devices Value (US$ Mn) Forecast, by Usage, 2016–2026
List of Figures
Figure 01: Global Self-injection Devices Market Value (US$ Mn) Snapshot, by Product Type, 2017(A)
Figure 02: Global Self-injection Devices Market Snapshot
Figure 03: Global Self-injection Devices Market Share (%) Snapshot, by Region, 2017(A)
Figure 04: Global Self-injection Devices Market Value (US$ Mn) and Distribution, by Region, 2017 and 2026
Figure 05: Global Self-injection Devices Market, Opportunity Map, by Product Type
Figure 06: Global Self Injection Devices Market Value (US$ Mn) Forecast, 2016-2026
Figure 07: Global Self-injection Devices Market Value Share (%), by Product Type (2017)
Figure 08: Global Self-injection Devices Market Value Share (%), by Usage (2017)
Figure 09: Global Self-injection Devices Market Value Share (%), by Region (2017)
Figure 10: Global Self-injection Devices Market Technological Advancements: Pen Injectors
Figure 11: Global Self-injection Devices Market Technological Advancements: Autoinectors
Figure 12: Global Self-injection Devices Market Technological Advancements: Wearable Injectors
Figure 13: Self-injection Devices Market: Mergers & Acquisitions
Figure 14: Global Self-injection Devices Market Value Share Analysis, by Product Type, 2017 and 2026
Figure 15: Global Self-injection Devices Market Attractiveness, by Product Type, 2018–2026
Figure 16: Global Self-injection Devices Market Revenue (US$ Mn) Forecast and Y-o-Y Growth (%) Projection, by Pen Injectors, 2016–2026
Figure 17: Global Self-injection Devices Market Revenue (US$ Mn) Forecast and Y-o-Y Growth (%) Projection, by Autoinjectors, 2016–2026
Figure 18: Global Self-injection Devices Market Value Share Analysis, by Usage, 2017 and 2026
Figure 19: Global Self-injection Devices Market Attractiveness, by Usage, 2018–2026
Figure 20: Global Self-injection Devices Market Revenue (US$ Mn) Forecast and Y-o-Y Growth (%) Projection, by Disposable, 2016–2026
Figure 21: Global Self-injection Devices Market Revenue (US$ Mn) Forecast and Y-o-Y Growth (%) Projection, by Reusable, 2016–2026
Figure 22: Global Self-injection Devices Market Value Share Analysis, by Region 2017 and 2026
Figure 23: Global Self-injection Devices Market Attractiveness, by Region, 2018–2026
Figure 24: North America Self-injection Devices Market Value (US$ Mn) and Y-o-Y Growth (%) Forecast, 2016–2026
Figure 25 : North America Self-injection Devices Market Value Share (%), by Country, 2017 and 2026
Figure 26: North America Self-injection Devices Market Attractiveness, by Country, 2018–2026
Figure 27: North America Self-injection Devices Market Value Share (%), by Product Type, 2017 and 2026
Figure 28: North America Self-injection Devices Market Attractiveness, by Product Type, 2018–2026
Figure 29: North America Self-injection Devices Market Value Share (%), by Usage, 2017 and 2026
Figure 30: North America Self-injection Devices Market Attractiveness, by Usage, 2018–2026
Figure 31: Europe Self-injection Devices Market Value (US$ Mn) and Y-o-Y Growth (%) Forecast, 2016–2026
Figure 32 : Europe Self-injection Devices Market Value Share (%), by Country/Sub-region, 2017 and 2026
Figure 33: Europe Self-injection Devices Market Attractiveness, by Country/Sub-region, 2018–2026
Figure 34: Europe Self-injection Devices Market Value Share (%), by Product Type, 2017 and 2026
Figure 35: Europe Self-injection Devices Market Attractiveness, by Product Type, 2018–2026
Figure 36: Europe Self-injection Devices Market Value Share (%), by Usage, 2017 and 2026
Figure 37: Europe Self-injection Devices Market Attractiveness, by Usage, 2018–2026
Figure 38: Asia Pacific Self-injection Devices Market Value (US$ Mn) and Y-o-Y Growth (%) Forecast, 2016–2026
Figure 39 : Asia Pacific Self-injection Devices Market Value Share (%), by Country/Sub-region, 2017 and 2026
Figure 40: Asia Pacific Self-injection Devices Market Attractiveness, by Country/Sub-region, 2018–2026
Figure 41: Asia Pacific Self-injection Devices Market Value Share (%), by Product Type, 2017 and 2026
Figure 42: Asia Pacific Self-injection Devices Market Attractiveness, by Product Type, 2018–2026
Figure 43: Asia Pacific Self-injection Devices Market Value Share (%), by Usage, 2017 and 2026
Figure 44: Asia Pacific Self-injection Devices Market Attractiveness, by Usage, 2018–2026
Figure 45: Latin America Self-injection Devices Market Value (US$ Mn) and Y-o-Y Growth (%) Forecast, 2016–2026
Figure 46 : Latin America Self-injection Devices Market Value Share (%), by Country/Sub-region, 2017 and 2026
Figure 47: Latin America Self-injection Devices Market Attractiveness, by Country/Sub-region, 2018–2026
Figure 48: Latin America Self-injection Devices Market Value Share (%), by Product Type, 2017 and 2026
Figure 49: Latin America Self-injection Devices Market Attractiveness, by Product Type, 2018–2026
Figure 50: Latin America Self-injection Devices Market Value Share (%), by Usage, 2017 and 2026
Figure 51: Latin America Self-injection Devices Market Attractiveness, by Usage, 2018–2026
Figure 52: Middle East & Africa Self-injection Devices Market Value (US$ Mn) and Y-o-Y Growth (%) Forecast, 2016–2026
Figure 53 : Middle East & Africa Self-injection Devices Market Value Share (%), by Country/Sub-region, 2017 and 2026
Figure 54: Middle East & Africa Self-injection Devices Market Attractiveness, by Country/Sub-region, 2018–2026
Figure 55: Middle East & Africa Self-injection Devices Market Value Share (%), by Product Type, 2017 and 2026
Figure 56: Middle East & Africa Self-injection Devices Market Attractiveness, by Product Type, 2018–2026
Figure 57: Middle East & Africa Self-injection Devices Market Value Share (%), by Usage, 2017 and 2026
Figure 58: Middle East & Africa Self-injection Devices Market Attractiveness, by Usage, 2018–2026
Figure 59: Global Self-injection Devices Market Share Analysis, by Company (2017)
Figure 60: Becton, Dickinson and Company’s Revenue (US$ Bn) and Y-o-Y Growth (%), 2014–2017
Figure 61: Becton, Dickinson and Company’s R&D Intensity and Sales & Marketing Intensity – Company Level, (US$ Mn), 2016–2017
Figure 62: Becton, Dickinson and Company’s Breakdown of Net Sales, by Region, 2017
Figure 63: Becton, Dickinson and Company’s Breakdown of Net Sales, by Business Segment, 2017
Figure 64: Gerresheimer AG’s Revenue (US$ Bn) and Y-o-Y Growth (%), 2014–2017
Figure 65: Gerresheimer AG’s R&D Intensity and Sales & Marketing Intensity – Company Level, (US$ Mn), 2016–2017
Figure 66: Gerresheimer AG’s Breakdown of Net Sales, by Region, 2017
Figure 67: Gerresheimer AG’s Breakdown of Net Sales, by Business Segment, 2017
Figure 68: Insulet Corporation’s Revenue (US$ Mn) & Y-o-Y Growth (%), 2013–2017
Figure 69: Insulet Corporation’s R&D Intensity and Sales & Marketing Intensity – Company Level, (US$ Mn), 2016–2017
Figure 70: Insulet Corporation, Breakdown of Net Sales, by Region, 2017
Figure 71: Insulet Corporation’s Breakdown of Net Sales, by Region, 2016, by Business Segment, 2017
Figure 72: Ypsomed AG, Revenue (US$ Mn) & Y-o-Y Growth (%), 2013–2017
Figure 73: Ypsomed AG R&D Intensity and Sales & Marketing Intensity – Company Level, (US$ Mn), 2016–2017
Figure 74: Ypsomed AG, Breakdown of Net Sales, by Region, 2017
Figure 75: Ypsomed AG, Breakdown of Net Sales, by Region, 2016, by Business Segment, 2017
Figure 76: Antares Pharma, Inc., Revenue (US$ Mn) & Y-o-Y Growth (%), 2013–2017
Figure 77: Antares Pharma, Inc., R&D Intensity and Sales & Marketing Intensity – Company Level, (US$ Mn), 2016–2017
Figure 78: Antares Pharma, Inc., Breakdown of Net Sales, by Region, 2017
Figure 79: Antares Pharma, Inc., Breakdown of Net Sales, by Region, 2016, by Business Segment, 2017
Figure 80: West Pharmaceutical Services, Inc., Revenue (US$ Mn) & Y-o-Y Growth (%), 2013–2017
Figure 81: West Pharmaceutical Services, Inc. R&D Intensity and Sales & Marketing Intensity – Company Level, (US$ Mn), 2016–2017
Figure 82: West Pharmaceutical Services, Inc., Breakdown of Net Sales, by Region, 2017
Figure 83: West Pharmaceutical Services, Inc., Breakdown of Net Sales, by Region, 2016, by Business Segment, 2018
Figure 84: Consort Medical plc., Revenue (US$ Mn) & Y-o-Y Growth (%), 2013–2016
Figure 85: Consort Medical plc R&D Intensity and Sales & Marketing Intensity – Company Level, (US$ Mn), 2016–2017
Figure 86: Consort Medical plc, Breakdown of Net Sales, by Region, 2016
Figure 87: Consort Medical plc, Breakdown of Net Sales, by Region, 2016, by Business Segment, 2017
Copyright © Transparency Market Research, Inc. All Rights reserved
Trust Online

Self-injection Device Market