

Reports
Reports
The Global RF Plasma Generator Market is expected to be USD 2.12 Billion by 2025 and will grow at a Compound Annual Growth Rate of 8.40% to USD 5.22 Billion by 2036. This growth can be attributed to the increasing adoption of plasma processing technology for semiconductor fabrication, thin film deposition, surface modification as well as for material and advanced electronics manufacturing applications.
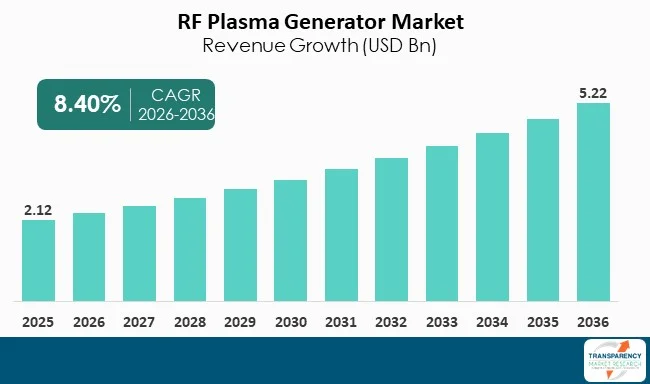
The RF Plasma Generator market is set to experience robust growth in the long run owing to the growing requirement for semiconductor manufacturing, material processing, thin film deposition, and surface treatment solutions. Semiconductor wafer fabs, display companies, solar cells, and coatings manufacturers have started using the technology of RF plasma to provide better solutions for high precision plasma etching, cleaning, deposition, and surface treatments. The growth in investment in advanced semiconductor node technology, compound semiconductors, and home-made chips is further fueling the demand for RF plasma power generators that are stable and efficient.
Asia-Pacific will continue to lead as the most dominant market region owing to the robust semiconductor processing activities carried out by China, Taiwan, South Korea, Japan, and India. Asia-Pacific enjoys the benefits associated with electronic goods manufacturing, manufacture of display panels, growth in the solar energy sector, and investments in material processing systems. Competition will rise in the future owing to the investment in systems featuring high frequency plasma, intelligent process controls, miniature systems, and effective power delivery mechanisms using RF power sources. Firms with expertise in semiconductors, engineering accuracy, and plasma technology are expected to enjoy the competitive edge in this market.
RF plasma generators refer to power sources whose purpose is to generate and maintain plasmas by supplying radio frequency energy into gases under controlled environments. The equipment is commonly applied in semiconductors fabrication, thin film deposition, plasma etching, cleaning, coating, and surface treatments. RF Plasma Generators contribute immensely to providing consistent power, process control, and plasma performance which are crucial in the production process. The industry is highly dependent on growth in electronics, microelectronics, photovoltaic cells, medical devices, and other advanced materials. The growing demand for miniaturized semiconductor chips, advanced coatings, and surface modifications drives the need for reliable RF plasma generation equipment.
| Attribute | Detail |
|---|---|
| RF Plasma Generator Market Drivers |
|
An expansion in semiconductor manufacturing and advanced microelectronics manufacturing is anticipated to significantly boost the adoption of RF plasma generators. These devices are critical for plasma etching, chemical vapor deposition, physical vapor deposition, wafer cleaning, ion implantation assist, and surface modification processes. Plasma must be generated with consistency, and precise control of power and energy must be achieved in order to create faster, smaller, and more reliable chips. The RF power systems will also continue gaining traction due to the increasing needs of semiconductor manufacturers for highly precise and repeatable systems.
According to a report published by the U.S. Government Accountability Office in 2026, the U.S. Department of Commerce had allocated USD 30.9 billion in funds for 40 semiconductor projects, which were aimed at constructing, expanding, and updating the facilities for semiconductor manufacturing as of July 2025. Such projects were involved in different aspects of semiconductor manufacturing, including materials manufacturing and chip packaging. Some of those semiconductor projects are expected to allow the creation of leading-edge logic chip manufacturing capabilities in the United States. It is critical for suppliers of RF plasma generators as such plasma-based processes will be required to manufacture these chips.
RF plasma generator market growth will further be fueled by the rising popularity of plasma technologies for thin-film solar cells, advanced coatings, displays, medical devices, semiconductor fabrication, and surface engineering applications. The RF plasma generator system provides surface modification, thin film deposition, improved adhesion, substrate cleaning, and the formation of functional coatings with high degree of uniformity. These features are essential to industries where surface modification is required such as photovoltaic systems, aviation/aerospace, electronics and optoelectronics manufacturing, and biomedical manufacturing. With the advent of thin and lightweight materials, the market for RF plasma generators will continue to grow.
According to the U.S. National Institute of Standards and Technology in 2025, plasma etching and deposition technologies are essential for semiconductors, while modern metrology and data analysis are necessary for characterization of plasma processes, used for reactor design, process engineering, and process control. This directly stimulates the demand for RF plasma generators because only such equipment generates radio-frequency energy needed to create stable plasma for etching, deposition, cleaning, and surface treatment purposes. Growing emphasis by manufacturers of semiconductor and thin-film technologies on increasing precision and accuracy will lead to growing demand for RF plasma generators.
| Attribute | Detail |
|---|---|
| Opportunity |
|
The RF plasma generators are expected to see significant growth opportunities due to the growth in the production of semiconductors across the globe. There is a requirement for RF plasma generators for various semiconductor fabrication procedures like plasma etching, thin film deposition, wafer cleaning, surface activation, and material modification. For semiconductor fabrication procedures, there is a requirement for stable RF power supply, precision control of plasma, and high process reproducibility for smaller geometries and advanced electronics. With increased production of logic chips, memory, power semiconductor, compound semiconductors, and advanced packages by semiconductor companies, there will be more demand for RF plasma generators.
Another opportunity that supports the business of RF plasma generator manufacturers is the development in semiconductor R&D. In December 2025, the Department of Commerce and NIST issued a CHIPS Research and Development letter of intent with xLight, Inc. regarding extreme ultraviolet lithography. The program seeks to create a new light source with the use of a high-power free-electron laser, which can be employed for chip production. In spite of the fact that the news talks mostly about the lithography problem, it seems that there is still much activity in next-generation semiconductor fabrication. This is important to RF plasma generator manufacturers since advanced semiconductor fabs use etching, deposition, and wafer preparation processes involving RF plasma.
| Attribute | Detail |
|---|---|
| Leading Segment |
|
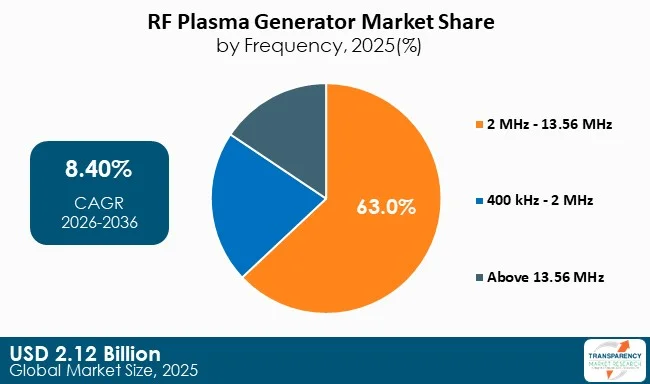
The RF Plasma Generator Market is dominated by frequencies between 2 and 13.56 MHz. These frequencies constitute 63% of the global market for RF plasma generators because they provide stable generation of plasma from RF power, useful power coupling to the load, and reliable process control across a wide range of industries.
RF generators operating in the 2 to 13.56 MHz frequency range are used for many different applications, including semiconductor fabrication, plasma etching, and thin film deposition, surface cleaning, coating, and modifying materials. This frequency range has particular significance in processes where there must be control of the energy of the ions in the plasma, uniform density of the plasma, and consistent treatment of the substrates to be processed.
There is a heavy industrial presence for 13.56 MHz, making it one of the most frequently used RF frequencies for plasma processing apparatuses. 13.56 MHz is recommended for environments where process repeatability, power stability, and compatibility with vacuum-based plasma tools is critical. Semiconductor manufacturers use 13.56 MHz to etch and deposit on wafers, while advanced materials manufacturers use it when applying coatings, activating surface materials, and making thin films. The demand for 2 to 13.56 MHz also includes solar cells, display panels, medical devices, and research laboratories.
| Attribute | Detail |
|---|---|
| Leading Region |
|
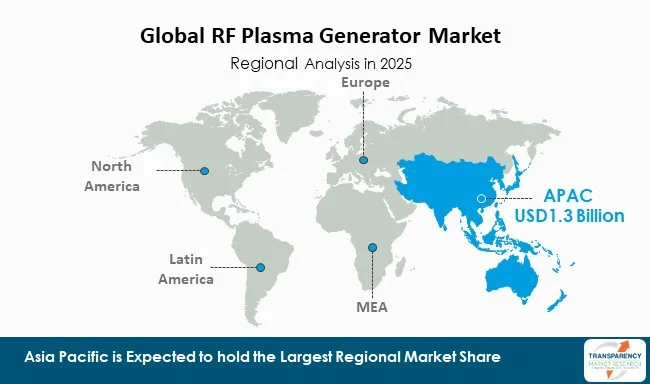
The RF plasma generator market has been dominated by the Asia Pacific region since it accounts for over 60% of the market share. The reason behind this supremacy lies mainly on the fact that this region is home to a large and flourishing semiconductor manufacturing sector as well as a large electronics products production ecosystem, which supports the use of advanced methods of material processing. The key countries within this region that contribute to the semiconductor industry, manufacture display panels, manufacture solar cells and manufacture electronic products include; China, Taiwan, South Korea, Japan and India. The RF plasma generators used in these industries will perform a multitude of useful functions such as; plasma etching, thin film deposition, wafer cleaning, surface modification and coating.
Taiwan and South Korea make up important markets given the large amounts of space they take up in terms of having semiconductor foundries, memory chips as well as more advanced packaging. Japan is assisting throughout the region with the use of equipment and materials for semiconductors while also being involved in precision manufacturing technologies. China continues to develop capability from a domestic standpoint in the areas of electronics manufacturing, solar panel manufacturing and chip production. India is becoming an increasingly important market with the increased level of investment in semiconductor and electronics manufacturing taking place.
Competition in the RF plasma generator market is intense, with the key players concentrating on the generation of RF power, the use of matching networks, RF plasma process control, and efficient power conversion systems. Some of the notable players within the industry include Advanced Energy Industries, Inc., Comet Group, MKS Instruments, Inc., TRUMPF Group, XP Power, ADTEC Plasma Technology Co., Ltd., and Kyosan Electric Mfg. Co., Ltd. All these players play an integral part in the semiconductor manufacturing process, thin film deposition, plasma etching, surface treatment, and advanced materials processing among others.
Some of the specialty companies that are playing a role in boosting the growth of the market include New Power Plasma Co., Ltd., T&C Power Conversion, Inc., Plasma Vacuum Solutions, Denki Kogyo Co., Ltd. (DKK), and PVA TePla AG. The increasing demand for RF plasma generators, RF matching networks, plasma systems, and custom power solutions within semiconductors and vacuum processing tools is prompting the firms to innovate.
| Attribute | Detail |
|---|---|
| Size in 2025 | USD 2.12 Billion |
| Forecast Value in 2036 | USD 5.22 Billion |
| CAGR | 8.40% |
| Forecast Period | 2026-2036 |
| Historical Data Available for | 2021-2025 |
| Quantitative Units | USD Billion for Value |
| RF Plasma Generator Market Analysis | It includes segment analysis as well as regional level analysis. Qualitative analysis includes drivers, restraints, opportunities, key trends, value chain analysis, and key trend analysis. |
| Competition Landscape |
|
| Format | Electronic (PDF) + Excel |
| Segmentation | By Frequency
|
| Regions Covered |
|
| Countries Covered |
|
| Companies Profiled |
|
| Customization Scope | Available upon request |
| Pricing | Available upon request |
The global RF Plasma Generator market was valued at USD 2.12 Billion in 2025 and is projected to reach USD 5.22 Billion by 2036.
Asia-Pacific dominated the RF Plasma Generator market in 2025, accounting for 60% of the global market share due to strong semiconductor and electronics manufacturing activities.
The 2 MHz – 13.56 MHz segment held the largest market share of 63% in 2025 due to its stable plasma generation and widespread use in semiconductor fabrication and thin-film processing.
RF plasma generators are widely used in semiconductor fabrication, plasma etching, thin-film deposition, wafer cleaning, surface treatment, industrial coating, and advanced materials processing applications.
The market is primarily driven by increasing semiconductor manufacturing, thin-film deposition, plasma etching, advanced material processing, and rising demand for precision surface treatment technologies across electronics and industrial applications.
Key players operating in the market include Advanced Energy Industries, Inc., Comet Group, MKS Instruments, Inc., TRUMPF Group, XP Power, and ADTEC Plasma Technology Co., Ltd.
Table 01: Global RF Plasma Generator Market Value (USD Billion) Projection, By Frequency 2021 to 2036
Table 02: Global RF Plasma Generator Market Value (USD Billion) Projection, By Application 2021 to 2036
Table 03: Global RF Plasma Generator Market Value (USD Billion) Projection, By End-use Industry 2021 to 2036
Table 04: Global RF Plasma Generator Market Value (USD Billion) Projection, By Country 2021 to 2036
Table 05: North America RF Plasma Generator Market Value (USD Billion) Projection, By Frequency 2021 to 2036
Table 06: North America RF Plasma Generator Market Value (USD Billion) Projection, By Application 2021 to 2036
Table 07: North America RF Plasma Generator Market Value (USD Billion) Projection, By End-use Industry 2021 to 2036
Table 08: North America RF Plasma Generator Market Value (USD Billion) Projection, By Country 2021 to 2036
Table 09: U.S. RF Plasma Generator Market Value (USD Billion) Projection, By Frequency 2021 to 2036
Table 10: U.S. RF Plasma Generator Market Value (USD Billion) Projection, By Application 2021 to 2036
Table 11: U.S. RF Plasma Generator Market Value (USD Billion) Projection, By End-use Industry 2021 to 2036
Table 12: Canada RF Plasma Generator Market Value (USD Billion) Projection, By Frequency 2021 to 2036
Table 13: Canada RF Plasma Generator Market Value (USD Billion) Projection, By Application 2021 to 2036
Table 14: Canada RF Plasma Generator Market Value (USD Billion) Projection, By End-use Industry 2021 to 2036
Table 15: Europe RF Plasma Generator Market Value (USD Billion) Projection, By Frequency 2021 to 2036
Table 16: Europe RF Plasma Generator Market Value (USD Billion) Projection, By Application 2021 to 2036
Table 17: Europe RF Plasma Generator Market Value (USD Billion) Projection, By End-use Industry 2021 to 2036
Table 18: Europe RF Plasma Generator Market Value (USD Billion) Projection, By Country 2021 to 2036
Table 19: U.K. RF Plasma Generator Market Value (USD Billion) Projection, By Frequency 2021 to 2036
Table 20: U.K. RF Plasma Generator Market Value (USD Billion) Projection, By Application 2021 to 2036
Table 21: U.K. RF Plasma Generator Market Value (USD Billion) Projection, By End-use Industry 2021 to 2036
Table 22: Germany RF Plasma Generator Market Value (USD Billion) Projection, By Frequency 2021 to 2036
Table 23: Germany RF Plasma Generator Market Value (USD Billion) Projection, By Application 2021 to 2036
Table 24: Germany RF Plasma Generator Market Value (USD Billion) Projection, By End-use Industry 2021 to 2036
Table 25: France RF Plasma Generator Market Value (USD Billion) Projection, By Frequency 2021 to 2036
Table 26: France RF Plasma Generator Market Value (USD Billion) Projection, By Application 2021 to 2036
Table 27: France RF Plasma Generator Market Value (USD Billion) Projection, By End-use Industry 2021 to 2036
Table 28: Italy RF Plasma Generator Market Value (USD Billion) Projection, By Frequency 2021 to 2036
Table 29: Italy RF Plasma Generator Market Value (USD Billion) Projection, By Application 2021 to 2036
Table 30: Italy RF Plasma Generator Market Value (USD Billion) Projection, By End-use Industry 2021 to 2036
Table 31: Spain RF Plasma Generator Market Value (USD Billion) Projection, By Frequency 2021 to 2036
Table 32: Spain RF Plasma Generator Market Value (USD Billion) Projection, By Application 2021 to 2036
Table 33: Spain RF Plasma Generator Market Value (USD Billion) Projection, By End-use Industry 2021 to 2036
Table 34: The Netherlands RF Plasma Generator Market Value (USD Billion) Projection, By Frequency 2021 to 2036
Table 35: The Netherlands RF Plasma Generator Market Value (USD Billion) Projection, By Application 2021 to 2036
Table 36: The Netherlands RF Plasma Generator Market Value (USD Billion) Projection, By End-use Industry 2021 to 2036
Table 37: Asia Pacific RF Plasma Generator Market Value (USD Billion) Projection, By Frequency 2021 to 2036
Table 38: Asia Pacific RF Plasma Generator Market Value (USD Billion) Projection, By Application 2021 to 2036
Table 39: Asia Pacific RF Plasma Generator Market Value (USD Billion) Projection, By End-use Industry 2021 to 2036
Table 40: Asia Pacific RF Plasma Generator Market Value (USD Billion) Projection, By Country 2021 to 2036
Table 41: China RF Plasma Generator Market Value (USD Billion) Projection, By Frequency 2021 to 2036
Table 42: China RF Plasma Generator Market Value (USD Billion) Projection, By Application 2021 to 2036
Table 43: China RF Plasma Generator Market Value (USD Billion) Projection, By End-use Industry 2021 to 2036
Table 44: India RF Plasma Generator Market Value (USD Billion) Projection, By Frequency 2021 to 2036
Table 45: India RF Plasma Generator Market Value (USD Billion) Projection, By Application 2021 to 2036
Table 46: India RF Plasma Generator Market Value (USD Billion) Projection, By End-use Industry 2021 to 2036
Table 47: Japan RF Plasma Generator Market Value (USD Billion) Projection, By Frequency 2021 to 2036
Table 48: Japan RF Plasma Generator Market Value (USD Billion) Projection, By Application 2021 to 2036
Table 49: Japan RF Plasma Generator Market Value (USD Billion) Projection, By End-use Industry 2021 to 2036
Table 50: Australia RF Plasma Generator Market Value (USD Billion) Projection, By Frequency 2021 to 2036
Table 51: Australia RF Plasma Generator Market Value (USD Billion) Projection, By Application 2021 to 2036
Table 52: Australia RF Plasma Generator Market Value (USD Billion) Projection, By End-use Industry 2021 to 2036
Table 53: South Korea RF Plasma Generator Market Value (USD Billion) Projection, By Frequency 2021 to 2036
Table 54: South Korea RF Plasma Generator Market Value (USD Billion) Projection, By Application 2021 to 2036
Table 55: South Korea RF Plasma Generator Market Value (USD Billion) Projection, By End-use Industry 2021 to 2036
Table 56: ASEAN RF Plasma Generator Market Value (USD Billion) Projection, By Frequency 2021 to 2036
Table 57: ASEAN RF Plasma Generator Market Value (USD Billion) Projection, By Application 2021 to 2036
Table 58: ASEAN RF Plasma Generator Market Value (USD Billion) Projection, By End-use Industry 2021 to 2036
Table 59: Middle East & Africa RF Plasma Generator Market Value (USD Billion) Projection, By Frequency 2021 to 2036
Table 60: Middle East & Africa RF Plasma Generator Market Value (USD Billion) Projection, By Application 2021 to 2036
Table 61: Middle East & Africa RF Plasma Generator Market Value (USD Billion) Projection, By End-use Industry 2021 to 2036
Table 62: Middle East & Africa RF Plasma Generator Market Value (USD Billion) Projection, By Country 2021 to 2036
Table 63: GCC Countries RF Plasma Generator Market Value (USD Billion) Projection, By Frequency 2021 to 2036
Table 64: GCC Countries RF Plasma Generator Market Value (USD Billion) Projection, By Application 2021 to 2036
Table 65: GCC Countries RF Plasma Generator Market Value (USD Billion) Projection, By End-use Industry 2021 to 2036
Table 66: South Africa RF Plasma Generator Market Value (USD Billion) Projection, By Frequency 2021 to 2036
Table 67: South Africa RF Plasma Generator Market Value (USD Billion) Projection, By Application 2021 to 2036
Table 68: South Africa RF Plasma Generator Market Value (USD Billion) Projection, By End-use Industry 2021 to 2036
Table 69: Latin America RF Plasma Generator Market Value (USD Billion) Projection, By Frequency 2021 to 2036
Table 70: Latin America RF Plasma Generator Market Value (USD Billion) Projection, By Application 2021 to 2036
Table 71: Latin America RF Plasma Generator Market Value (USD Billion) Projection, By End-use Industry 2021 to 2036
Table 72: Latin America RF Plasma Generator Market Value (USD Billion) Projection, By Country 2021 to 2036
Table 73: Brazil RF Plasma Generator Market Value (USD Billion) Projection, By Frequency 2021 to 2036
Table 74: Brazil RF Plasma Generator Market Value (USD Billion) Projection, By Application 2021 to 2036
Table 75: Brazil RF Plasma Generator Market Value (USD Billion) Projection, By End-use Industry 2021 to 2036
Table 76: Mexico RF Plasma Generator Market Value (USD Billion) Projection, By Frequency 2021 to 2036
Table 77: Mexico RF Plasma Generator Market Value (USD Billion) Projection, By Application 2021 to 2036
Table 78: Mexico RF Plasma Generator Market Value (USD Billion) Projection, By End-use Industry 2021 to 2036
Table 79: Argentina RF Plasma Generator Market Value (USD Billion) Projection, By Frequency 2021 to 2036
Table 80: Argentina RF Plasma Generator Market Value (USD Billion) Projection, By Application 2021 to 2036
Table 81: Argentina RF Plasma Generator Market Value (USD Billion) Projection, By End-use Industry 2021 to 2036
Figure 01: Global RF Plasma Generator Market Value (USD Billion) Projection, By Frequency 2021 to 2036
Figure 02: Global RF Plasma Generator Market Incremental Opportunities (USD Billion) Forecast, By Frequency 2026 to 2036
Figure 03: Global RF Plasma Generator Market Value (USD Billion) Projection, By Application 2021 to 2036
Figure 04: Global RF Plasma Generator Market Incremental Opportunities (USD Billion) Forecast, By Application 2026 to 2036
Figure 05: Global RF Plasma Generator Market Value (USD Billion) Projection, By End-use Industry 2021 to 2036
Figure 06: Global RF Plasma Generator Market Incremental Opportunities (USD Billion) Forecast, By End-use Industry 2026 to 2036
Figure 07: Global RF Plasma Generator Market Value (USD Billion) Projection, By Country 2021 to 2036
Figure 08: Global RF Plasma Generator Market Incremental Opportunities (USD Billion) Forecast, By Country 2026 to 2036
Figure 09: North America RF Plasma Generator Market Value (USD Billion) Projection, By Frequency 2021 to 2036
Figure 10: North America RF Plasma Generator Market Incremental Opportunities (USD Billion) Forecast, By Frequency 2026 to 2036
Figure 11: North America RF Plasma Generator Market Value (USD Billion) Projection, By Application 2021 to 2036
Figure 12: North America RF Plasma Generator Market Incremental Opportunities (USD Billion) Forecast, By Application 2026 to 2036
Figure 13: North America RF Plasma Generator Market Value (USD Billion) Projection, By End-use Industry 2021 to 2036
Figure 14: North America RF Plasma Generator Market Incremental Opportunities (USD Billion) Forecast, By End-use Industry 2026 to 2036
Figure 15: North America RF Plasma Generator Market Value (USD Billion) Projection, By Country 2021 to 2036
Figure 16: North America RF Plasma Generator Market Incremental Opportunities (USD Billion) Forecast, By Country 2026 to 2036
Figure 17: U.S. RF Plasma Generator Market Value (USD Billion) Projection, By Frequency 2021 to 2036
Figure 18: U.S. RF Plasma Generator Market Incremental Opportunities (USD Billion) Forecast, By Frequency 2026 to 2036
Figure 19: U.S. RF Plasma Generator Market Value (USD Billion) Projection, By Application 2021 to 2036
Figure 20: U.S. RF Plasma Generator Market Incremental Opportunities (USD Billion) Forecast, By Application 2026 to 2036
Figure 21: U.S. RF Plasma Generator Market Value (USD Billion) Projection, By End-use Industry 2021 to 2036
Figure 22: U.S. RF Plasma Generator Market Incremental Opportunities (USD Billion) Forecast, By End-use Industry 2026 to 2036
Figure 23: Canada RF Plasma Generator Market Value (USD Billion) Projection, By Frequency 2021 to 2036
Figure 24: Canada RF Plasma Generator Market Incremental Opportunities (USD Billion) Forecast, By Frequency 2026 to 2036
Figure 25: Canada RF Plasma Generator Market Value (USD Billion) Projection, By Application 2021 to 2036
Figure 26: Canada RF Plasma Generator Market Incremental Opportunities (USD Billion) Forecast, By Application 2026 to 2036
Figure 27: Canada RF Plasma Generator Market Value (USD Billion) Projection, By End-use Industry 2021 to 2036
Figure 28: Canada RF Plasma Generator Market Incremental Opportunities (USD Billion) Forecast, By End-use Industry 2026 to 2036
Figure 29: Europe RF Plasma Generator Market Value (USD Billion) Projection, By Frequency 2021 to 2036
Figure 30: Europe RF Plasma Generator Market Incremental Opportunities (USD Billion) Forecast, By Frequency 2026 to 2036
Figure 31: Europe RF Plasma Generator Market Value (USD Billion) Projection, By Application 2021 to 2036
Figure 32: Europe RF Plasma Generator Market Incremental Opportunities (USD Billion) Forecast, By Application 2026 to 2036
Figure 33: Europe RF Plasma Generator Market Value (USD Billion) Projection, By End-use Industry 2021 to 2036
Figure 34: Europe RF Plasma Generator Market Incremental Opportunities (USD Billion) Forecast, By End-use Industry 2026 to 2036
Figure 35: Europe RF Plasma Generator Market Value (USD Billion) Projection, By Country 2021 to 2036
Figure 36: Europe RF Plasma Generator Market Incremental Opportunities (USD Billion) Forecast, By Country 2026 to 2036
Figure 37: U.K. RF Plasma Generator Market Value (USD Billion) Projection, By Frequency 2021 to 2036
Figure 38: U.K. RF Plasma Generator Market Incremental Opportunities (USD Billion) Forecast, By Frequency 2026 to 2036
Figure 39: U.K. RF Plasma Generator Market Value (USD Billion) Projection, By Application 2021 to 2036
Figure 40: U.K. RF Plasma Generator Market Incremental Opportunities (USD Billion) Forecast, By Application 2026 to 2036
Figure 41: U.K. RF Plasma Generator Market Value (USD Billion) Projection, By End-use Industry 2021 to 2036
Figure 42: U.K. RF Plasma Generator Market Incremental Opportunities (USD Billion) Forecast, By End-use Industry 2026 to 2036
Figure 43: Germany RF Plasma Generator Market Value (USD Billion) Projection, By Frequency 2021 to 2036
Figure 44: Germany RF Plasma Generator Market Incremental Opportunities (USD Billion) Forecast, By Frequency 2026 to 2036
Figure 45: Germany RF Plasma Generator Market Value (USD Billion) Projection, By Application 2021 to 2036
Figure 46: Germany RF Plasma Generator Market Incremental Opportunities (USD Billion) Forecast, By Application 2026 to 2036
Figure 47: Germany RF Plasma Generator Market Value (USD Billion) Projection, By End-use Industry 2021 to 2036
Figure 48: Germany RF Plasma Generator Market Incremental Opportunities (USD Billion) Forecast, By End-use Industry 2026 to 2036
Figure 49: France RF Plasma Generator Market Value (USD Billion) Projection, By Frequency 2021 to 2036
Figure 50: France RF Plasma Generator Market Incremental Opportunities (USD Billion) Forecast, By Frequency 2026 to 2036
Figure 51: France RF Plasma Generator Market Value (USD Billion) Projection, By Application 2021 to 2036
Figure 52: France RF Plasma Generator Market Incremental Opportunities (USD Billion) Forecast, By Application 2026 to 2036
Figure 53: France RF Plasma Generator Market Value (USD Billion) Projection, By End-use Industry 2021 to 2036
Figure 54: France RF Plasma Generator Market Incremental Opportunities (USD Billion) Forecast, By End-use Industry 2026 to 2036
Figure 55: Italy RF Plasma Generator Market Value (USD Billion) Projection, By Frequency 2021 to 2036
Figure 56: Italy RF Plasma Generator Market Incremental Opportunities (USD Billion) Forecast, By Frequency 2026 to 2036
Figure 57: Italy RF Plasma Generator Market Value (USD Billion) Projection, By Application 2021 to 2036
Figure 58: Italy RF Plasma Generator Market Incremental Opportunities (USD Billion) Forecast, By Application 2026 to 2036
Figure 59: Italy RF Plasma Generator Market Value (USD Billion) Projection, By End-use Industry 2021 to 2036
Figure 60: Italy RF Plasma Generator Market Incremental Opportunities (USD Billion) Forecast, By End-use Industry 2026 to 2036
Figure 61: Spain RF Plasma Generator Market Value (USD Billion) Projection, By Frequency 2021 to 2036
Figure 62: Spain RF Plasma Generator Market Incremental Opportunities (USD Billion) Forecast, By Frequency 2026 to 2036
Figure 63: Spain RF Plasma Generator Market Value (USD Billion) Projection, By Application 2021 to 2036
Figure 64: Spain RF Plasma Generator Market Incremental Opportunities (USD Billion) Forecast, By Application 2026 to 2036
Figure 65: Spain RF Plasma Generator Market Value (USD Billion) Projection, By End-use Industry 2021 to 2036
Figure 66: Spain RF Plasma Generator Market Incremental Opportunities (USD Billion) Forecast, By End-use Industry 2026 to 2036
Figure 67: The Netherlands RF Plasma Generator Market Value (USD Billion) Projection, By Frequency 2021 to 2036
Figure 68: The Netherlands RF Plasma Generator Market Incremental Opportunities (USD Billion) Forecast, By Frequency 2026 to 2036
Figure 69: The Netherlands RF Plasma Generator Market Value (USD Billion) Projection, By Application 2021 to 2036
Figure 70: The Netherlands RF Plasma Generator Market Incremental Opportunities (USD Billion) Forecast, By Application 2026 to 2036
Figure 71: The Netherlands RF Plasma Generator Market Value (USD Billion) Projection, By End-use Industry 2021 to 2036
Figure 72: The Netherlands RF Plasma Generator Market Incremental Opportunities (USD Billion) Forecast, By End-use Industry 2026 to 2036
Figure 73: Asia Pacific RF Plasma Generator Market Value (USD Billion) Projection, By Frequency 2021 to 2036
Figure 74: Asia Pacific RF Plasma Generator Market Incremental Opportunities (USD Billion) Forecast, By Frequency 2026 to 2036
Figure 75: Asia Pacific RF Plasma Generator Market Value (USD Billion) Projection, By Application 2021 to 2036
Figure 76: Asia Pacific RF Plasma Generator Market Incremental Opportunities (USD Billion) Forecast, By Application 2026 to 2036
Figure 77: Asia Pacific RF Plasma Generator Market Value (USD Billion) Projection, By End-use Industry 2021 to 2036
Figure 78: Asia Pacific RF Plasma Generator Market Incremental Opportunities (USD Billion) Forecast, By End-use Industry 2026 to 2036
Figure 79: Asia Pacific RF Plasma Generator Market Value (USD Billion) Projection, By Country 2021 to 2036
Figure 80: Asia Pacific RF Plasma Generator Market Incremental Opportunities (USD Billion) Forecast, By Country 2026 to 2036
Figure 81: China RF Plasma Generator Market Value (USD Billion) Projection, By Frequency 2021 to 2036
Figure 82: China RF Plasma Generator Market Incremental Opportunities (USD Billion) Forecast, By Frequency 2026 to 2036
Figure 83: China RF Plasma Generator Market Value (USD Billion) Projection, By Application 2021 to 2036
Figure 84: China RF Plasma Generator Market Incremental Opportunities (USD Billion) Forecast, By Application 2026 to 2036
Figure 85: China RF Plasma Generator Market Value (USD Billion) Projection, By End-use Industry 2021 to 2036
Figure 86: China RF Plasma Generator Market Incremental Opportunities (USD Billion) Forecast, By End-use Industry 2026 to 2036
Figure 87: India RF Plasma Generator Market Value (USD Billion) Projection, By Frequency 2021 to 2036
Figure 88: India RF Plasma Generator Market Incremental Opportunities (USD Billion) Forecast, By Frequency 2026 to 2036
Figure 89: India RF Plasma Generator Market Value (USD Billion) Projection, By Application 2021 to 2036
Figure 90: India RF Plasma Generator Market Incremental Opportunities (USD Billion) Forecast, By Application 2026 to 2036
Figure 91: India RF Plasma Generator Market Value (USD Billion) Projection, By End-use Industry 2021 to 2036
Figure 92: India RF Plasma Generator Market Incremental Opportunities (USD Billion) Forecast, By End-use Industry 2026 to 2036
Figure 93: Japan RF Plasma Generator Market Value (USD Billion) Projection, By Frequency 2021 to 2036
Figure 94: Japan RF Plasma Generator Market Incremental Opportunities (USD Billion) Forecast, By Frequency 2026 to 2036
Figure 95: Japan RF Plasma Generator Market Value (USD Billion) Projection, By Application 2021 to 2036
Figure 96: Japan RF Plasma Generator Market Incremental Opportunities (USD Billion) Forecast, By Application 2026 to 2036
Figure 97: Japan RF Plasma Generator Market Value (USD Billion) Projection, By End-use Industry 2021 to 2036
Figure 98: Japan RF Plasma Generator Market Incremental Opportunities (USD Billion) Forecast, By End-use Industry 2026 to 2036
Figure 99: Australia RF Plasma Generator Market Value (USD Billion) Projection, By Frequency 2021 to 2036
Figure 100: Australia RF Plasma Generator Market Incremental Opportunities (USD Billion) Forecast, By Frequency 2026 to 2036
Figure 101: Australia RF Plasma Generator Market Value (USD Billion) Projection, By Application 2021 to 2036
Figure 102: Australia RF Plasma Generator Market Incremental Opportunities (USD Billion) Forecast, By Application 2026 to 2036
Figure 103: Australia RF Plasma Generator Market Value (USD Billion) Projection, By End-use Industry 2021 to 2036
Figure 104: Australia RF Plasma Generator Market Incremental Opportunities (USD Billion) Forecast, By End-use Industry 2026 to 2036
Figure 105: South Korea RF Plasma Generator Market Value (USD Billion) Projection, By Frequency 2021 to 2036
Figure 106: South Korea RF Plasma Generator Market Incremental Opportunities (USD Billion) Forecast, By Frequency 2026 to 2036
Figure 107: South Korea RF Plasma Generator Market Value (USD Billion) Projection, By Application 2021 to 2036
Figure 108: South Korea RF Plasma Generator Market Incremental Opportunities (USD Billion) Forecast, By Application 2026 to 2036
Figure 109: South Korea RF Plasma Generator Market Value (USD Billion) Projection, By End-use Industry 2021 to 2036
Figure 110: South Korea RF Plasma Generator Market Incremental Opportunities (USD Billion) Forecast, By End-use Industry 2026 to 2036
Figure 111: ASEAN RF Plasma Generator Market Value (USD Billion) Projection, By Frequency 2021 to 2036
Figure 112: ASEAN RF Plasma Generator Market Incremental Opportunities (USD Billion) Forecast, By Frequency 2026 to 2036
Figure 113: ASEAN RF Plasma Generator Market Value (USD Billion) Projection, By Application 2021 to 2036
Figure 114: ASEAN RF Plasma Generator Market Incremental Opportunities (USD Billion) Forecast, By Application 2026 to 2036
Figure 115: ASEAN RF Plasma Generator Market Value (USD Billion) Projection, By End-use Industry 2021 to 2036
Figure 116: ASEAN RF Plasma Generator Market Incremental Opportunities (USD Billion) Forecast, By End-use Industry 2026 to 2036
Figure 117: Middle East & Africa RF Plasma Generator Market Value (USD Billion) Projection, By Frequency 2021 to 2036
Figure 118: Middle East & Africa RF Plasma Generator Market Incremental Opportunities (USD Billion) Forecast, By Frequency 2026 to 2036
Figure 119: Middle East & Africa RF Plasma Generator Market Value (USD Billion) Projection, By Application 2021 to 2036
Figure 120: Middle East & Africa RF Plasma Generator Market Incremental Opportunities (USD Billion) Forecast, By Application 2026 to 2036
Figure 121: Middle East & Africa RF Plasma Generator Market Value (USD Billion) Projection, By End-use Industry 2021 to 2036
Figure 122: Middle East & Africa RF Plasma Generator Market Incremental Opportunities (USD Billion) Forecast, By End-use Industry 2026 to 2036
Figure 123: Middle East & Africa RF Plasma Generator Market Value (USD Billion) Projection, By Country 2021 to 2036
Figure 124: Middle East & Africa RF Plasma Generator Market Incremental Opportunities (USD Billion) Forecast, By Country 2026 to 2036
Figure 125: GCC Countries RF Plasma Generator Market Value (USD Billion) Projection, By Frequency 2021 to 2036
Figure 126: GCC Countries RF Plasma Generator Market Incremental Opportunities (USD Billion) Forecast, By Frequency 2026 to 2036
Figure 127: GCC Countries RF Plasma Generator Market Value (USD Billion) Projection, By Application 2021 to 2036
Figure 128: GCC Countries RF Plasma Generator Market Incremental Opportunities (USD Billion) Forecast, By Application 2026 to 2036
Figure 129: GCC Countries RF Plasma Generator Market Value (USD Billion) Projection, By End-use Industry 2021 to 2036
Figure 130: GCC Countries RF Plasma Generator Market Incremental Opportunities (USD Billion) Forecast, By End-use Industry 2026 to 2036
Figure 131: South Africa RF Plasma Generator Market Value (USD Billion) Projection, By Frequency 2021 to 2036
Figure 132: South Africa RF Plasma Generator Market Incremental Opportunities (USD Billion) Forecast, By Frequency 2026 to 2036
Figure 133: South Africa RF Plasma Generator Market Value (USD Billion) Projection, By Application 2021 to 2036
Figure 134: South Africa RF Plasma Generator Market Incremental Opportunities (USD Billion) Forecast, By Application 2026 to 2036
Figure 135: South Africa RF Plasma Generator Market Value (USD Billion) Projection, By End-use Industry 2021 to 2036
Figure 136: South Africa RF Plasma Generator Market Incremental Opportunities (USD Billion) Forecast, By End-use Industry 2026 to 2036
Figure 137: Latin America RF Plasma Generator Market Value (USD Billion) Projection, By Frequency 2021 to 2036
Figure 138: Latin America RF Plasma Generator Market Incremental Opportunities (USD Billion) Forecast, By Frequency 2026 to 2036
Figure 139: Latin America RF Plasma Generator Market Value (USD Billion) Projection, By Application 2021 to 2036
Figure 140: Latin America RF Plasma Generator Market Incremental Opportunities (USD Billion) Forecast, By Application 2026 to 2036
Figure 141: Latin America RF Plasma Generator Market Value (USD Billion) Projection, By End-use Industry 2021 to 2036
Figure 142: Latin America RF Plasma Generator Market Incremental Opportunities (USD Billion) Forecast, By End-use Industry 2026 to 2036
Figure 143: Latin America RF Plasma Generator Market Value (USD Billion) Projection, By Country 2021 to 2036
Figure 144: Latin America RF Plasma Generator Market Incremental Opportunities (USD Billion) Forecast, By Country 2026 to 2036
Figure 145: Brazil RF Plasma Generator Market Value (USD Billion) Projection, By Frequency 2021 to 2036
Figure 146: Brazil RF Plasma Generator Market Incremental Opportunities (USD Billion) Forecast, By Frequency 2026 to 2036
Figure 147: Brazil RF Plasma Generator Market Value (USD Billion) Projection, By Application 2021 to 2036
Figure 148: Brazil RF Plasma Generator Market Incremental Opportunities (USD Billion) Forecast, By Application 2026 to 2036
Figure 149: Brazil RF Plasma Generator Market Value (USD Billion) Projection, By End-use Industry 2021 to 2036
Figure 150: Brazil RF Plasma Generator Market Incremental Opportunities (USD Billion) Forecast, By End-use Industry 2026 to 2036
Figure 151: Mexico RF Plasma Generator Market Value (USD Billion) Projection, By Frequency 2021 to 2036
Figure 152: Mexico RF Plasma Generator Market Incremental Opportunities (USD Billion) Forecast, By Frequency 2026 to 2036
Figure 153: Mexico RF Plasma Generator Market Value (USD Billion) Projection, By Application 2021 to 2036
Figure 154: Mexico RF Plasma Generator Market Incremental Opportunities (USD Billion) Forecast, By Application 2026 to 2036
Figure 155: Mexico RF Plasma Generator Market Value (USD Billion) Projection, By End-use Industry 2021 to 2036
Figure 156: Mexico RF Plasma Generator Market Incremental Opportunities (USD Billion) Forecast, By End-use Industry 2026 to 2036
Figure 157: Argentina RF Plasma Generator Market Value (USD Billion) Projection, By Frequency 2021 to 2036
Figure 158: Argentina RF Plasma Generator Market Incremental Opportunities (USD Billion) Forecast, By Frequency 2026 to 2036
Figure 159: Argentina RF Plasma Generator Market Value (USD Billion) Projection, By Application 2021 to 2036
Figure 160: Argentina RF Plasma Generator Market Incremental Opportunities (USD Billion) Forecast, By Application 2026 to 2036
Figure 161: Argentina RF Plasma Generator Market Value (USD Billion) Projection, By End-use Industry 2021 to 2036
Figure 162: Argentina RF Plasma Generator Market Incremental Opportunities (USD Billion) Forecast, By End-use Industry 2026 to 2036
Copyright © Transparency Market Research, Inc. All Rights reserved
Trust Online


RF Plasma Generator Market
