
Reports
Reports
The global recombinant plasma protein therapeutics market is driven by various factors such as shift from use of plasma-derived proteins to recombinant therapies, rise in awareness about rare disease management and increased focus on investments in rare diseases. Additionally, steady increase in the number of patients with rare hematological diseases and product approvals by regulatory authorities such as the Food and Drug Administration (FDA), European Commission, and Ministry of Health, Labour and Welfare (Japan) are anticipated to drive the market significantly during the forecast period. However, the high cost of treatment and availability of alternative therapies are likely to restrain the global market.
The global recombinant plasma protein therapeutics market has been segmented based on drug class, cell line, and indication. Based on drug class, the market has been classified into recombinant coagulation factors and human C1 esterase inhibitor. The recombinant coagulation factors segment has been further sub-segmented into recombinant coagulation factor VIII, recombinant coagulation factor IX, recombinant coagulation factor VIIa, and others. The recombinant coagulation factor VIII sub-segment is projected to account for a major share of the recombinant coagulation factors segment of the market by 2026, due to the increase in number of hemophilia A cases across the globe, new product launches, and use of recombinant plasma protein therapies for the treatment of hemophilia A. The recombinant coagulation factor VIIa sub-segment is anticipated to expand at a steady pace during the forecast period. In terms of cell line, the market has been categorized into Chinese hamster ovary (CHO) cell line, baby hamster kidney (BHK) cell line, human embryonic kidney (HEK) cell line, and others. The Chinese hamster ovary (CHO) cell line segment is expected to expand at a prominent CAGR due to an increase in the utilization of CHO cell lines for manufacturing therapeutic products. Based on indication, the market has been segregated into hemophilia A, hemophilia B, Von Willebrand disease, and others
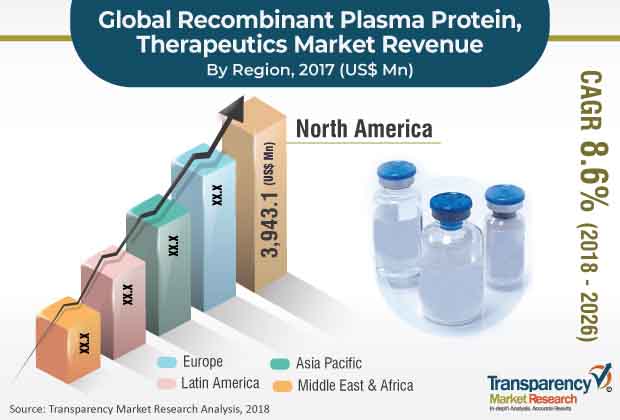
Based on region, the global recombinant plasma protein therapeutics market has been segmented into North America, Europe, Asia Pacific, Latin America, and Middle East & Africa. North America is anticipated to hold a prominent share of the global market. In North America, the market in the U.S. is anticipated to expand at a rapid pace, due to a surge in the demand for recombinant coagulation factor VII and IX, rise in the emphasis on the management of rare diseases such as hemophilia A, hemophilia B, and Von Willebrand disease, and increase in the number of market players offering recombinant plasma proteins. Additionally, market players are focused on increasing global presence through distribution agreements, partnerships, and geographical expansion.
In Europe, increasing number of established biotechnology & pharmaceutical companies and research institutes, universities, and commercial players are obtaining funds for research & development studies in the field of recombinant DNA technology, which in turn is projected to boost the market. Furthermore, advancements in genetic engineering and biotechnology in countries such as Germany, U.K., and France significantly drive the opportunities of developing new therapeutics products for diseases. Moreover, in January 2017, CSL Limited received approval and marketing authorization from European Commission for AFSTYLA, indicated for the treatment of Hemophilia A. Such approvals increased the availability of drugs in Europe.
Major players operating in the global recombinant plasma protein therapeutics market include CSL Limited, Shire (Takeda Pharmaceutical Company Limited), Octapharma, Novo Nordisk A/S, Bayer AG, Bioverativ Therapeutics, Inc. (Sanofi), Aptevo Therapeutics, Pharming Group NV, and Pfizer Inc.
Expanding Cases of Hemophilia among many Individuals to Bring Profitable Growth for the Recombinant Plasma Protein Therapeutics Market
The recombinant plasma protein therapeutics market will gain considerable growth opportunities during the forecast period of 2018-2026 owing to an increase in the demand for advanced therapies across a large chunk of the global populace. Technological advancements and an increase in research and development activities coupled with the rising geriatric population are some major factors that will influence the growth to a considerable extent.
1. Preface
1.1. Market Definition and Scope
1.2. Market Segmentation
1.3. Key Research Objectives
1.4. Research Highlights
2. Assumptions and Research Methodology
3. Executive Summary : Global Recombinant Plasma Protein Therapeutics Market
4. Market Overview
4.1. Introduction
4.1.1. Product Definition
4.1.2. Industry Evolution / Developments
4.2. Overview
4.3. Market Dynamics
4.3.1. Drivers
4.3.1.1 Shift from use of Plasma Derived Proteins to Recombinant Therapies
4.3.1.2 Rising Awareness about Rare Disease Management
4.3.1.3 Increasing Focus on Investments in Rare Disease
4.3.2. Restraints
4.3.2.1 High Cost of Treatment
4.3.2.2 Availability of Alternative Therapies
4.3.3. Opportunities
4.3.3.1 Growth Opportunities in Developing Markets
4.3.3.2 Strategic Approaches such as Partnership and Distribution Agreements
4.4. Global Recombinant Plasma Protein Therapeutics Market Analysis and Forecast, 2016–2026
5. Key Insights
5.1. New Product Launch and Regulatory Approvals
5.2. Key Mergers & Acquisitions
5.3. Regulatory Scenario by Region/Country
6. Global Recombinant Plasma Protein Therapeutics Market Analysis and Forecast, by Drug Class
6.1. Introduction & Definition
6.2. Key Findings / Developments
6.3. Global Recombinant Plasma Protein Therapeutics Market Value Forecast, by Drug Class, 2016–2026
6.3.1. Recombinant Coagulation Factors
6.3.1.1. Recombinant Coagulation Factor VIII
6.3.1.2. Recombinant Coagulation Factor IX
6.3.1.3. Recombinant Coagulation Factor VIIa
6.3.1.4. Others
6.3.2. Human C1 Esterase Inhibitor
6.4. Global Recombinant Plasma Protein Therapeutics Market Attractiveness, by Drug Class
7. Global Recombinant Plasma Protein Therapeutics Market Analysis and Forecast, by Cell Line
7.1. Introduction & Definition
7.2. Key Findings / Developments
7.3. Global Recombinant Plasma Protein Therapeutics Market Value Forecast, by Cell Line, 2016–2026
7.3.1. Chinese Hamster Ovary (CHO) Cell Line
7.3.2. Baby Hamster Kidney (BHK) Cell Line
7.3.3. Human Embryonic Kidney (HEK) Cell Line
7.3.4. Others
7.4. Global Recombinant Plasma Protein Therapeutics Market Attractiveness, by Cell Line
8. Global Recombinant Plasma Protein Therapeutics Market Analysis and Forecast, by Indication
8.1. Introduction & Definition
8.2. Key Findings / Developments
8.3. Global Recombinant Plasma Protein Therapeutics Market Value Forecast, by Indication, 2016–2026
8.3.1. Hemophilia A
8.3.2. Hemophilia B
8.3.3. Von Willebrand Disease
8.3.4. Others
8.4. Global Recombinant Plasma Protein Therapeutics Market Attractiveness, by Indication
9. Global Recombinant Plasma Protein Therapeutics Market Analysis and Forecast, by Region
9.1. Key Findings
9.2. Global Recombinant Plasma Protein Therapeutics Market Value Forecast, by Region
9.2.1. North America
9.2.2. Europe
9.2.3. Asia Pacific
9.2.4. Latin America
9.2.5. Middle East & Africa
9.3. Global Recombinant Plasma Protein Therapeutics Market Attractiveness, by Region
10. North America Recombinant Plasma Protein Therapeutics Market Analysis and Forecast
10.1. Introduction
10.1.1. Key Findings
10.2. North America Recombinant Plasma Protein Therapeutics Market Value Forecast, by Drug Class, 2016–2026
10.2.1. Recombinant Coagulation Factors
10.2.1.1. Recombinant Coagulation Factor VIII
10.2.1.2. Recombinant Coagulation Factor IX
10.2.1.3. Recombinant Coagulation Factor VIIa
10.2.1.4. Others
10.2.2. Human C1 Esterase Inhibitor
10.3. North America Recombinant Plasma Protein Therapeutics Market Value Forecast, by Cell Line, 2016–2026
10.3.1. Chinese Hamster Ovary (CHO) Cell Line
10.3.2. Baby Hamster Kidney (BHK) Cell Line
10.3.3. Human Embryonic Kidney (HEK) Cell Line
10.3.4. Others
10.4. North America Recombinant Plasma Protein Therapeutics Market Value Forecast, by Indication, 2016–2026
10.4.1. Hemophilia A
10.4.2. Hemophilia B
10.4.3. Von Willebrand Disease
10.4.4. Others
10.5. North America Recombinant Plasma Protein Therapeutics Market Value Forecast, by Country, 2016–2026
10.5.1. U.S.
10.5.2. Canada
10.6. North America Recombinant Plasma Protein Therapeutics Market Attractiveness Analysis
10.6.1. By Drug Class
10.6.2. By Cell Line
10.6.3. By Indication
10.6.4. By Country
11. Europe Recombinant Plasma Protein Therapeutics Market Analysis and Forecast
11.1. Introduction
11.1.1. Key Findings
11.2. Europe Recombinant Plasma Protein Therapeutics Market Value Forecast, by Drug Class, 2016–2026
11.2.1. Recombinant Coagulation Factors
11.2.1.1. Recombinant Coagulation Factor VIII
11.2.1.2. Recombinant Coagulation Factor IX
11.2.1.3. Recombinant Coagulation Factor VIIa
11.2.1.4. Others
11.2.2. Human C1 Esterase Inhibitor
11.3. Europe Recombinant Plasma Protein Therapeutics Market Value Forecast, by Cell Line, 2016–2026
11.3.1. Chinese Hamster Ovary (CHO) Cell Line
11.3.2. Baby Hamster Kidney (BHK) Cell Line
11.3.3. Human Embryonic Kidney (HEK) Cell Line
11.3.4. Others
11.4. Europe Recombinant Plasma Protein Therapeutics Market Value Forecast, by Indication, 2016–2026
11.4.1. Hemophilia A
11.4.2. Hemophilia B
11.4.3. Von Willebrand Disease
11.4.4. Others
11.5. Europe Recombinant Plasma Protein Therapeutics Market Value Forecast, by Country/Sub-region, 2016–2026
11.5.1. Germany
11.5.2. U.K.
11.5.3. France
11.5.4. Spain
11.5.5. Italy
11.5.6. Rest of Europe
11.6. Europe Recombinant Plasma Protein Therapeutics Market Attractiveness Analysis
11.6.1. By Drug Class
11.6.2. By Cell Line
11.6.3. By Indication
11.6.4. By Country/Sub-region
12. Asia Pacific Recombinant Plasma Protein Therapeutics Market Analysis and Forecast
12.1. Introduction
12.1.1. Key Findings
12.2. Asia Pacific Recombinant Plasma Protein Therapeutics Market Value Forecast, by Drug Class, 2016–2026
12.2.1. Recombinant Coagulation Factors
12.2.1.1. Recombinant Coagulation Factor VIII
12.2.1.2. Recombinant Coagulation Factor IX
12.2.1.3. Recombinant Coagulation Factor VIIa
12.2.1.4. Others
12.2.2. Human C1 Esterase Inhibitor
12.3. Asia Pacific Recombinant Plasma Protein Therapeutics Market Value Forecast, by Cell Line, 2016–2026
12.3.1. Chinese Hamster Ovary (CHO) Cell Line
12.3.2. Baby Hamster Kidney (BHK) Cell Line
12.3.3. Human Embryonic Kidney (HEK) Cell Line
12.3.4. Others
12.4. Asia Pacific Recombinant Plasma Protein Therapeutics Market Value Forecast, by Indication, 2016–2026
12.4.1. Hemophilia A
12.4.2. Hemophilia B
12.4.3. Von Willebrand Disease
12.4.4. Others
12.5. Asia Pacific Recombinant Plasma Protein Therapeutics Market Value Forecast, by Country/Sub-region, 2016–2026
12.5.1. China
12.5.2. Japan
12.5.3. India
12.5.4. Australia & New Zealand
12.5.5. Rest of Asia Pacific
12.6. Asia Pacific Recombinant Plasma Protein Therapeutics Market Attractiveness Analysis
12.6.1. By Drug Class
12.6.2. By Cell Line
12.6.3. By Indication
12.6.4. By Country/Sub-region
13. Latin America Recombinant Plasma Protein Therapeutics Market Analysis and Forecast
13.1. Introduction
13.1.1. Key Findings
13.2. Latin America Recombinant Plasma Protein Therapeutics Market Value Forecast, by Drug Class, 2016–2026
13.2.1. Recombinant Coagulation Factors
13.2.1.1. Recombinant Coagulation Factor VIII
13.2.1.2. Recombinant Coagulation Factor IX
13.2.1.3. Recombinant Coagulation Factor VIIa
13.2.1.4. Others
13.2.2. Human C1 Esterase Inhibitor
13.3. Latin America Recombinant Plasma Protein Therapeutics Market Value Forecast, by Cell Line, 2016–2026
13.3.1. Chinese Hamster Ovary (CHO) Cell Line
13.3.2. Baby Hamster Kidney (BHK) Cell Line
13.3.3. Human Embryonic Kidney (HEK) Cell Line
13.3.4. Others
13.4. Latin America Recombinant Plasma Protein Therapeutics Market Value Forecast, by Indication, 2016–2026
13.4.1. Hemophilia A
13.4.2. Hemophilia B
13.4.3. Von Willebrand Disease
13.4.4. Others
13.5. Latin America Recombinant Plasma Protein Therapeutics Market Value Forecast, by Country/Sub-region, 2016–2026
13.5.1. Brazil
13.5.2. Mexico
13.5.3. Rest of Latin America
13.6. Latin America Recombinant Plasma Protein Therapeutics Market Attractiveness Analysis
13.6.1. By Drug Class
13.6.2. By Cell Line
13.6.3. By Indication
13.6.4. By Country/Sub-region
14. Middle East & Africa Recombinant Plasma Protein Therapeutics Market Analysis and Forecast
14.1. Introduction
14.1.1. Key Findings
14.2. Middle East & Africa Recombinant Plasma Protein Therapeutics Market Value Forecast, by Drug Class, 2016–2026
14.2.1. Recombinant Coagulation Factors
14.2.1.1. Recombinant Coagulation Factor VIII
14.2.1.2. Recombinant Coagulation Factor IX
14.2.1.3. Recombinant Coagulation Factor VIIa
14.2.1.4. Others
14.2.2. Human C1 Esterase Inhibitor
14.3. Middle East & Africa Recombinant Plasma Protein Therapeutics Market Value Forecast, by Cell Line, 2016–2026
14.3.1. Chinese Hamster Ovary (CHO) Cell Line
14.3.2. Baby Hamster Kidney (BHK) Cell Line
14.3.3. Human Embryonic Kidney (HEK) Cell Line
14.3.4. Others
14.4. Middle East & Africa Recombinant Plasma Protein Therapeutics Market Value Forecast, by Indication, 2016–2026
14.4.1. Hemophilia A
14.4.2. Hemophilia B
14.4.3. Von Willebrand Disease
14.4.4. Others
14.5. Middle East & Africa Recombinant Plasma Protein Therapeutics Market Value Forecast, by Country/Sub-region, 2016–2026
14.5.1. GCC Countries
14.5.2. South Africa
14.5.3. Rest of Middle East & Africa
14.6. Middle East & Africa Recombinant Plasma Protein Therapeutics Market Attractiveness Analysis
14.6.1. By Drug Class
14.6.2. By Cell Line
14.6.3. By Indication
14.6.4. By Country/Sub-region
15. Competitive Landscape
15.1. Market Player – Competition Matrix (By Tier and Size of companies)
15.2. Market Share Analysis By Company (2016)
15.3. Company Profiles
15.3.1. CSL Limited
15.3.1.1. Company Details
15.3.1.2. Products Portfolio
15.3.1.3. Financial Overview
15.3.1.4. Strategic Overview
15.3.1.5. SWOT Analysis
15.3.2. Shire (Takeda Pharmaceutical Company Limited)
15.3.2.1. Company Details
15.3.2.2. Products Portfolio
15.3.2.3. Financial Overview
15.3.2.4. Strategic Overview
15.3.2.5. SWOT Analysis
15.3.3. Octapharma
15.3.3.1. Company Details
15.3.3.2. Products Portfolio
15.3.3.3. Financial Overview
15.3.3.4. Strategic Overview
15.3.3.5. SWOT Analysis
15.3.4. Novo Nordisk A/S
15.3.4.1. Company Details
15.3.4.2. Products Portfolio
15.3.4.3. Financial Overview
15.3.4.4. Strategic Overview
15.3.4.5. SWOT Analysis
15.3.5. Bayer AG
15.3.5.1. Company Details
15.3.5.2. Products Portfolio
15.3.5.3. Financial Overview
15.3.5.4. Strategic Overview
15.3.5.5. SWOT Analysis
15.3.6. Pfizer Inc.
15.3.6.1. Company Details
15.3.6.2. Products Portfolio
15.3.6.3. Financial Overview
15.3.6.4. Strategic Overview
15.3.6.5. SWOT Analysis
15.3.7. Bioverativ Therapeutics, Inc. (Sanofi)
15.3.7.1. Company Details
15.3.7.2. Products Portfolio
15.3.7.3. Financial Overview
15.3.7.4. Strategic Overview
15.3.7.5. SWOT Analysis
15.3.8. Aptevo Therapeutics
15.3.8.1. Company Details
15.3.8.2. Products Portfolio
15.3.8.3. Financial Overview
15.3.8.4. Strategic Overview
15.3.8.5. SWOT Analysis
15.3.9. Pharming Group NV
15.3.9.1. Company Details
15.3.9.2. Products Portfolio
15.3.9.3. Financial Overview
15.3.9.4. Strategic Overview
15.3.9.5. SWOT Analysis
List of Tables
Table 01 Global Recombinant Plasma Protein Therapeutics Market, New Product Launch and Regulatory Approvals, 2017?2018
Table 02 Global Recombinant Plasma Protein Therapeutics Market, New Product Launch and Regulatory Approvals, 2015?2017
Table 03 Global Recombinant Plasma Protein Therapeutics Market, New Product Launch and Regulatory Approvals, 2014?2015
Table 04 Global Recombinant Plasma Protein Therapeutics Market Value (US$ Mn) Forecast, by Drug Class, 2016–2026
Table 05 Global Recombinant Plasma Protein Therapeutics Market Value (US$ Mn) Forecast, by Recombinant Coagulation Factors, 2016–2026
Table 06 Global Recombinant Plasma Protein Therapeutics Market Value (US$ Mn) Forecast, by Cell Line, 2016–2026
Table 07 Global Recombinant Plasma Protein Therapeutics Market Value (US$ Mn) Forecast, by Indication, 2016–2026
Table 08 Global Recombinant Plasma Protein Therapeutics Market Value (US$ Mn) Forecast, by Region, 2016–2026
Table 09 North America Recombinant Plasma Protein Therapeutics Market Value (US$ Mn) Forecast, by Drug Class, 2016–2026
Table 10 North America Recombinant Plasma Protein Therapeutics Market Value (US$ Mn) Forecast, by Recombinant Coagulation Factors, 2016–2026
Table 11 North America Recombinant Plasma Protein Therapeutics Market Value (US$ Mn) Forecast, by Cell Line, 2016–2026
Table 12 North America Recombinant Plasma Protein Therapeutics Market Value (US$ Mn) Forecast, by Indication, 2016–2026
Table 13 North America Recombinant Plasma Protein Therapeutics Market Value (US$ Mn) Forecast, by Country, 2016–2026
Table 14 Europe Recombinant Plasma Protein Therapeutics Market Value (US$ Mn) Forecast, by Drug Class, 2016–2026
Table 15 Europe Recombinant Plasma Protein Therapeutics Market Value (US$ Mn) Forecast, by Recombinant Coagulation Factors, 2016–2026
Table 16 Europe Recombinant Plasma Protein Therapeutics Market Value (US$ Mn) Forecast, by Cell Line, 2016–2026
Table 17 Europe Recombinant Plasma Protein Therapeutics Market Value (US$ Mn) Forecast, by Indication, 2016–2026
Table 18 Europe Recombinant Plasma Protein Therapeutics Market Value (US$ Mn) Forecast, by Country/Sub-region, 2016–2026
Table 19 Asia Pacific Recombinant Plasma Protein Therapeutics Market Value (US$ Mn) Forecast, by Drug Class, 2016–2026
Table 20 Asia Pacific Recombinant Plasma Protein Therapeutics Market Value (US$ Mn) Forecast, by Recombinant Coagulation Factors, 2016–2026
Table 21 Asia Pacific Recombinant Plasma Protein Therapeutics Market Value (US$ Mn) Forecast, by Cell Line, 2016–2026
Table 22 Asia Pacific Recombinant Plasma Protein Therapeutics Market Value (US$ Mn) Forecast, by Indication, 2016–2026
Table 23 Asia Pacific Recombinant Plasma Protein Therapeutics Market Value (US$ Mn) Forecast, by Country/Sub-region, 2016–2026
Table 24 Latin America Recombinant Plasma Protein Therapeutics Market Value (US$ Mn) Forecast, by Drug Class, 2016–2026
Table 25 Latin America Recombinant Plasma Protein Therapeutics Market Value (US$ Mn) Forecast, by Recombinant Coagulation Factors, 2016–2026
Table 26 Latin America Recombinant Plasma Protein Therapeutics Market Value (US$ Mn) Forecast, by Cell Line, 2016–2026
Table 27 Latin America Recombinant Plasma Protein Therapeutics Market Value (US$ Mn) Forecast, by Indication, 2016–2026
Table 28 Latin America Recombinant Plasma Protein Therapeutics Market Value (US$ Mn) Forecast, by Country/Sub-region, 2016–2026
Table 29 Middle East & Africa Recombinant Plasma Protein Therapeutics Market Value (US$ Mn) Forecast, by Drug Class, 2016–2026
Table 30 Middle East & Africa Recombinant Plasma Protein Therapeutics Market Value (US$ Mn) Forecast, by Recombinant Coagulation Factors, 2016–2026
Table 31 Middle East & Africa Recombinant Plasma Protein Therapeutics Market Value (US$ Mn) Forecast, by Cell Line, 2016–2026
Table 32 Middle East & Africa Recombinant Plasma Protein Therapeutics Market Value (US$ Mn) Forecast, by Indication, 2016–2026
Table 33 Middle East & Africa Recombinant Plasma Protein Therapeutics Market Value (US$ Mn) Forecast, by Country/Sub-region, 2016–2026
List of Figures
Figure 01 Global Recombinant Plasma Protein Therapeutics Market Value (US$ Mn) and Distribution, by Region, 2017 and 2026
Figure 02 Global Recombinant Plasma Protein Therapeutics Market Value (US$ Mn), by Drug Class, 2017
Figure 03 Global Recombinant Plasma Protein Therapeutics Market Value (US$ Mn) Forecast and Y-o-Y Growth (%) Projection, 2016–2026
Figure 04 Global Recombinant Plasma Protein Therapeutics Market Value Share Analysis, by Drug Class, 2017 and 2026
Figure 05 Global Recombinant Plasma Protein Therapeutics Market Value (US$ Mn) & Y-o-Y Growth (%), by Recombinant Coagulation Factors, 2016–2026
Figure 06 Global Recombinant Plasma Protein Therapeutics Market Value (US$ Mn) & Y-o-Y Growth (%), by Human C1 Esterase Inhibitor, 2016–2026
Figure 07 Global Recombinant Plasma Protein Therapeutics Market Attractiveness Analysis, by Drug Class, 2018–2026
Figure 08 Global Recombinant Plasma Protein Therapeutics Market Value Share Analysis, by Cell Line, 2017 and 2026
Figure 09 Global Recombinant Plasma Protein Therapeutics Market Value (US$ Mn) and Y-o-Y Growth (%) Forecast, by Chinese Hamster Ovary (CHO) Cell Line , 2016–2026
Figure 10 Global Recombinant Plasma Protein Therapeutics Market Value (US$ Mn) and Y-o-Y Growth (%) Forecast, by Baby Hamster Kidney (BHK) Cell Line, 2016–2026
Figure 11 Global Recombinant Plasma Protein Therapeutics Market Value (US$ Mn) and Y-o-Y Growth (%) Forecast, by Human Embryonic Kidney (HEK) Cell Line, 2016–2026
Figure 12 Global Recombinant Plasma Protein Therapeutics Market Value (US$ Mn) and Y-o-Y Growth (%) Forecast, by Others, 2016–2026
Figure 13 Global Recombinant Plasma Protein Therapeutics Market Attractiveness Analysis, by Cell Line, 2018–2026
Figure 14 Global Recombinant Plasma Protein Therapeutics Market Value Share Analysis, by Indication, 2017 and 2026
Figure 15 Global Recombinant Plasma Protein Therapeutics Market Value (US$ Mn) & Y-o-Y Growth (%), by Hemophilia A, 2016–2026
Figure 16 Global Recombinant Plasma Protein Therapeutics Market Value (US$ Mn) & Y-o-Y Growth (%), by Hemophilia B, 2016–2026
Figure 17 Global Recombinant Plasma Protein Therapeutics Market Value (US$ Mn) & Y-o-Y Growth (%), by Von Willebrand Disease, 2016–2026
Figure 18 Global Recombinant Plasma Protein Therapeutics Market Value (US$ Mn) & Y-o-Y Growth (%), by Others, 2016–2026
Figure 19 Global Recombinant Plasma Protein Therapeutics Market Attractiveness Analysis, by Indication, 2018–2026
Figure 20 Global Recombinant Plasma Protein Therapeutics Market Value Share Analysis, by Region, 2017 and 2026
Figure 21 Global Recombinant Plasma Protein Therapeutics Market Attractiveness Analysis, by Region, 2018–2026
Figure 22 North America Recombinant Plasma Protein Therapeutics Market Value (US$ Mn) Forecast and Y-o-Y Growth (%) Projection, 2016–2026
Figure 23 North America Recombinant Plasma Protein Therapeutics Market Value Share Analysis, by Drug Class, 2017 and 2026
Figure 24 North America Recombinant Plasma Protein Therapeutics Market Attractiveness Analysis, by Drug Class, 2018–2026
Figure 25 North America Recombinant Plasma Protein Therapeutics Market Value Share Analysis, by Cell Line, 2017 and 2026
Figure 26 North America Recombinant Plasma Protein Therapeutics Market Attractiveness Analysis, by Cell Line, 2018–2026
Figure 27 North America Recombinant Plasma Protein Therapeutics Market Value Share Analysis, by Indication, 2017 and 2026
Figure 28 North America Recombinant Plasma Protein Therapeutics Market Attractiveness Analysis, by Indication, 2018–2026
Figure 29 North America Recombinant Plasma Protein Therapeutics Market Value Share Analysis, by Country, 2017 and 2026
Figure 30 North America Recombinant Plasma Protein Therapeutics Market Attractiveness Analysis, by Country, 2018–2026
Figure 31 Europe Recombinant Plasma Protein Therapeutics Market Value (US$ Mn) Forecast and Y-o-Y Growth (%) Projection, 2016–2026
Figure 32 Europe Recombinant Plasma Protein Therapeutics Market Value Share Analysis, by Drug Class, 2017 and 2026
Figure 33 Europe Recombinant Plasma Protein Therapeutics Market Attractiveness Analysis, by Drug Class, 2018–2026
Figure 34 Europe Recombinant Plasma Protein Therapeutics Market Value Share Analysis, by Cell Line, 2017 and 2026
Figure 35 Europe Recombinant Plasma Protein Therapeutics Market Attractiveness Analysis, by Cell Line, 2018–2026
Figure 36 Europe Recombinant Plasma Protein Therapeutics Market Value Share Analysis, by Indication, 2017 and 2026
Figure 37 Europe Recombinant Plasma Protein Therapeutics Market Attractiveness Analysis, by Indication, 2018–2026
Figure 38 Europe Recombinant Plasma Protein Therapeutics Market Value Share Analysis, by Country/Sub-region, 2017 and 2026
Figure 39 Europe Recombinant Plasma Protein Therapeutics Market Attractiveness Analysis, by Country/Sub-region, 2018–2026
Figure 40 Asia Pacific Recombinant Plasma Protein Therapeutics Market Value (US$ Mn) Forecast and Y-o-Y Growth (%) Projection, 2016–2026
Figure 41 Asia Pacific Recombinant Plasma Protein Therapeutics Market Value Share Analysis, by Drug Class, 2017 and 2026
Figure 42 Asia Pacific Recombinant Plasma Protein Therapeutics Market Attractiveness Analysis, by Drug Class, 2018–2026
Figure 43 Asia Pacific Recombinant Plasma Protein Therapeutics Market Value Share Analysis, by Cell Line, 2017 and 2026
Figure 44 Asia Pacific Recombinant Plasma Protein Therapeutics Market Attractiveness Analysis, by Cell Line, 2018–2026
Figure 45 Asia Pacific Recombinant Plasma Protein Therapeutics Market Value Share Analysis, by Indication, 2017 and 2026
Figure 46 Asia Pacific Recombinant Plasma Protein Therapeutics Market Attractiveness Analysis, by Indication, 2018–2026
Figure 47 Asia Pacific Recombinant Plasma Protein Therapeutics Market Value Share Analysis, by Country/Sub-region, 2017 and 2026
Figure 48 Asia Pacific Recombinant Plasma Protein Therapeutics Market Attractiveness Analysis, by Country/Sub-region, 2018–2026
Figure 49 Latin America Recombinant Plasma Protein Therapeutics Market Value (US$ Mn) Forecast and Y-o-Y Growth (%) Projection, 2016–2026
Figure 50 Latin America Recombinant Plasma Protein Therapeutics Market Value Share Analysis, by Drug Class, 2017 and 2026
Figure 51 Latin America Recombinant Plasma Protein Therapeutics Market Attractiveness Analysis, by Drug Class, 2018–2026
Figure 52 Latin America Recombinant Plasma Protein Therapeutics Market Value Share Analysis, by Cell Line, 2017 and 2026
Figure 53 Latin America Recombinant Plasma Protein Therapeutics Market Attractiveness Analysis, by Cell Line, 2018–2026
Figure 54 Latin America Recombinant Plasma Protein Therapeutics Market Value Share Analysis, by Indication, 2017 and 2026
Figure 55 Latin America Recombinant Plasma Protein Therapeutics Market Attractiveness Analysis, by Indication, 2018–2026
Figure 56 Latin America Recombinant Plasma Protein Therapeutics Market Value Share Analysis, by Country/Sub-region, 2017 and 2026
Figure 57 Latin America Recombinant Plasma Protein Therapeutics Market Attractiveness Analysis, by Country/Sub-region, 2018–2026
Figure 58 Middle East & Africa Recombinant Plasma Protein Therapeutics Market Value (US$ Mn) Forecast and Y-o-Y Growth (%) Projection, 2016–2026
Figure 59 Middle East & Africa Recombinant Plasma Protein Therapeutics Market Value Share Analysis, by Drug Class, 2017 and 2026
Figure 60 Middle East & Africa Recombinant Plasma Protein Therapeutics Market Attractiveness Analysis, by Drug Class, 2018–2026
Figure 61 Middle East & Africa Recombinant Plasma Protein Therapeutics Market Value Share Analysis, by Cell Line, 2017 and 2026
Figure 62 Middle East & Africa Recombinant Plasma Protein Therapeutics Market Attractiveness Analysis, by Cell Line, 2018–2026
Figure 63 Middle East & Africa Recombinant Plasma Protein Therapeutics Market Value Share Analysis, by Indication, 2017 and 2026
Figure 64 Middle East & Africa Recombinant Plasma Protein Therapeutics Market Attractiveness Analysis, by Indication, 2018–2026
Figure 65 Middle East & Africa Recombinant Plasma Protein Therapeutics Market Value Share Analysis, by Country/Sub-region, 2017 and 2026
Figure 66 Middle East & Africa Recombinant Plasma Protein Therapeutics Market Attractiveness Analysis, by Country/Sub-region, 2018–2026
Figure 67 Global Recombinant Plasma Protein Therapeutics Market Share, by Company, 2017
Figure 68 CSL Behring Business Segment Revenue (US$ Mn) and Y-o-Y Growth (%), 2016–2018
Figure 69 CSL Limited R&D Expenses (US$ Mn) and Y-o-Y Growth (%), 2016–2018
Figure 70 CSL Limited Breakdown of Net Sales (%), by Region, 2018
Figure 71 CSL Behring Breakdown of Net Sales (%), by Therapeutic Area, 2018
Figure 72 Shire Revenue (US$ Mn) and Y-o-Y Growth (%), 2015–2017
Figure 73 Shire R&D Expenses (US$ Mn) and Y-o-Y Growth (%), 2015–2017
Figure 74 Shire Breakdown of Net Sales (% Share), by Region (2017)
Figure 75 Shire Breakdown of Net Sales (% Share), by Therapeutic Areas (2017)
Figure 76 Octapharma Revenue (US$ Mn) and Y-o-Y Growth (%), 2015–2017
Figure 77 Octapharma Research and Development Expenses, 2015-2017
Figure 78 Novo Nordisk A/S Biopharmaceuticals Business Segment Revenue (US$ Mn) and Y-o-Y Growth (%), 2017–2018
Figure 79 Novo Nordisk A/S R&D Expenses (US$ Mn) and Y-o-Y Growth (%), 2016–2018
Figure 80 Novo Nordisk A/S Breakdown of Net Sales (%), by Region, 2018
Figure 81 Novo Nordisk A/S Biopharmaceuticals Business Segment Breakdown of Net Sales (%), by Therapeutic Area, 2018
Figure 82 Bayer AG Revenue (US$ Mn) and Y-o-Y Growth (%), 2016–2017
Figure 83 Bayer AG Pharmaceutical Business Segment R&D Expenses (US$ Mn) and Y-o-Y Growth (%), 2015–2017
Figure 84 Bayer AG Breakdown of Net Sales (%), by Region, 2017
Figure 85 Bayer AG Breakdown of Net Sales (%), by Business Segment, 2017
Figure 86 Pfizer Inc. Revenue (US$ Mn) and Y-o-Y Growth (%), 2015–2017
Figure 87 Pfizer Inc. R&D Expenses (US$ Mn) and Y-o-Y Growth (%), 2015–2017
Figure 88 Pfizer Inc. Breakdown of Net Sales (%), by Region, 2017
Figure 89 Pfizer Inc. Breakdown of Net Sales (%), by Business Segment, 2017
Figure 90 Bioverativ Therapeutics, Inc. Pharmaceuticals Segment Revenue (US$ Mn) and Y-o-Y Growth (%), 2015–2017
Figure 91 Bioverativ Therapeutics, Inc. R&D Expenses (US$ Mn) and Y-o-Y Growth (%), 2014–2017
Figure 92 Bioverativ Therapeutics, Inc. Breakdown of Net Sales (%), by Country, 2017
Figure 93 Aptevo Therapeutics Revenue (US$ Mn) and Y-o-Y Growth (%), 2016–2017
Figure 94 Aptevo Therapeutics IXINITY R&D Expenses (US$ Mn) and Y-o-Y Growth (%), 2015-2017
Figure 95 Pharming Group NV Revenue (US$ Mn) and Y-o-Y Growth (%), 2015–2017
Figure 96 Pharming Group NV R&D Expenses (US$ Mn) and Y-o-Y Growth (%), 2015–2017
Figure 97 Pharming Group NV Breakdown of Net Sales (%), by Region, 2017
Copyright © Transparency Market Research, Inc. All Rights reserved
Trust Online

Recombinant Plasma Protein Therapeutics Market