
Reports
Reports
Analysts’ Viewpoint
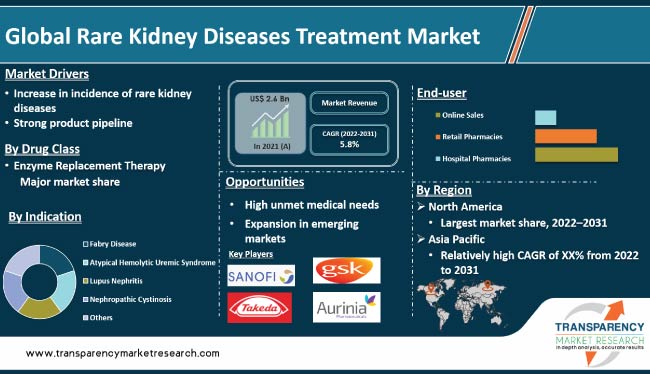
Incidence of acute renal failure and rare kidney diseases is rising significantly across the globe. Just a few treatment options have been approved for rare urinary diseases. New product launch and cost-effective treatments & services are likely to create lucrative opportunities for manufacturers in the global rare kidney diseases treatment market in the next few years, especially in developing countries.
Demand for rare kidney diseases treatment is rising across the globe, primarily in countries in Asia such as China and India, due to high incidence rate and need for effective kidney disease management. Leading players are focusing on developing new treatment options for rare kidney diseases.
Of the 150 different rare kidney diseases, majority are inherited. Each uncommon kidney disease has a unique set of symptoms; however, these rare diseases could collectively present overlapping diagnostic and therapeutic difficulties.
Small number of affected people, unknown disease causes, lack of biomarkers for diagnosis, and requirement of complex care are the key obstacles during diagnosis and treatment of these diseases. Rare kidney diseases are also known as rare urinary diseases. Rare kidney diseases include Fabry disease, atypical hemolytic uremic syndrome, lupus nephritis, nephropathic cystinosis, renal nutcracker syndrome, and others. Polycystic kidney disease (PKD) is a rare genetic kidney disease, in which clusters of cysts develop primarily within kidneys, resulting in an increase in size of the kidney.
Treatments for rare urinary diseases include enzyme replacement therapy, monoclonal antibodies, and others. Renal nutcracker syndrome is a rare vein compression disorder. It mostly affects left renal (kidney) vein. Symptoms of this disease include flank pain and blood in the urine. Increase in incidence of kidney diseases and rise in awareness among the people are the other factors driving market progress. Surge in geriatric population is likely to augment the global rare kidney diseases treatment market share in the near future.
The burden of various rare kidney diseases is expected to rise significantly across the globe in the next few years. Kidney-related problems, such as Fabry disease, atypical hemolytic uremic syndrome, lupus nephritis, nephropathic cystinosis, renal nutcracker syndrome, polycystic kidney disease (PKD), distal renal tubular acidosis, and IgA nephropathy disease, have increased.
Several rare kidney diseases remain untreated, which could cause serious health issues in future. According to the World Health Organization, the Fabry disease is estimated to affect approximately 1 in 40,000 men and around 1 in 20,000 women in the U.S. As per the National Organization for Rare Disorders, Inc., the incidence rate of atypical hemolytic uremic syndrome is 2 individuals per 1 million among the general population in the country.
Major players are focusing on designing and developing new products for rare kidney diseases. For instance, Reata Pharmaceuticals has one innovative product, Bardoxolone methyl, in phase 3 for the treatment of polycystic kidney disease. Amicus Therapeutics has one product, Migalastat Monotherapy, in phase 3 for the treatment of the Fabry disease.
In terms of drug class, the enzyme replacement therapy segment accounted for significant market share in 2021. Enzyme replacement therapy products are primarily used for the Fabry disease. These products include Galafold, Replagal, and Fabrazyme.
Increase in usage of enzyme replacement therapy in the treatment of the Fabry disease is likely to drive the segment during the forecast period. Strong enzyme replacement product pipeline is another major factor propelling the segment. Companies are focusing on launching enzyme replacement therapy products in untapped regions. This is likely to augment the segment in the near future.
Based on indication, the Fabry disease segment is projected to account for major share of the industry during the forecast period. Rise in patient population with the Fabry disease and increase in usage of novel treatments, such as chaperone therapy, are driving the segment. Intensive R&D activities, strong product pipeline, and rise in usage of substrate reduction therapies & enzyme replacement therapies are likely to propel the segment.
Galafold, Replagal, and Fabrazyme are the products approved for Fabry disease treatment; more products in phase 3 are projected to be launched in the near future. Furthermore, surge in number of people diagnosed with the Fabry disease is anticipated to increase the demand for innovative treatment options.
In terms of distribution channel, the hospital pharmacies segment is likely to account for significant share during the forecast period. Preference for hospitals for the treatment of rare urinary diseases has increased due to favorable reimbursement policies. Therefore, the segment is anticipated to grow at a rapid pace during the forecast period.
Rise in awareness about rare kidney diseases & novel treatment options and the trend of utilization of new & improved drugs by patients and physicians are projected to propel the segment in the next few years.
As per global rare kidney diseases treatment market forecast, North America accounted for the largest share of around 45% in 2021. The region's dominance can be ascribed to the increase in incidence rate of the Fabry disease, atypical hemolytic uremic syndrome, lupus nephritis, nephropathic cystinosis, and others kidney diseases. Increase in acceptance of technologically advanced products, surge in healthcare expenditure, early access to advanced technologies, and favorable funding by governments & charitable trusts for healthcare research are anticipated to accelerate market development in North America during the forecast period. The U.S. dominated the market in the region owing to factors such as presence of major players and increase in new product approvals from the U.S. FDA.
Asia Pacific is anticipated to be the fastest growing region for rare kidney diseases treatment during the forecast period. The region is anticipated to record significant market expansion from 2022 to 2031 due to large patient base in countries such as India and China and rise in awareness about rare urinary diseases.
The global rare kidney diseases treatment market is consolidated, with the presence of small number of leading players. Most of the companies are investing significantly in research & development, primarily to develop innovative rare kidney diseases treatment. Companies in business have adopted growth strategies such as expansion of product portfolio and mergers & acquisitions.
Calliditas Therapeutics AB, GSK plc., Aurinia Pharmaceuticals, Inc., Amicus Therapeutics, Inc., Shire (Takeda Pharmaceutical Company Limited), Sanofi, Advicenne, Alexion Pharmaceuticals, Inc., Horizon Therapeutics plc, Otsuka Pharmaceutical Co., Ltd. and Reata Pharmaceuticals, Inc. are the prominent players in the global rare kidney diseases treatment market.
These players have been profiled in the market report based on parameters such as company overview, portfolio, segments, strategies, and recent developments.
|
Attribute |
Detail |
|
Size in 2021 |
US$ 2.6 Bn |
|
Forecast (Value) in 2031 |
More than US$ 4.6 Bn |
|
Growth Rate (CAGR) |
5.8% |
|
Forecast Period |
2022–2031 |
|
Historical Data Available for |
2017–2020 |
|
Quantitative Units |
US$ Bn for Value |
|
Market Analysis |
It includes segment analysis as well as regional level analysis. Moreover, qualitative analysis includes drivers, restraints, opportunities, key trends, Porter’s Five Forces analysis, value chain analysis, and key trend analysis. |
|
Competition Landscape |
|
|
Format |
Electronic (PDF) + Excel |
|
Segmentation |
|
|
Regions Covered |
|
|
Countries Covered |
|
|
Companies Profiled |
|
|
Customization Scope |
Available upon request |
|
Pricing |
Available upon request |
The industry was valued at US$ 2.6 Bn in 2021.
It is projected to reach more than US$ 4.6 Bn by 2031.
The CAGR is anticipated to be 5.8% from 2022 to 2031.
Increase in incidence of rare kidney diseases and strong product pipeline.
North America is likely to account for major share from 2022 to 2031.
Calliditas Therapeutics AB, GSK plc, Aurinia Pharmaceuticals, Inc., Amicus Therapeutics, Inc., Shire (Takeda Pharmaceutical Company Limited), Sanofi, Advicenne, Alexion Pharmaceuticals, Inc., Horizon Therapeutics plc, Otsuka Pharmaceutical Co., Ltd., and Reata Pharmaceuticals, Inc.
1. Preface
1.1. Market Definition and Scope
1.2. Market Segmentation
1.3. Key Research Objectives
1.4. Research Highlights
2. Assumptions and Research Methodology
3. Executive Summary: Global Rare Kidney Diseases Treatment Market
4. Market Overview
4.1. Introduction
4.1.1. Definition
4.1.2. Industry Evolution / Developments
4.2. Overview
4.3. Market Dynamics
4.3.1. Drivers
4.3.2. Restraints
4.3.3. Opportunities
4.4. Global Rare Kidney Diseases Treatment Market Analysis and Forecast, 2017–2031
5. Key Insights
5.1. Pipeline Analysis
5.2. Disease Epidemiology
5.3. Key Industry Events
5.4. COVID-19 Impact Analysis
6. Global Rare Kidney Diseases Treatment Market Analysis and Forecast, by Indication
6.1. Introduction & Definition
6.2. Key Findings / Developments
6.3. Market Value Forecast, by Indication, 2017–2031
6.3.1. Fabry Disease
6.3.2. Atypical Hemolytic Uremic Syndrome
6.3.3. Lupus Nephritis
6.3.4. Nephropathic Cystinosis
6.3.5. Others
6.4. Market Attractiveness Analysis, by Indication
7. Global Rare Kidney Diseases Treatment Market Analysis and Forecast, by Drug Class
7.1. Introduction & Definition
7.2. Key Findings / Developments
7.3. Market Value Forecast, by Drug Class, 2017–2031
7.3.1. Enzyme Replacement Therapy
7.3.2. Monoclonal Antibodies
7.3.3. Others
7.4. Market Attractiveness Analysis, by Drug Class
8. Global Rare Kidney Diseases Treatment Market Analysis and Forecast, by Distribution Channel
8.1. Introduction & Definition
8.2. Key Findings / Developments
8.3. Market Value Forecast, by Distribution Channel, 2017–2031
8.3.1. Hospital Pharmacies
8.3.2. Retail Pharmacies
8.3.3. Online Sales
8.4. Market Attractiveness Analysis, by Distribution Channel
9. Global Rare Kidney Diseases Treatment Market Analysis and Forecast, by Region
9.1. Key Findings
9.2. Market Value Forecast, by Region
9.2.1. North America
9.2.2. Europe
9.2.3. Asia Pacific
9.2.4. Latin America
9.2.5. Middle East & Africa
9.3. Market Attractiveness Analysis, by Region
10. North America Rare Kidney Diseases Treatment Market Analysis and Forecast
10.1. Introduction
10.1.1. Key Findings
10.2. Market Value Forecast, by Indication, 2017–2031
10.2.1. Fabry Disease
10.2.2. Atypical Hemolytic Uremic Syndrome
10.2.3. Lupus Nephritis
10.2.4. Nephropathic Cystinosis
10.2.5. Others
10.3. Market Value Forecast, by Drug Class, 2017–2031
10.3.1. Enzyme Replacement Therapy
10.3.2. Monoclonal Antibodies
10.3.3. Others
10.4. Market Value Forecast, by Distribution Channel, 2017–2031
10.4.1. Hospital Pharmacies
10.4.2. Retail Pharmacies
10.4.3. Online Sales
10.5. Market Value Forecast, by Country, 2017–2031
10.5.1. U.S.
10.5.2. Canada
10.6. Market Attractiveness Analysis
10.6.1. By Indication
10.6.2. By Drug Class
10.6.3. By Distribution Channel
10.6.4. By Country
11. Europe Rare Kidney Diseases Treatment Market Analysis and Forecast
11.1. Introduction
11.1.1. Key Findings
11.2. Market Value Forecast, by Indication, 2017–2031
11.2.1. Fabry Disease
11.2.2. Atypical Hemolytic Uremic Syndrome
11.2.3. Lupus Nephritis
11.2.4. Nephropathic Cystinosis
11.2.5. Others
11.3. Market Value Forecast, by Drug Class, 2017–2031
11.3.1. Enzyme Replacement Therapy
11.3.2. Monoclonal Antibodies
11.3.3. Others
11.4. Market Value Forecast, by Distribution Channel, 2017–2031
11.4.1. Hospital Pharmacies
11.4.2. Retail Pharmacies
11.4.3. Online Sales
11.5. Market Value Forecast, by Country/Sub-region, 2017–2031
11.5.1. Germany
11.5.2. U.K.
11.5.3. France
11.5.4. Italy
11.5.5. Spain
11.5.6. Rest of Europe
11.6. Market Attractiveness Analysis
11.6.1. By Indication
11.6.2. By Drug Class
11.6.3. By Distribution Channel
11.6.4. By Country/Sub-region
12. Asia Pacific Rare Kidney Diseases Treatment Market Analysis and Forecast
12.1. Introduction
12.1.1. Key Findings
12.2. Market Value Forecast, by Indication, 2017–2031
12.2.1. Fabry Disease
12.2.2. Atypical Hemolytic Uremic Syndrome
12.2.3. Lupus Nephritis
12.2.4. Nephropathic Cystinosis
12.2.5. Others
12.3. Market Value Forecast, by Drug Class, 2017–2031
12.3.1. Enzyme Replacement Therapy
12.3.2. Monoclonal Antibodies
12.3.3. Others
12.4. Market Value Forecast, by Distribution Channel, 2017–2031
12.4.1. Hospital Pharmacies
12.4.2. Retail Pharmacies
12.4.3. Online Sales
12.5. Market Value Forecast, by Country/Sub-region, 2017–2031
12.5.1. China
12.5.2. Japan
12.5.3. India
12.5.4. Australia & New Zealand
12.5.5. Rest of Asia Pacific
12.6. Market Attractiveness Analysis
12.6.1. By Indication
12.6.2. By Drug Class
12.6.3. By Distribution Channel
12.6.4. By Country/Sub-region
13. Latin America Rare Kidney Diseases Treatment Market Analysis and Forecast
13.1. Introduction
13.1.1. Key Findings
13.2. Market Value Forecast, by Indication, 2017–2031
13.2.1. Fabry Disease
13.2.2. Atypical Hemolytic Uremic Syndrome
13.2.3. Lupus Nephritis
13.2.4. Nephropathic Cystinosis
13.2.5. Others
13.3. Market Value Forecast, by Drug Class, 2017–2031
13.3.1. Enzyme Replacement Therapy
13.3.2. Monoclonal Antibodies
13.3.3. Others
13.4. Market Value Forecast, by Distribution Channel, 2017–2031
13.4.1. Hospital Pharmacies
13.4.2. Retail Pharmacies
13.4.3. Online Sales
13.5. Market Value Forecast, by Country/Sub-region, 2017–2031
13.5.1. Brazil
13.5.2. Mexico
13.5.3. Rest of Latin America
13.6. Market Attractiveness Analysis
13.6.1. By Indication
13.6.2. By Drug Class
13.6.3. By Distribution Channel
13.6.4. By Country/Sub-region
14. Middle East & Africa Rare Kidney Diseases Treatment Market Analysis and Forecast
14.1. Introduction
14.1.1. Key Findings
14.2. Market Value Forecast, by Indication, 2017–2031
14.2.1. Fabry Disease
14.2.2. Atypical Hemolytic Uremic Syndrome
14.2.3. Lupus Nephritis
14.2.4. Nephropathic Cystinosis
14.2.5. Others
14.3. Market Value Forecast, by Drug Class, 2017–2031
14.3.1. Enzyme Replacement Therapy
14.3.2. Monoclonal Antibodies
14.3.3. Others
14.4. Market Value Forecast, by Distribution Channel, 2017–2031
14.4.1. Hospital Pharmacies
14.4.2. Retail Pharmacies
14.4.3. Online Sales
14.5. Market Value Forecast, by Country/Sub-region, 2017–2031
14.5.1. GCC Countries
14.5.2. South Africa
14.5.3. Rest of Middle East & Africa
14.6. Market Attractiveness Analysis
14.6.1. By Indication
14.6.2. By Drug Class
14.6.3. By Distribution Channel
14.6.4. By Country/Sub-region
15. Competition Landscape
15.1. Market Player - Competition Matrix (by tier and size of companies)
15.2. Market Share Analysis, by Company, 2021
15.3. Company Profiles
15.3.1. Calliditas Therapeutics AB
15.3.1.1. Company Overview (HQ, Business Segments, Employee Strength)
15.3.1.2. Product Overview
15.3.1.3. Financial Overview
15.3.1.4. Strategy Overview
15.3.1.5. SWOT Analysis
15.3.2. GSK plc
15.3.2.1. Company Overview (HQ, Business Segments, Employee Strength)
15.3.2.2. Product Overview
15.3.2.3. Financial Overview
15.3.2.4. Strategy Overview
15.3.2.5. SWOT Analysis
15.3.3. Aurinia Pharmaceuticals, Inc.
15.3.3.1. Company Overview (HQ, Business Segments, Employee Strength)
15.3.3.2. Product Overview
15.3.3.3. Financial Overview
15.3.3.4. Strategy Overview
15.3.3.5. SWOT Analysis
15.3.4. Amicus Therapeutics, Inc.
15.3.4.1. Company Overview (HQ, Business Segments, Employee Strength)
15.3.4.2. Product Overview
15.3.4.3. Financial Overview
15.3.4.4. Strategy Overview
15.3.4.5. SWOT Analysis
15.3.5. Shire (Takeda Pharmaceutical Company Limited)
15.3.5.1. Company Overview (HQ, Business Segments, Employee Strength)
15.3.5.2. Product Overview
15.3.5.3. Financial Overview
15.3.5.4. Strategy Overview
15.3.5.5. SWOT Analysis
15.3.6. Sanofi
15.3.6.1. Company Overview (HQ, Business Segments, Employee Strength)
15.3.6.2. Product Overview
15.3.6.3. Financial Overview
15.3.6.4. Strategy Overview
15.3.6.5. SWOT Analysis
15.3.7. Advicenne
15.3.7.1. Company Overview (HQ, Business Segments, Employee Strength)
15.3.7.2. Product Overview
15.3.7.3. Financial Overview
15.3.7.4. Strategy Overview
15.3.7.5. SWOT Analysis
15.3.8. Alexion Pharmaceuticals, Inc.
15.3.8.1. Company Overview (HQ, Business Segments, Employee Strength)
15.3.8.2. Product Overview
15.3.8.3. Financial Overview
15.3.8.4. Strategy Overview
15.3.8.5. SWOT Analysis
15.3.9. Horizon Therapeutics plc
15.3.9.1. Company Overview (HQ, Business Segments, Employee Strength)
15.3.9.2. Product Overview
15.3.9.3. Financial Overview
15.3.9.4. Strategy Overview
15.3.9.5. SWOT Analysis
15.3.10. Otsuka Pharmaceutical Co., Ltd.
15.3.10.1. Company Overview (HQ, Business Segments, Employee Strength)
15.3.10.2. Product Overview
15.3.10.3. Financial Overview
15.3.10.4. Strategy Overview
15.3.10.5. SWOT Analysis
15.3.11. Reata Pharmaceuticals, Inc.
15.3.11.1. Company Overview (HQ, Business Segments, Employee Strength)
15.3.11.2. Product Overview
15.3.11.3. Financial Overview
15.3.11.4. Strategy Overview
15.3.11.5. SWOT Analysis
List of Tables
Table 01: Global Rare Kidney Diseases Treatment Market Value (US$ Mn) Forecast, by Indication, 2017–2031
Table 02: Global Rare Kidney Diseases Treatment Market Value (US$ Mn) Forecast, by Drug Class, 2017–2031
Table 03: Global Rare Kidney Diseases Treatment Market Value (US$ Mn) Forecast, by Distribution Channel, 2017–2031
Table 04: Global Rare Kidney Diseases Treatment Market Value (US$ Mn) Forecast, by Region, 2017–2031
Table 05: North America Rare Kidney Diseases Treatment Market Value (US$ Mn) Forecast, by Country, 2017–2031
Table 06: North America Rare Kidney Diseases Treatment Market Value (US$ Mn) Forecast, by Indication, 2017–2031
Table 07: North America Rare Kidney Diseases Treatment Market Value (US$ Mn) Forecast, by Drug Class, 2017–2031
Table 08: North America Rare Kidney Diseases Treatment Market Value (US$ Mn) Forecast, by Distribution Channel, 2017–2031
Table 09: Europe Rare Kidney Diseases Treatment Market Value (US$ Mn) Forecast, by Country/Sub-region, 2017–2031
Table 10: Europe Rare Kidney Diseases Treatment Market Value (US$ Mn) Forecast, by Indication, 2017–2031
Table 11: Europe Rare Kidney Diseases Treatment Market Value (US$ Mn) Forecast, by Drug Class, 2017–2031
Table 12: Europe Rare Kidney Diseases Treatment Market Value (US$ Mn) Forecast, by Distribution Channel, 2017–2031
Table 13: Asia Pacific Rare Kidney Diseases Treatment Market Value (US$ Mn) Forecast, by Country/Sub-region, 2017–2031
Table 14: Asia Pacific Rare Kidney Diseases Treatment Market Value (US$ Mn) Forecast, by Indication, 2017–2031
Table 15: Asia Pacific Rare Kidney Diseases Treatment Market Value (US$ Mn) Forecast, by Drug Class, 2017–2031
Table 16: Asia Pacific Rare Kidney Diseases Treatment Market Value (US$ Mn) Forecast, by Distribution Channel, 2017–2031
Table 17: Latin America Rare Kidney Diseases Treatment Market Value (US$ Mn) Forecast, by Country/Sun-region, 2017–2031
Table 18: Latin America Rare Kidney Diseases Treatment Market Value (US$ Mn) Forecast, by Indication, 2017–2031
Table 19: Latin America Rare Kidney Diseases Treatment Market Value (US$ Mn) Forecast, by Drug Class, 2017–2031
Table 20: Latin America Rare Kidney Diseases Treatment Market Value (US$ Mn) Forecast, by Distribution Channel, 2017–2031
Table 21: Middle east and Africa Rare Kidney Diseases Treatment Market Value (US$ Mn) Forecast, by Country/Sun-region, 2017–2031
Table 22: Middle east and Africa Rare Kidney Diseases Treatment Market Value (US$ Mn) Forecast, by Indication, 2017–2031
Table 23: Middle east and Africa Rare Kidney Diseases Treatment Market Value (US$ Mn) Forecast, by Drug Class, 2017–2031
Table 24: Middle east and Africa Rare Kidney Diseases Treatment Market Value (US$ Mn) Forecast, by Distribution Channel, 2017–2031
Table 25: Business Overview (Calliditas Therapeutics AB)
Table 26: Business Overview (GSK plc)
Table 27: Business Overview (Aurinia Pharmaceuticals, Inc.)
Table 28: Business Overview (Amicus Therapeutics, Inc.)
Table 29: Business Overview (Shire (Takeda Pharmaceutical Company Limited)
Table 30: Business Overview (Sanofi)
Table 31: Business Overview (Advicenne)
Table 32: Business Overview (Alexion Pharmaceuticals, Inc.)
Table 33: Business Overview (Horizon Therapeutics plc)
Table 34: Business Overview (Otsuka Pharmaceutical Co., Ltd.)
Table 35: Business Overview (Reata Pharmaceuticals, Inc.)
List of Figures
Figure 01: Global Rare Kidney Diseases Treatment Market Value (US$ Mn) Forecast, 2017–2031
Figure 02: Global Rare Kidney Diseases Treatment Market Value Share, by Indication (2021)
Figure 03: Global Rare Kidney Diseases Treatment Market Value Share, by Drug Class (2021)
Figure 04: Global Rare Kidney Diseases Treatment Market Value Share, by Distribution Channel (2021)
Figure 05: Global Rare Kidney Diseases Treatment Market Value Share, by Region (2021)
Figure 06: Global Rare Kidney Diseases Treatment Market Value Share Analysis, by Indication, 2021 and 2031
Figure 07: Global Rare Kidney Diseases Treatment Market Attractiveness Analysis, by Indication, 2022–2031
Figure 08: Global Rare Kidney Diseases Treatment Market Revenue (US$ Mn), by Fabry Disease, 2017–2031
Figure 09: Global Rare Kidney Diseases Treatment Market Revenue (US$ Mn), by Atypical Hemolytic Uremic Syndrome, 2017–2031
Figure 10: Global Rare Kidney Diseases Treatment Market Revenue (US$ Mn), by Lupus Nephritis, 2017–2031
Figure 11: Global Rare Kidney Diseases Treatment Market Revenue (US$ Mn), by Nephropathic Cystinosis, 2017–2031
Figure 12: Global Rare Kidney Diseases Treatment Market Revenue (US$ Mn), by Others, 2017–2031
Figure 13: Global Rare Kidney Diseases Treatment Market Value Share Analysis, by Drug Class, 2021 and 2031
Figure 14: Global Rare Kidney Diseases Treatment Market Attractiveness Analysis, by Drug Class, 2022–2031
Figure 15: Global Rare Kidney Diseases Treatment Market Revenue (US$ Mn), by Enzyme Replacement Therapy, 2017–2031
Figure 16: Global Rare Kidney Diseases Treatment Market Revenue (US$ Mn), by Monoclonal Antibodies, 2017–2031
Figure 17: Global Rare Kidney Diseases Treatment Market Revenue (US$ Mn), by Others, 2017–2031
Figure 18: Global Rare Kidney Diseases Treatment Market Value Share Analysis, by Distribution Channel, 2021 and 2031
Figure 19: Global Rare Kidney Diseases Treatment Market Attractiveness Analysis, by Distribution Channel, 2022–2031
Figure 20: Global Rare Kidney Diseases Treatment Market Revenue (US$ Mn), by Hospital Pharmacies, 2017–2031
Figure 21: Global Rare Kidney Diseases Treatment Market Revenue (US$ Mn), by Retail Pharmacies, 2017–2031
Figure 22: Global Rare Kidney Diseases Treatment Market Revenue (US$ Mn), by Online Pharmacies, 2017–2031
Figure 23: Global Rare Kidney Diseases Treatment Market Value Share Analysis, by Region, 2021 and 2031
Figure 24: Global Rare Kidney Diseases Treatment Market Attractiveness Analysis, by Region, 2022-2031
Figure 25: North America Rare Kidney Diseases Treatment Market Value (US$ Mn) Forecast and Y-o-Y Growth (%) Projection, 2017–2031
Figure 26: North America Rare Kidney Diseases Treatment Market Value Share (%), by Country, 2021 and 2031
Figure 27: North America Rare Kidney Diseases Treatment Market Attractiveness Analysis, by Country, 2022–2031
Figure 28: North America Rare Kidney Diseases Treatment Market Value Share Analysis, by Indication, 2021 and 2031
Figure 29: North America Rare Kidney Diseases Treatment Market Attractiveness Analysis, by Indication, 2022–2031
Figure 30: North America Rare Kidney Diseases Treatment Market Value Share Analysis, by Drug Class, 2021 and 2031
Figure 31: North America Rare Kidney Diseases Treatment Market Attractiveness Analysis, by Drug Class, 2022–2031
Figure 32: North America Rare Kidney Diseases Treatment Market Value Share Analysis, by Distribution Channel, 2021 and 2031
Figure 33: North America Rare Kidney Diseases Treatment Market Attractiveness Analysis, by Distribution Channel, 2022–2031
Figure 34: Europe Rare Kidney Diseases Treatment Market Value (US$ Mn) Forecast and Y-o-Y Growth (%) Projection, 2017–2031
Figure 35: Europe Rare Kidney Diseases Treatment Market Value Share (%), by Country/Sub-region, 2021 and 2031
Figure 36: Europe Rare Kidney Diseases Treatment Market Attractiveness Analysis, by Country/Sub-region, 2022–2031
Figure 37: Europe Rare Kidney Diseases Treatment Market Value Share Analysis, by Indication, 2021 and 2031
Figure 38: Europe Rare Kidney Diseases Treatment Market Attractiveness Analysis, by Indication, 2022–2031
Figure 39: Europe Rare Kidney Diseases Treatment Market Value Share Analysis, by Drug Class, 2021 and 2031
Figure 40: Europe Rare Kidney Diseases Treatment Market Attractiveness Analysis, by Drug Class, 2022–2031
Figure 41: Europe Rare Kidney Diseases Treatment Market Value Share Analysis, by Distribution Channel, 2021 and 2031
Figure 42: Europe Rare Kidney Diseases Treatment Market Attractiveness Analysis, by Distribution Channel, 2022–2031
Figure 43: Asia Pacific Rare Kidney Diseases Treatment Market Value (US$ Mn) Forecast and Y-o-Y Growth (%) Projection, 2017–2031
Figure 44: Asia Pacific Rare Kidney Diseases Treatment Market Value Share (%), by Country/Sub-region, 2021 and 2031
Figure 45: Asia Pacific Rare Kidney Diseases Treatment Market Attractiveness Analysis, by Country/Sub-region, 2022–2031
Figure 46: Asia Pacific Rare Kidney Diseases Treatment Market Value Share Analysis, by Indication, 2021 and 2031
Figure 47: Asia Pacific Rare Kidney Diseases Treatment Market Attractiveness Analysis, by Indication, 2022–2031
Figure 48: Asia Pacific Rare Kidney Diseases Treatment Market Value Share Analysis, by Drug Class, 2021 and 2031
Figure 49: Asia Pacific Rare Kidney Diseases Treatment Market Attractiveness Analysis, by Drug Class, 2022–2031
Figure 50: Asia Pacific Rare Kidney Diseases Treatment Market Value Share Analysis, by Distribution Channel, 2021 and 2031
Figure 51: Asia Pacific Rare Kidney Diseases Treatment Market Attractiveness Analysis, by Distribution Channel, 2022–2031
Figure 52: Latin America Rare Kidney Diseases Treatment Market Value (US$ Mn) Forecast and Y-o-Y Growth (%) Projection, 2017–2031
Figure 53: Latin America Rare Kidney Diseases Treatment Market Value Share Analysis, by Indication, 2021 and 2031
Figure 54: Latin America Rare Kidney Diseases Treatment Market Attractiveness Analysis, by Indication, 2022–2031
Figure 55: Latin America Rare Kidney Diseases Treatment Market Value Share Analysis, by Drug Class, 2021 and 2031
Figure 56: Latin America Rare Kidney Diseases Treatment Market Attractiveness Analysis, by Drug Class, 2022–2031
Figure 57: Latin America Rare Kidney Diseases Treatment Market Value Share Analysis, by Distribution Channel, 2021 and 2031
Figure 58: Latin America Rare Kidney Diseases Treatment Market Attractiveness Analysis, by Distribution Channel, 2022–2031
Figure 59: Middle east and Africa Rare Kidney Diseases Treatment Market Value (US$ Mn) Forecast and Y-o-Y Growth (%) Projection, 2017–2031
Figure 60: Middle east and Africa Rare Kidney Diseases Treatment Market Value Share Analysis, by Indication, 2021 and 2031
Figure 61: Middle east and Africa Rare Kidney Diseases Treatment Market Attractiveness Analysis, by Indication, 2022–2031
Figure 62: Middle east and Africa Rare Kidney Diseases Treatment Market Value Share Analysis, by Drug Class, 2021 and 2031
Figure 63: Middle east and Africa Rare Kidney Diseases Treatment Market Attractiveness Analysis, by Drug Class, 2022–2031
Figure 64: Middle east and Africa Rare Kidney Diseases Treatment Market Value Share Analysis, by Distribution Channel, 2021 and 2031
Figure 65: Middle east and Africa Rare Kidney Diseases Treatment Market Attractiveness Analysis, by Distribution Channel, 2022–2031
Figure 66: Global Rare Kidney Diseases Treatment Market Share, by Company, 2021
Copyright © Transparency Market Research, Inc. All Rights reserved
Trust Online

Rare Kidney Diseases Treatment Market