
Reports
Reports
Analysts’ Viewpoint on Market Scenario
Rise in adoption of rapid prototyping for the R&D of consumer goods, vehicles, medical products, aerospace & defense parts, and industrial parts is driving the rapid prototyping market size. Rapid prototyping helps in the development and approval of new products or concepts. It enables designers to gain ready feedback from clients based on an actual physical model of the product rather than a concept.
The industry in Asia Pacific is expected to grow at a rapid pace, owing to government policies fueling expansion of the manufacturing sector in the region. Major rapid prototyping companies are investing significantly in the R&D of new products and solutions to remain competitive in the market.
Rapid prototyping is a fabrication process of physical parts and models. It facilities the assembly of various products using Computer-aided Design (CAD). Rapid tooling and rapid prototyping use additive manufacturing for the fast fabrication of physical parts. Rapid prototyping can be integrated with investment casting to facilitate rapid casting. ABS, polystyrene, or rigid polyurethane foam are often used in plastic prototyping.
Rapid prototyping offers several benefits such as reduced design & development time, low overall product development and functionality testing costs, and elimination of risk. It enables greater user involvement during the design stages of product development and can help evaluate human factors and ergonomics.
Artificial Intelligence (AI), Augmented Reality (AR), advanced robotics, smart devices, and 3D printing are revolutionizing the manufacturing process in various industries. Decentralization in 3D printing is expected to determine the future of rapid prototyping in the next few years. 3D printing has led to significant advancements in heavy industry, automotive, consumer products, medical, healthcare, and aerospace sectors. These five industries account for 76% of the global manufacturing sector.
Rapid prototyping services help the manufacturing industry by promoting quick product development. They enable lean manufacturing and boost product adaptability. These technological advancements in the sector assure high product customizations and boost revenues.
Increase in adoption of digital manufacturing is anticipated to fuel market expansion during the forecast period. Digital manufacturing relies on computer-based systems for simulation, 3D visualization, and analytics. These tools help ease the product manufacturing process. AI is gradually becoming a necessary component in rapid prototype development. The ability to make data-driven decisions and conduct seamless testing are some of the most important characteristics of excellent rapid prototyping.
Surge in the R&D of autonomous driving is also expected to fuel the rapid prototyping market statistics in the next few years. Rapid development of autonomous vehicles boosts the demand for new control platforms and sensor technologies. Adoption of rapid prototyping in the automotive sector can fulfill these requirements and help establish the necessary testing and development framework.
The manufacturing industry in the U.S. represents around 11% of the country’s gross domestic product, yet it accounts for 35% of the productivity growth and 60% of exports. The manufacturing sector plays a major role in innovation in the U.S., as it is responsible for 55% of all patents and 70% of all R&D expenditures.
Top rapid prototyping companies in the U.S. are launching new products to enhance their market share. In February 2022, Fictiv, a leading provider of 3D printing & rapid prototyping services in the U.S., launched its Enterprise Business Solutions portfolio to address the most pressing challenges faced in product manufacturing. This portfolio has three digitally-enabled solutions that solve new product development, engineer-to-order, and MRO challenges relating to efficiency, speed, and quality. These three parameters include NPD acceleration (supports engineering teams from early-stage prototypes to production-grade tests), ETO rapid production, and MRO digital inventory. Thus, expansion in the manufacturing sector is propelling the market.
The aerospace industry has significant regulatory requirements as well as expectations of quality and top-of-the-line performance. Complying with all these demands can be challenging. However, rapid prototyping is uniquely positioned to address these challenges.
3D printing and rapid prototyping services can contribute to nearly every aspect of aerospace design, including electronics, lighting, interior and exterior components, and mechanical parts. They can assist the aerospace sector with everything from the basic design concept to specific production parts and even maintenance.
The aerospace & defense industry continues to boast impressive contributions to the world economy despite the adverse impact of the COVID-19 pandemic. The industry accounted for 1.8% of the total U.S. GDP, recording around US$ 382 Bn in revenue. Thus, expansion in the aerospace & defense industry is likely to drive the rapid prototyping industry during the forecast period.
Rapid prototyping is employed in the aerospace & defense industry for diverse functions such as production of lightweight parts, reduction of assembly part numbers, and improvement in workflow and production quality with custom-made jigs and fixtures. It is also utilized to evaluate the design variations of parts through 3D visualization and estimate the surface quality of models. These methods make it possible to create complex patterns more quickly and affordably.
Several materials used in the production of aerospace products are significantly expensive. Rapid prototyping allows for testing and evaluation with less expensive alternatives before investing in tooling and committing to molding parts in the production materials. Therefore, rapid prototyping enables companies to reduce the cost of design and create products by reducing manufacturing time and wastage of materials.
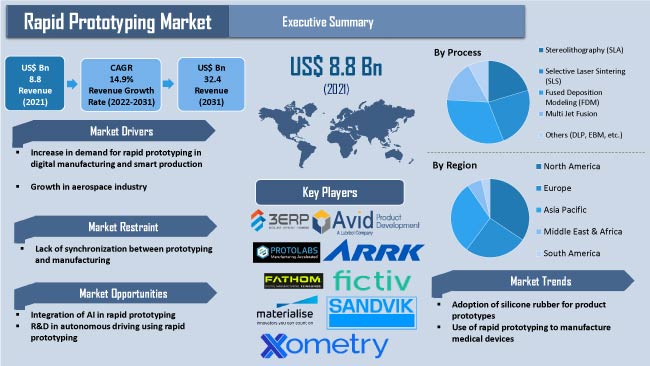
According to the latest rapid prototyping market trends, the Fused Deposition Modeling (FDM) process segment held major share of 31.0% of the industry in 2021. FDM is an additive manufacturing process, which builds parts layer-by-layer by selectively depositing melted materials in a predetermined path. It is the most cost-effective method of manufacturing bespoke thermoplastic prototypes due to the wide availability of FDM printers at low cost. Thus, FDM offers cheaper manufacturing processes than other additive manufacturing techniques. It is increasingly being used for the development of functional prototypes, production and manufacturing tools, concept models, and quality parts.
According to the latest global rapid prototyping market analysis, the polymer material segment dominated the industry and held 44.0% share in 2021. Polymer offers various benefits such as low cost, robustness, and simple fabrication, which are beneficial in the exploratory stages of research.
Designers often use rapid prototype plastic parts to replace metal prototypes in order to save production costs. Acrylonitrile Butadiene Styrene (ABS) is a general-purpose thermoplastic polymer, which offers good rigidity, high impact strength, heat resistance, low-temperature resistance, chemical resistance, high mechanical strength, and ease of processing.
According to the latest rapid prototyping market forecast, North America is expected to hold largest share of the industry during 2022-2031. The region held around 34.0% share of the industry, in terms of value, in 2021. Presence of well-established players and rise in investment in R&D activities across automotive, aerospace & defense, and healthcare industries are driving market revenue in the region. According to the National Center for Science and Engineering Statistics (NCSES) within the National Science Foundation, investment in R&D activities in the U.S. totaled around US$ 606.1 Bn in 2018.
Asia Pacific and Europe are prominent regions and held 30.0% and 25.0% share, respectively, of the global rapid prototyping business in 2021. Surge in public and private investments in 3D printing technologies and applications and increase in acceptance of 3D-printed organs and implants are driving the market in these regions. Market vendors in Europe are launching new products to expand their revenues. In January 2020, Xometry Europe GmbH launched an instant quote 3D printing service in Europe.
The industry is fragmented, with a large number of large-medium scale vendors controlling minority share. Vendors are engaged in product development through comprehensive investments in R&D activities. They are expanding their rapid prototyping market share through various growth strategies such as collaborations, partnerships, and mergers and acquisitions.
Major players operating in the industry include 3E Rapid Prototyping Ltd., ARRK Corporation, Avid Product Development, LLC, CADX Tools & Technologies Pvt. Ltd., Dassault Systemes, Fathom Digital Manufacturing Corporation, Fictiv, Laser Prototypes Europe Ltd., Materialise NV, Proto Labs, Inc., ProtoCAM, Sandvik AB, and Xometry Europe GmbH. These vendors have been profiled in the market report based on parameters such as company overview, financial overview, business strategies, product portfolio, business segments, and recent developments.
|
Attribute |
Detail |
|
Market Size Value in 2021 |
US$ 8.8 Bn |
|
Market Forecast Value in 2031 |
US$ 32.4 Bn |
|
Growth Rate (CAGR) |
14.9% |
|
Forecast Period |
2022–2031 |
|
Historical Data Available for |
2017–2020 |
|
Quantitative Units |
US$ Bn for Value |
|
Market Analysis |
It includes cross segment analysis at global as well as regional level. Furthermore, qualitative analysis includes drivers, restraints, opportunities, key trends, Porter’s Five Forces analysis, value chain analysis, and key trend analysis. |
|
Competition Landscape |
|
|
Format |
Electronic (PDF) + Excel |
|
Market Segmentation |
|
|
Regions Covered |
|
|
Countries Covered |
|
|
Companies Profiled |
|
|
Customization Scope |
Available upon request |
|
Pricing |
Available upon request |
It stood at US$ 8.8 Bn in 2021
It is expected to be 14.9% from 2022 to 2031
Increase in demand for rapid prototyping in digital manufacturing and smart production and growth in aerospace industry
The automotive segment accounted for major share of 28.0% in 2021
North America is a more attractive region for vendors
3E Rapid Prototyping Ltd., ARRK Corporation, Avid Product Development, LLC, CADX Tools & Technologies Pvt. Ltd., Dassault Systemes, Fathom Digital Manufacturing Corporation, Fictiv, Laser Prototypes Europe Ltd., Materialise NV, Proto Labs, Inc., ProtoCAM, Sandvik AB, and Xometry Europe GmbH
1. Preface
1.1. Market Introduction
1.2. Market and Segments Definition
1.3. Market Taxonomy
1.4. Research Methodology
1.5. Assumption and Acronyms
2. Executive Summary
2.1. Global Rapid Prototyping Market Overview
2.2. Regional Outline
2.3. Industry Outline
2.4. Market Dynamics Snapshot
2.5. Competition Blueprint
3. Market Dynamics
3.1. Macro-economic Factors
3.2. Drivers
3.3. Restraints
3.4. Opportunities
3.5. Key Trends
3.6. Regulatory Framework
4. Associated Industry and Key Indicator Assessment
4.1. Parent Industry Overview – Global Additive Manufacturing Industry Overview
4.2. Supply Chain Analysis
4.3. Technology Roadmap
4.4. Industry SWOT Analysis
4.5. Porter’s Five Forces Analysis
4.6. COVID-19 Impact and Recovery Analysis
5. Global Rapid Prototyping Market Analysis, By Process
5.1. Rapid Prototyping Market Value (US$ Bn) Analysis & Forecast, By Process, 2017–2031
5.1.1. Stereolithography (SLA)
5.1.2. Selective Laser Sintering (SLS)
5.1.3. Fused Deposition Modeling (FDM)
5.1.4. Multi Jet Fusion (MJF)
5.1.5. Others (Digital Light Processing [DLP], Electron Beam Melting [EBM], etc.)
5.2. Market Attractiveness Analysis, By Process
6. Global Rapid Prototyping Market Analysis, By Type
6.1. Rapid Prototyping Market Value (US$ Bn) Analysis & Forecast, By Type, 2017–2031
6.1.1. Proof-of-Concept (PoC) Prototype
6.1.2. Functional Prototype
6.1.3. Visual Prototype
6.1.4. User Experience Prototype
6.2. Market Attractiveness Analysis, By Type
7. Global Rapid Prototyping Market Analysis, By Material
7.1. Rapid Prototyping Market Value (US$ Bn) Analysis & Forecast, By Material, 2017–2031
7.1.1. Metal
7.1.2. Polymer
7.1.3. Ceramic
7.1.4. Others (Plaster & Starch, Liquid Silicone Rubber (LSR), etc.)
7.2. Market Attractiveness Analysis, By Material
8. Global Rapid Prototyping Market Analysis, By End-use Industry
8.1. Rapid Prototyping Market Value (US$ Bn) Analysis & Forecast, By End-use Industry, 2017–2031
8.1.1. Aerospace & Defense
8.1.2. Consumer Goods & Electronics
8.1.3. Automotive
8.1.4. Healthcare
8.1.5. Others (Film & Animation, Architecture, etc.)
8.2. Market Attractiveness Analysis, By End-use Industry
9. Global Rapid Prototyping Market Analysis and Forecast, By Region
9.1. Rapid Prototyping Market Value (US$ Bn) Analysis & Forecast, By Region, 2017–2031
9.1.1. North America
9.1.2. Europe
9.1.3. Asia Pacific
9.1.4. Middle East & Africa
9.1.5. South America
9.2. Market Attractiveness Analysis, By Region
10. North America Rapid Prototyping Market Analysis and Forecast
10.1. Market Snapshot
10.2. Drivers and Restraints: Impact Analysis
10.3. Rapid Prototyping Market Value (US$ Bn) Analysis & Forecast, By Process, 2017–2031
10.3.1. Stereolithography (SLA)
10.3.2. Selective Laser Sintering (SLS)
10.3.3. Fused Deposition Modeling (FDM)
10.3.4. Multi Jet Fusion (MJF)
10.3.5. Others (Digital Light Processing [DLP], Electron Beam Melting [EBM], etc.)
10.4. Rapid Prototyping Market Value (US$ Bn) Analysis & Forecast, By Type, 2017–2031
10.4.1. Proof-of-Concept (PoC) Prototype
10.4.2. Functional Prototype
10.4.3. Visual Prototype
10.4.4. User Experience Prototype
10.5. Rapid Prototyping Market Value (US$ Bn) Analysis & Forecast, By Material, 2017–2031
10.5.1. Metal
10.5.2. Polymer
10.5.3. Ceramic
10.5.4. Others (Plaster & Starch, Liquid Silicone Rubber (LSR), etc.)
10.6. Rapid Prototyping Market Value (US$ Bn) Analysis & Forecast, By End-use Industry, 2017–2031
10.6.1. Aerospace & Defense
10.6.2. Consumer Goods & Electronics
10.6.3. Automotive
10.6.4. Healthcare
10.6.5. Others (Film & Animation, Architecture, etc.)
10.7. Rapid Prototyping Market Value (US$ Bn) Analysis & Forecast, By Country and Sub-region, 2017–2031
10.7.1. U.S.
10.7.2. Canada
10.7.3. Rest of North America
10.8. Market Attractiveness Analysis
10.8.1. By Process
10.8.2. By Type
10.8.3. By Material
10.8.4. By End-use Industry
10.8.5. By Country/Sub-region
11. Europe Rapid Prototyping Market Analysis and Forecast
11.1. Market Snapshot
11.2. Drivers and Restraints: Impact Analysis
11.3. Rapid Prototyping Market Value (US$ Bn) Analysis & Forecast, By Process, 2017–2031
11.3.1. Stereolithography (SLA)
11.3.2. Selective Laser Sintering (SLS)
11.3.3. Fused Deposition Modeling (FDM)
11.3.4. Multi Jet Fusion (MJF)
11.3.5. Others (Digital Light Processing [DLP], Electron Beam Melting [EBM], etc.)
11.4. Rapid Prototyping Market Value (US$ Bn) Analysis & Forecast, By Type, 2017–2031
11.4.1. Proof-of-Concept (PoC) Prototype
11.4.2. Functional Prototype
11.4.3. Visual Prototype
11.4.4. User Experience Prototype
11.5. Rapid Prototyping Market Value (US$ Bn) Analysis & Forecast, By Material, 2017–2031
11.5.1. Metal
11.5.2. Polymer
11.5.3. Ceramic
11.5.4. Others (Plaster & Starch, Liquid Silicone Rubber (LSR), etc.)
11.6. Rapid Prototyping Market Value (US$ Bn) Analysis & Forecast, By End-use Industry, 2017–2031
11.6.1. Aerospace & Defense
11.6.2. Consumer Goods & Electronics
11.6.3. Automotive
11.6.4. Healthcare
11.6.5. Others (Film & Animation, Architecture, etc.)
11.7. Rapid Prototyping Market Value (US$ Bn) Analysis & Forecast, By Country and Sub-region, 2017–2031
11.7.1. U.K.
11.7.2. Germany
11.7.3. France
11.7.4. Rest of Europe
11.8. Market Attractiveness Analysis
11.8.1. By Process
11.8.2. By Type
11.8.3. By Material
11.8.4. By End-use Industry
11.8.5. By Country/Sub-region
12. Asia Pacific Rapid Prototyping Market Analysis and Forecast
12.1. Market Snapshot
12.2. Drivers and Restraints: Impact Analysis
12.3. Rapid Prototyping Market Value (US$ Bn) Analysis & Forecast, By Process, 2017–2031
12.3.1. Stereolithography (SLA)
12.3.2. Selective Laser Sintering (SLS)
12.3.3. Fused Deposition Modeling (FDM)
12.3.4. Multi Jet Fusion (MJF)
12.3.5. Others (Digital Light Processing [DLP], Electron Beam Melting [EBM], etc.)
12.4. Rapid Prototyping Market Value (US$ Bn) Analysis & Forecast, By Type, 2017–2031
12.4.1. Proof-of-Concept (PoC) Prototype
12.4.2. Functional Prototype
12.4.3. Visual Prototype
12.4.4. User Experience Prototype
12.5. Rapid Prototyping Market Value (US$ Bn) Analysis & Forecast, By Material, 2017–2031
12.5.1. Metal
12.5.2. Polymer
12.5.3. Ceramic
12.5.4. Others (Plaster & Starch, Liquid Silicone Rubber (LSR), etc.)
12.6. Rapid Prototyping Market Value (US$ Bn) Analysis & Forecast, By End-use Industry, 2017–2031
12.6.1. Aerospace & Defense
12.6.2. Consumer Goods & Electronics
12.6.3. Automotive
12.6.4. Healthcare
12.6.5. Others (Film & Animation, Architecture, etc.)
12.7. Rapid Prototyping Market Value (US$ Bn) Analysis & Forecast, By Country and Sub-region, 2017–2031
12.7.1. China
12.7.2. Japan
12.7.3. India
12.7.4. South Korea
12.7.5. Taiwan
12.7.6. ASEAN
12.7.7. Rest of Asia Pacific
12.8. Market Attractiveness Analysis
12.8.1. By Process
12.8.2. By Type
12.8.3. By Material
12.8.4. By End-use Industry
12.8.5. By Country/Sub-region
13. Middle East & Africa Rapid Prototyping Market Analysis and Forecast
13.1. Market Snapshot
13.2. Drivers and Restraints: Impact Analysis
13.3. Rapid Prototyping Market Value (US$ Bn) Analysis & Forecast, By Process, 2017–2031
13.3.1. Stereolithography (SLA)
13.3.2. Selective Laser Sintering (SLS)
13.3.3. Fused Deposition Modeling (FDM)
13.3.4. Multi Jet Fusion (MJF)
13.3.5. Others (Digital Light Processing [DLP], Electron Beam Melting [EBM], etc.)
13.4. Rapid Prototyping Market Value (US$ Bn) Analysis & Forecast, By Type, 2017–2031
13.4.1. Proof-of-Concept (PoC) Prototype
13.4.2. Functional Prototype
13.4.3. Visual Prototype
13.4.4. User Experience Prototype
13.5. Rapid Prototyping Market Value (US$ Bn) Analysis & Forecast, By Material, 2017–2031
13.5.1. Metal
13.5.2. Polymer
13.5.3. Ceramic
13.5.4. Others (Plaster & Starch, Liquid Silicone Rubber (LSR), etc.)
13.6. Rapid Prototyping Market Value (US$ Bn) Analysis & Forecast, By End-use Industry, 2017–2031
13.6.1. Aerospace & Defense
13.6.2. Consumer Goods & Electronics
13.6.3. Automotive
13.6.4. Healthcare
13.6.5. Others (Film & Animation, Architecture, etc.)
13.7. Rapid Prototyping Market Value (US$ Bn) Analysis & Forecast, By Country and Sub-region, 2017–2031
13.7.1. GCC
13.7.2. South Africa
13.7.3. Rest of Middle East & Africa
13.8. Market Attractiveness Analysis
13.8.1. By Process
13.8.2. By Type
13.8.3. By Material
13.8.4. By End-use Industry
13.8.5. By Country/Sub-region
14. South America Rapid Prototyping Market Analysis and Forecast
14.1. Market Snapshot
14.2. Drivers and Restraints: Impact Analysis
14.3. Rapid Prototyping Market Value (US$ Bn) Analysis & Forecast, By Process, 2017–2031
14.3.1. Stereolithography (SLA)
14.3.2. Selective Laser Sintering (SLS)
14.3.3. Fused Deposition Modeling (FDM)
14.3.4. Multi Jet Fusion (MJF)
14.3.5. Others (Digital Light Processing [DLP], Electron Beam Melting [EBM], etc.)
14.4. Rapid Prototyping Market Value (US$ Bn) Analysis & Forecast, By Type, 2017–2031
14.4.1. Proof-of-Concept (PoC) Prototype
14.4.2. Functional Prototype
14.4.3. Visual Prototype
14.4.4. User Experience Prototype
14.5. Rapid Prototyping Market Value (US$ Bn) Analysis & Forecast, By Material, 2017–2031
14.5.1. Metal
14.5.2. Polymer
14.5.3. Ceramic
14.5.4. Others (Plaster & Starch, Liquid Silicone Rubber (LSR), etc.)
14.6. Rapid Prototyping Market Value (US$ Bn) Analysis & Forecast, By End-use Industry, 2017–2031
14.6.1. Aerospace & Defense
14.6.2. Consumer Goods & Electronics
14.6.3. Automotive
14.6.4. Healthcare
14.6.5. Others (Film & Animation, Architecture, etc.)
14.7. Rapid Prototyping Market Value (US$ Bn) Analysis & Forecast, By Country and Sub-region, 2017–2031
14.7.1. Brazil
14.7.2. Rest of South America
14.8. Market Attractiveness Analysis
14.8.1. By Process
14.8.2. By Type
14.8.3. By Material
14.8.4. By End-use Industry
14.8.5. By Country/Sub-region
15. Competition Assessment
15.1. Global Rapid Prototyping Market Competition Matrix - a Dashboard View
15.1.1. Global Rapid Prototyping Market Company Share Analysis, By Value (2021)
15.1.2. Technological Differentiator
16. Company Profiles (Global Manufacturers/Suppliers)
16.1. 3E Rapid Prototyping Ltd.
16.1.1. Overview
16.1.2. Product Portfolio
16.1.3. Sales Footprint
16.1.4. Key Subsidiaries or Distributors
16.1.5. Strategy and Recent Developments
16.1.6. Key Financials
16.2. ARRK Corporation
16.2.1. Overview
16.2.2. Product Portfolio
16.2.3. Sales Footprint
16.2.4. Key Subsidiaries or Distributors
16.2.5. Strategy and Recent Developments
16.2.6. Key Financials
16.3. Avid Product Development, LLC
16.3.1. Overview
16.3.2. Product Portfolio
16.3.3. Sales Footprint
16.3.4. Key Subsidiaries or Distributors
16.3.5. Strategy and Recent Developments
16.3.6. Key Financials
16.4. CADX Tools & Technologies Pvt. Ltd.
16.4.1. Overview
16.4.2. Product Portfolio
16.4.3. Sales Footprint
16.4.4. Key Subsidiaries or Distributors
16.4.5. Strategy and Recent Developments
16.4.6. Key Financials
16.5. Dassault Systemes
16.5.1. Overview
16.5.2. Product Portfolio
16.5.3. Sales Footprint
16.5.4. Key Subsidiaries or Distributors
16.5.5. Strategy and Recent Developments
16.5.6. Key Financials
16.6. Fathom Digital Manufacturing Corporation
16.6.1. Overview
16.6.2. Product Portfolio
16.6.3. Sales Footprint
16.6.4. Key Subsidiaries or Distributors
16.6.5. Strategy and Recent Developments
16.6.6. Key Financials
16.7. Fictiv
16.7.1. Overview
16.7.2. Product Portfolio
16.7.3. Sales Footprint
16.7.4. Key Subsidiaries or Distributors
16.7.5. Strategy and Recent Developments
16.7.6. Key Financials
16.8. Laser Prototypes Europe Ltd.
16.8.1. Overview
16.8.2. Product Portfolio
16.8.3. Sales Footprint
16.8.4. Key Subsidiaries or Distributors
16.8.5. Strategy and Recent Developments
16.8.6. Key Financials
16.9. Materialise NV
16.9.1. Overview
16.9.2. Product Portfolio
16.9.3. Sales Footprint
16.9.4. Key Subsidiaries or Distributors
16.9.5. Strategy and Recent Developments
16.9.6. Key Financials
16.10. Proto Labs, Inc.
16.10.1. Overview
16.10.2. Product Portfolio
16.10.3. Sales Footprint
16.10.4. Key Subsidiaries or Distributors
16.10.5. Strategy and Recent Developments
16.10.6. Key Financials
16.11. ProtoCAM
16.11.1. Overview
16.11.2. Product Portfolio
16.11.3. Sales Footprint
16.11.4. Key Subsidiaries or Distributors
16.11.5. Strategy and Recent Developments
16.11.6. Key Financials
16.12. Sandvik AB
16.12.1. Overview
16.12.2. Product Portfolio
16.12.3. Sales Footprint
16.12.4. Key Subsidiaries or Distributors
16.12.5. Strategy and Recent Developments
16.12.6. Key Financials
16.13. Xometry Europe GmbH
16.13.1. Overview
16.13.2. Product Portfolio
16.13.3. Sales Footprint
16.13.4. Key Subsidiaries or Distributors
16.13.5. Strategy and Recent Developments
16.13.6. Key Financials
17. Recommendation
17.1. Opportunity Assessment
17.1.1. By Process
17.1.2. By Type
17.1.3. By Material
17.1.4. By End-use Industry
17.1.5. By Region
List of Tables
Table 01: Global Rapid Prototyping Market Size & Forecast, By Process, Value (US$ Bn), 2017-2031
Table 02: Global Rapid Prototyping Market Size & Forecast, By Type, Value (US$ Bn), 2017-2031
Table 03: Global Rapid Prototyping Market Size & Forecast, By Material, Value (US$ Bn), 2017-2031
Table 04: Global Rapid Prototyping Market Size & Forecast, By End-use Industry, Value (US$ Bn), 2017-2031
Table 05: Global Rapid Prototyping Market Size & Forecast, By Region, Value (US$ Bn), 2017-2031
Table 06: North America Rapid Prototyping Market Size & Forecast, By Process, Value (US$ Bn), 2017-2031
Table 07: North America Rapid Prototyping Market Size & Forecast, By Type, Value (US$ Bn), 2017-2031
Table 08: North America Rapid Prototyping Market Size & Forecast, By Material, Value (US$ Bn), 2017-2031
Table 09: North America Rapid Prototyping Market Size & Forecast, By End-use Industry, Value (US$ Bn), 2017-2031
Table 10: North America Rapid Prototyping Market Size & Forecast, By Country, Value (US$ Bn), 2017-2031
Table 11: Europe Rapid Prototyping Market Size & Forecast, By Process, Value (US$ Bn), 2017-2031
Table 12: Europe Rapid Prototyping Market Size & Forecast, By Type, Value (US$ Bn), 2017-2031
Table 13: Europe Rapid Prototyping Market Size & Forecast, By Material, Value (US$ Bn), 2017-2031
Table 14: Europe Rapid Prototyping Market Size & Forecast, By End-use Industry, Value (US$ Bn), 2017-2031
Table 15: Europe Rapid Prototyping Market Size & Forecast, By Country, Value (US$ Bn), 2017-2031
Table 16: Asia Pacific Rapid Prototyping Market Size & Forecast, By Process, Value (US$ Bn), 2017-2031
Table 17: Asia Pacific Rapid Prototyping Market Size & Forecast, By Type, Value (US$ Bn), 2017-2031
Table 18: Asia Pacific Rapid Prototyping Market Size & Forecast, By Material, Value (US$ Bn), 2017-2031
Table 19: Asia Pacific Rapid Prototyping Market Size & Forecast, By End-use Industry, Value (US$ Bn), 2017-2031
Table 20: Asia Pacific Rapid Prototyping Market Size & Forecast, By Country, Value (US$ Bn), 2017-2031
Table 21: Middle East & Africa Rapid Prototyping Market Size & Forecast, By Process, Value (US$ Bn), 2017-2031
Table 22: Middle East & Africa Rapid Prototyping Market Size & Forecast, By Type, Value (US$ Bn), 2017-2031
Table 23: Middle East & Africa Rapid Prototyping Market Size & Forecast, By Material, Value (US$ Bn), 2017-2031
Table 24: Middle East & Africa Rapid Prototyping Market Size & Forecast, By End-use Industry, Value (US$ Bn), 2017-2031
Table 25: Middle East & Africa Rapid Prototyping Market Size & Forecast, By Country, Value (US$ Bn), 2017-2031
Table 26: South America Rapid Prototyping Market Size & Forecast, By Process, Value (US$ Bn), 2017-2031
Table 27: South America Rapid Prototyping Market Size & Forecast, By Type, Value (US$ Bn), 2017-2031
Table 28: South America Rapid Prototyping Market Size & Forecast, By Material, Value (US$ Bn), 2017-2031
Table 29: South America Rapid Prototyping Market Size & Forecast, By End-use Industry, Value (US$ Bn), 2017-2031
Table 30: South America Rapid Prototyping Market Size & Forecast, By Country, Value (US$ Bn), 2017-2031
List of Figures
Figure 01: Global Rapid Prototyping Market, Value (US$ Bn), 2017-2031
Figure 02: Global Rapid Prototyping Market Size & Forecast, By Process, Value (US$ Bn), 2017-2031
Figure 03: Global Rapid Prototyping Market Attractiveness, By Process, Value (US$ Bn), 2022-2031
Figure 04: Global Rapid Prototyping Market Share Analysis, By Process, 2022
Figure 05: Global Rapid Prototyping Market Share Analysis, By Process, 2031
Figure 06: Global Rapid Prototyping Market Size & Forecast, By Type, Value (US$ Bn), 2017-2031
Figure 07: Global Rapid Prototyping Market Attractiveness, By Type, Value (US$ Bn), 2022-2031
Figure 08: Global Rapid Prototyping Market Share Analysis, By Type, 2022
Figure 09: Global Rapid Prototyping Market Share Analysis, By Type, 2031
Figure 10: Global Rapid Prototyping Market Size & Forecast, By Material, Value (US$ Bn), 2017-2031
Figure 11: Global Rapid Prototyping Market Attractiveness, By Material, Value (US$ Bn), 2022-2031
Figure 12: Global Rapid Prototyping Market Share Analysis, By Material, 2022
Figure 13: Global Rapid Prototyping Market Share Analysis, By Material, 2031
Figure 14: Global Rapid Prototyping Market Size & Forecast, By End-use Industry, Value (US$ Bn), 2017-2031
Figure 15: Global Rapid Prototyping Market Attractiveness, By End-use Industry, Value (US$ Bn), 2022-2031
Figure 16: Global Rapid Prototyping Market Share Analysis, By End-use Industry, 2022
Figure 17: Global Rapid Prototyping Market Share Analysis, By End-use Industry, 2031
Figure 18: Global Rapid Prototyping Market Size & Forecast, By Region, Value (US$ Bn), 2017-2031
Figure 19: Global Rapid Prototyping Market Attractiveness, By Region, Value (US$ Bn), 2022-2031
Figure 20: Global Rapid Prototyping Market Share Analysis, By Region, 2022
Figure 21: Global Rapid Prototyping Market Share Analysis, By Region, 2031
Figure 22: North America Rapid Prototyping Market, Value (US$ Bn), 2017-2031
Figure 23: North America Rapid Prototyping Market Size & Forecast, By Process, Value (US$ Bn), 2017-2031
Figure 24: North America Rapid Prototyping Market Attractiveness, By Process, Value (US$ Bn), 2022-2031
Figure 25: North America Rapid Prototyping Market Share Analysis, By Process, 2022
Figure 26: North America Rapid Prototyping Market Share Analysis, By Process, 2031
Figure 27: North America Rapid Prototyping Market Size & Forecast, By Type, Value (US$ Bn), 2017-2031
Figure 28: North America Rapid Prototyping Market Attractiveness, By Type, Value (US$ Bn), 2022-2031
Figure 29: North America Rapid Prototyping Market Share Analysis, By Type, 2022
Figure 30: North America Rapid Prototyping Market Share Analysis, By Type, 2031
Figure 31: North America Rapid Prototyping Market Size & Forecast, By Material, Value (US$ Bn), 2017-2031
Figure 32: North America Rapid Prototyping Market Attractiveness, By Material, Value (US$ Bn), 2022-2031
Figure 33: North America Rapid Prototyping Market Share Analysis, By Material, 2022
Figure 34: North America Rapid Prototyping Market Share Analysis, By Material, 2031
Figure 35: North America Rapid Prototyping Market Size & Forecast, By End-use Industry, Value (US$ Bn), 2017-2031
Figure 36: North America Rapid Prototyping Market Attractiveness, By End-use Industry, Value (US$ Bn), 2022-2031
Figure 37: North America Rapid Prototyping Market Share Analysis, By End-use Industry, 2022
Figure 38: North America Rapid Prototyping Market Share Analysis, By End-use Industry, 2031
Figure 39: North America Rapid Prototyping Market Size & Forecast, By Country, Value (US$ Bn), 2017-2031
Figure 40: North America Rapid Prototyping Market Attractiveness, By Country, Value (US$ Bn), 2022-2031
Figure 41: North America Rapid Prototyping Market Share Analysis, By Country, 2022
Figure 42: North America Rapid Prototyping Market Share Analysis, By Country, 2031
Figure 43: Europe Rapid Prototyping Market, Value (US$ Bn), 2017-2031
Figure 44: Europe Rapid Prototyping Market Size & Forecast, By Process, Value (US$ Bn), 2017-2031
Figure 45: Europe Rapid Prototyping Market Attractiveness, By Process, Value (US$ Bn), 2022-2031
Figure 46: Europe Rapid Prototyping Market Share Analysis, By Process, 2022
Figure 47: Europe Rapid Prototyping Market Share Analysis, By Process, 2031
Figure 48: Europe Rapid Prototyping Market Size & Forecast, By Type, Value (US$ Bn), 2017-2031
Figure 49: Europe Rapid Prototyping Market Attractiveness, By Type, Value (US$ Bn), 2022-2031
Figure 50: Europe Rapid Prototyping Market Share Analysis, By Type, 2022
Figure 51: Europe Rapid Prototyping Market Share Analysis, By Type, 2031
Figure 52: Europe Rapid Prototyping Market Size & Forecast, By Material, Value (US$ Bn), 2017-2031
Figure 53: Europe Rapid Prototyping Market Attractiveness, By Material, Value (US$ Bn), 2022-2031
Figure 54: Europe Rapid Prototyping Market Share Analysis, By Material, 2022
Figure 55: Europe Rapid Prototyping Market Share Analysis, By Material, 2031
Figure 56: Europe Rapid Prototyping Market Size & Forecast, By End-use Industry, Value (US$ Bn), 2017-2031
Figure 57: Europe Rapid Prototyping Market Attractiveness, By End-use Industry, Value (US$ Bn), 2022-2031
Figure 58: Europe Rapid Prototyping Market Share Analysis, By End-use Industry, 2022
Figure 59: Europe Rapid Prototyping Market Share Analysis, By End-use Industry, 2031
Figure 60: Europe Rapid Prototyping Market Size & Forecast, By Country, Value (US$ Bn), 2017-2031
Figure 61: Europe Rapid Prototyping Market Attractiveness, By Country, Value (US$ Bn), 2022-2031
Figure 62: Europe Rapid Prototyping Market Share Analysis, By Country, 2022
Figure 63: Europe Rapid Prototyping Market Share Analysis, By Country, 2031
Figure 64: Asia Pacific Rapid Prototyping Market, Value (US$ Bn), 2017-2031
Figure 65: Asia Pacific Rapid Prototyping Market Size & Forecast, By Process, Value (US$ Bn), 2017-2031
Figure 66: Asia Pacific Rapid Prototyping Market Attractiveness, By Process, Value (US$ Bn), 2022-2031
Figure 67: Asia Pacific Rapid Prototyping Market Share Analysis, By Process, 2022
Figure 68: Asia Pacific Rapid Prototyping Market Share Analysis, By Process, 2031
Figure 69: Asia Pacific Rapid Prototyping Market Size & Forecast, By Type, Value (US$ Bn), 2017-2031
Figure 70: Asia Pacific Rapid Prototyping Market Attractiveness, By Type, Value (US$ Bn), 2022-2031
Figure 71: Asia Pacific Rapid Prototyping Market Share Analysis, By Type, 2022
Figure 72: Asia Pacific Rapid Prototyping Market Share Analysis, By Type, 2031
Figure 73: Asia Pacific Rapid Prototyping Market Size & Forecast, By Material, Value (US$ Bn), 2017-2031
Figure 74: Asia Pacific Rapid Prototyping Market Attractiveness, By Material, Value (US$ Bn), 2022-2031
Figure 75: Asia Pacific Rapid Prototyping Market Share Analysis, By Material, 2022
Figure 76: Asia Pacific Rapid Prototyping Market Share Analysis, By Material, 2031
Figure 77: Asia Pacific Rapid Prototyping Market Size & Forecast, By End-use Industry, Value (US$ Bn), 2017-2031
Figure 78: Asia Pacific Rapid Prototyping Market Attractiveness, By End-use Industry, Value (US$ Bn), 2022-2031
Figure 79: Asia Pacific Rapid Prototyping Market Share Analysis, By End-use Industry, 2022
Figure 80: Asia Pacific Rapid Prototyping Market Share Analysis, By End-use Industry, 2031
Figure 81: Asia Pacific Rapid Prototyping Market Size & Forecast, By Country, Value (US$ Bn), 2017-2031
Figure 82: Asia Pacific Rapid Prototyping Market Attractiveness, By Country, Value (US$ Bn), 2022-2031
Figure 83: Asia Pacific Rapid Prototyping Market Share Analysis, By Country, 2022
Figure 84: Asia Pacific Rapid Prototyping Market Share Analysis, By Country, 2031
Figure 85: Middle East & Africa Rapid Prototyping Market, Value (US$ Bn), 2017-2031
Figure 86: Middle East & Africa Rapid Prototyping Market Size & Forecast, By Process, Value (US$ Bn), 2017-2031
Figure 87: Middle East & Africa Rapid Prototyping Market Attractiveness, By Process, Value (US$ Bn), 2022-2031
Figure 88: Middle East & Africa Rapid Prototyping Market Share Analysis, By Process, 2022
Figure 89: Middle East & Africa Rapid Prototyping Market Share Analysis, By Process, 2031
Figure 90: Middle East & Africa Rapid Prototyping Market Size & Forecast, By Type, Value (US$ Bn), 2017-2031
Figure 91: Middle East & Africa Rapid Prototyping Market Attractiveness, By Type, Value (US$ Bn), 2022-2031
Figure 92: Middle East & Africa Rapid Prototyping Market Share Analysis, By Type, 2022
Figure 93: Middle East & Africa Rapid Prototyping Market Share Analysis, By Type, 2031
Figure 94: Middle East & Africa Rapid Prototyping Market Size & Forecast, By Material, Value (US$ Bn), 2017-2031
Figure 95: Middle East & Africa Rapid Prototyping Market Attractiveness, By Material, Value (US$ Bn), 2022-2031
Figure 96: Middle East & Africa Rapid Prototyping Market Share Analysis, By Material, 2022
Figure 97: Middle East & Africa Rapid Prototyping Market Share Analysis, By Material, 2031
Figure 98: Middle East & Africa Rapid Prototyping Market Size & Forecast, By End-use Industry, Value (US$ Bn), 2017-2031
Figure 99: Middle East & Africa Rapid Prototyping Market Attractiveness, By End-use Industry, Value (US$ Bn), 2022-2031
Figure 100: Middle East & Africa Rapid Prototyping Market Share Analysis, By End-use Industry, 2022
Figure 101: Middle East & Africa Rapid Prototyping Market Share Analysis, By End-use Industry, 2031
Figure 102: Middle East & Africa Rapid Prototyping Market Size & Forecast, By Country, Value (US$ Bn), 2017-2031
Figure 103: Middle East & Africa Rapid Prototyping Market Attractiveness, By Country, Value (US$ Bn), 2022-2031
Figure 104: Middle East & Africa Rapid Prototyping Market Share Analysis, By Country, 2022
Figure 105: Middle East & Africa Rapid Prototyping Market Share Analysis, By Country, 2031
Figure 106: South America Rapid Prototyping Market, Value (US$ Bn), 2017-2031
Figure 107: South America Rapid Prototyping Market Size & Forecast, By Process, Value (US$ Bn), 2017-2031
Figure 108: South America Rapid Prototyping Market Attractiveness, By Process, Value (US$ Bn), 2022-2031
Figure 109: South America Rapid Prototyping Market Share Analysis, By Process, 2022
Figure 110: South America Rapid Prototyping Market Share Analysis, By Process, 2031
Figure 111: South America Rapid Prototyping Market Size & Forecast, By Type, Value (US$ Bn), 2017-2031
Figure 112: South America Rapid Prototyping Market Attractiveness, By Type, Value (US$ Bn), 2022-2031
Figure 113: South America Rapid Prototyping Market Share Analysis, By Type, 2022
Figure 114: South America Rapid Prototyping Market Share Analysis, By Type, 2031
Figure 115: South America Rapid Prototyping Market Size & Forecast, By Material, Value (US$ Bn), 2017-2031
Figure 116: South America Rapid Prototyping Market Attractiveness, By Material, Value (US$ Bn), 2022-2031
Figure 117: South America Rapid Prototyping Market Share Analysis, By Material, 2022
Figure 118: South America Rapid Prototyping Market Share Analysis, By Material, 2031
Figure 119: South America Rapid Prototyping Market Size & Forecast, By End-use Industry, Value (US$ Bn), 2017-2031
Figure 120: South America Rapid Prototyping Market Attractiveness, By End-use Industry, Value (US$ Bn), 2022-2031
Figure 121: South America Rapid Prototyping Market Share Analysis, By End-use Industry, 2022
Figure 122: South America Rapid Prototyping Market Share Analysis, By End-use Industry, 2031
Figure 123: South America Rapid Prototyping Market Size & Forecast, By Country, Value (US$ Bn), 2017-2031
Figure 124: South America Rapid Prototyping Market Attractiveness, By Country, Value (US$ Bn), 2022-2031
Figure 125: South America Rapid Prototyping Market Share Analysis, By Country, 2022
Figure 126: South America Rapid Prototyping Market Share Analysis, By Country, 2031
Copyright © Transparency Market Research, Inc. All Rights reserved
Trust Online

Rapid Prototyping Market