
Reports
Reports
Analysts’ Viewpoint on Process Spectroscopy Market Scenario
The global process spectroscopy market is flourishing due to a growing focus on maintaining international quality standards by various industries and a rising usage of process technologies in the food & beverage and agricultural sectors. Introduction of cloud-based spectroscopy offers significant opportunity for adoption by different end-use industries. Computational resources can be dynamically scaled up and down to match changing workloads in next-generation cloud-based spectroscopy. Moreover, the application of Process Analytical Technology (PAT) to ensure optimum performance of the finished product offers additional benefits. Increase in adoption of Raman imaging spectroscopy for non-destructive and non-invasive 3D investigation imaging of chemical and molecular compounds to quickly identify and analyze tiny contaminants in sample also offers lucrative opportunities for manufacturers of Raman spectroscopy. High precision and ability to determine finest molecular details, such as presence of functional groups and molecular weight, make this technology more attractive for companies engaged in drug development and chemical analysis. Based on end-use industry, adoption of process spectroscopy in pharmaceuticals, chemical, and food & agriculture industries is boosting preference for advanced spectroscopy instruments. North America is likely to hold largest share of the global process spectroscopy market during the forecast period owing to stringent government quality control legislation and improved requirements for process monitoring.
Process spectroscopy instruments are designed to determine the physical and electronic structure of matter/sample at atomic or molecular/macro levels. The key principle of spectroscopy involves the analysis of interactions between matter and electromagnetic radiation with the aid of wavelength or frequency of the radiation. Mass spectrometers can detect, identify, and quantify molecules within samples based on molecular mass-to-charge ratio after ionization. However, molecular spectroscopy is the interactions that occur between molecules and electromagnetic radiation. These radiations are electric and magnetic fields that vary simultaneously.
The global process spectroscopy market is likely to rise at a significant growth rate during the forecast period 2022-2031 due to increasing adoption of various types of spectroscopy for diverse applications such as nanotechnology, microplastics testing, polymer/chemical analysis, electronics & semiconductor testing, material science research, academic research, pharmaceutical sample testing, and geology research.
Fluorescence spectroscopy is extensively utilized to detect intracellular ion concentrations, analyze the rotational motion of molecules, and finely control sample temperatures for protein and peptide analysis.
Rise in adoption of various spectroscopy technologies for a wide range of life science applications fuels the market. These life science applications include characterization of bio-labels for live cell imaging, characterizing GPCR oligomerization, detection of specific bacterial strains, analysis of platelet response using cellular signaling, analysis of changes in tertiary structure of proteins, and testing thermal stability of biocatalysts and pharmaceuticals.
Key players of process spectroscopy market are continuously developing advanced spectrometers to gain a competitive edge in the market. For instance, in July 2018, PerkinElmer, Inc. launched FL 6500 Pulse Xenon and FL 8500 Continuous Wave Fluorescence Spectrometers, for industrial companies, universities, government, and pharmaceutical laboratories to analyze diverse sample types for research and evolving compliance requirements. The FL 6500 fluorescence spectrometer is widely used for cell biology, molecular biology, immunology, enzymology, and protein analysis.
In November 2021, Thermo Fisher Scientific Inc. launched new-generation mass spectrometry instruments, workflows and software at American Society for Mass Spectrometry (ASMS) Conference on Mass Spectrometry and Allied Topics, Pennsylvania U.S. The launched instrument included Orbitrap Exploris MX mass detector that enables biopharmaceutical laboratories implement multi-attribute method (MAM) and perform intact analysis of monoclonal antibodies, oligonucleotide mass determination, and peptide mapping.
Increase in adoption of Raman spectroscopy for airport security screening, pharmaceutical quality control, and hazardous chemical identification in field is propelling the market. These spectrometers are widely deployed at airports, which provides exceptional detection capabilities with an ultra-low false alarm rate for non-metallic containers. Moreover, Raman analyzer enable the rapid identification of explosives, narcotics, toxic industrial chemicals, chemical warfare agents, and other materials through sealed, opaque containers. These are heavily used in hazardous chemical identification and incident response. Thus, the Raman spectroscopy market is growing owing to the deployment of these spectroscopes in hazmat response, EOD, CBRN, law enforcement, and parcel screening at customs, ports, and borders.
Major market players are investing heavily in R&D for Raman spectrometers and launching innovative products in the market to remain competitive. For instance, in June 2022, Timegate Instruments Ltd. launched its third-generation instrument PicoRaman M3, integrated with patented Timegated Raman technology with real fluorescence rejection. This instrument offers benefits such as quick & continuous, real-time, and online measurements of highly specific chemicals and widely used for non-destructive analysis. The PicoRaman M3 spectrometer also deployed in application of science and process industries, such as the biopharmaceutical sector, to monitor bioprocess and calculate nutrients.
In terms of technology, the global process spectroscopy market has been classified into molecular spectroscopy, mass spectroscopy, and atomic spectroscopy. The molecular spectroscopy segment has been further divided into Near Infrared (NIR) spectroscopy, Raman spectroscopy, Fourier Transform Infrared (FT-IR) spectroscopy, fluorescence spectroscopy, and others.
Near Infrared (NIR) spectroscopy sub-segment held the largest market share in 2021, and it is likely to advance at a significant CAGR during the forecast period. Near-infrared spectroscopy offers highly flexible form of analysis, and it is used in a broad range of research and industrial process applications. It is a cost-effective tool for measuring materials in order to optimize processes and manage costs in various industries.
Near-infrared spectroscopy is widely used in quality control and quality assurance processes to accurately determine chemical and physical properties of samples. Thus, NIR spectrometers are heavily deployed for chemical production, cosmetics, pulp and paper, pharmaceuticals, petrochemicals, and polymer production applications.
In terms of applications, the global process spectroscopy has been classified into biopharma research, life science research, polymer analysis, forensic drug analysis, academic research, petrochemical analysis, and others. In terms of application, biopharma research is one of the key market segments in process spectroscopy, and it accounted for significant share of the market in 2021. The segment is projected to rise at the highest CAGR during the forecast period.
Rise in demand for FT-IR and NIR spectroscopy for remote and real-time monitoring of continuous and batch processes in the pharmaceutical industry fuels the market. Various spectrometers used for content uniformity testing, drug product identification, polymorph, and crystallinity applications. Furthermore, demand analysis of process spectroscopy reveals that utilization of process spectroscopy for analytical measurements in pharmaceutical applications ranges from verification of raw materials to process monitoring of drug production and quality control of products, which in turn further propels the market. Process spectroscopy in the pharmaceutical industry helps in efficient process monitoring and enhancing quality control in the entire process chain.
The process spectroscopy market in North America held the highest share and accounted for 48.3% of the global market in 2021 owing to the presence of key market players, technological advancements, and countries, such as the U.S. and Canada offering ample and lucrative opportunities for manufacturers on a long-term basis in the region.
Increased use of spectroscopy to meet the standards of drug safety regulations and early adoption and extensive R &D in field of spectroscopy have propelled the demand for process spectroscopy in the region. The chemical industry is one of the largest private-sector industry in research and development of the U.S. According to the American Chemistry Council, Inc., around US$ 517 billion is generated annually by the business of chemistry, and it contributes around 25% to the U.S GDP. Thus, growth in the chemical sector offers significant opportunities for manufacturers of the process spectroscopy instruments in the country.
The market in Europe and Asia Pacific is also growing significantly due to rapidly expansion of the chemical industry in these regions, demand for safe handling of chemicals, and stringent government regulations, which make spectroscopic analysis essential in these regions. Moreover, ongoing research and development in the pharmaceutical sector and demand for precise analytical measurements also propel the process spectroscopy market in Europe and Asia Pacific.
Middle East & Africa is a larger market of process spectroscopy as compared to South America; however, the market in Middle East & Africa is estimated to expand at a rapid pace as compared to the market in South America.
The global process spectroscopy market is consolidated with number of large-scale vendors controlling the majority of the market share. A majority of the firms are spending significantly on comprehensive research and development, and new product development. Expansion of product portfolios and mergers and acquisitions are major strategies adopted by key players. Bruker Optics GmbH & Co. KG, Agilent Technologies, Inc., Magritek, Danaher Corporation, Foss A/S, Sartorius AG, HORIBA, Ltd., Kett Electric Laboratory Co.Ltd., ABB Ltd., BÜCHI Labortechnik AG, Thermo Fisher Scientific Inc., PerkinElmer, Inc., and Timegate Instruments Ltd. are the key players operating in the global process spectroscopy market.
Each of these players has been profiled in the process spectroscopy market report based on parameters such as company overview, financial overview, business strategies, product portfolio, business segments, and recent developments
|
Attribute |
Detail |
|
Market Size Value in 2021 |
US$ 18.15 Bn |
|
Market Forecast Value in 2031 |
US$ 39.06 Bn |
|
Growth Rate (CAGR) |
8.2% |
|
Forecast Period |
2022–2031 |
|
Historical Data Available for |
2017–2020 |
|
Quantitative Units |
US$ Bn for Value |
|
Market Analysis |
It includes cross segment analysis at global as well as regional level. Furthermore, qualitative analysis includes drivers, restraints, opportunities, key trends, Porter’s Five Forces analysis, value chain analysis, and key trend analysis. |
|
Competition Landscape |
|
|
Format |
Electronic (PDF) + Excel |
|
Market Segmentation |
|
|
Regions Covered |
|
|
Countries Covered |
|
|
Companies Profiled |
|
|
Customization Scope |
Available upon request |
|
Pricing |
Available upon request |
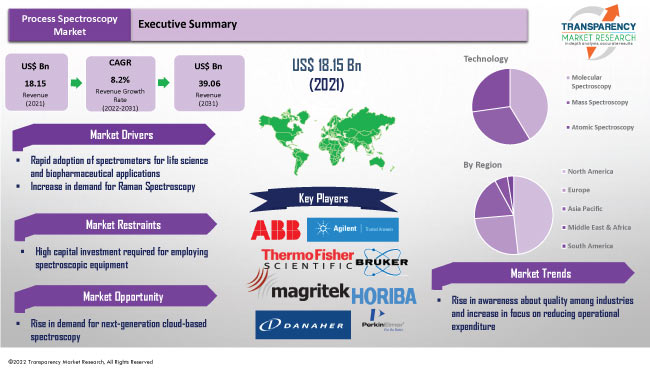
The process spectroscopy market stood at US$ 18.15 Bn in 2021.
The process spectroscopy market is expected to rise at a CAGR of 8.2% by 2031.
The process spectroscopy market would reach US$ 39.06 Bn in 2031.
Bruker Optics GmbH & Co. KG, Agilent Technologies, Inc., Magritek, Danaher Corporation, Foss A/S, Sartorius AG, HORIBA, Ltd., Kett Electric Laboratory Co.Ltd., ABB Ltd., BÜCHI Labortechnik AG, Thermo Fisher Scientific Inc., PerkinElmer, Inc., and Timegate Instruments Ltd.
The U.S. accounted for 38.2% share of the global process spectroscopy market in 2021.
Based on technology, the molecular spectroscopy segment held 41.2% share of the process spectroscopy market in 2021.
Emergence of effective medical remedies leading to various drug discoveries by utilizing Raman spectroscopy, rising awareness about quality among industries, and increasing focus on reducing operational expenditure.
North America is more lucrative region of the global process spectroscopy market.
1. Preface
1.1. Market Introduction
1.2. Market and Segments Definition
1.3. Market Taxonomy
1.4. Research Methodology
1.5. Assumption and Acronyms
2. Executive Summary
2.1. Global Process Spectroscopy Market Overview
2.2. Regional Outline
2.3. Industry Outline
2.4. Market Dynamics Snapshot
2.5. Competition Blueprint
3. Market Dynamics
3.1. Macro-economic Factors
3.2. Drivers
3.3. Restraints
3.4. Opportunities
3.5. Key Trends
3.6. Regulatory Scenario
4. Associated Industry and Key Indicator Assessment
4.1. Parent Industry Overview – Global Analytical Measurement Industry Overview
4.2. Supply Chain Analysis
4.3. Technology Roadmap Analysis
4.4. Industry SWOT Analysis
4.5. Porter Five Forces Analysis
4.6. Covid-19 Impact and Recovery Analysis
5. Process Spectroscopy Market Analysis, by Technology
5.1. Process Spectroscopy Market Size (US$ Bn) Analysis & Forecast, by Technology, 2017–2031
5.1.1. Molecular Spectroscopy
5.1.1.1. Near Infrared (NIR) Spectroscopy
5.1.1.2. Raman Spectroscopy
5.1.1.3. Fourier Transform Infrared (FT-IR) Spectroscopy
5.1.1.4. Fluorescence Spectroscopy
5.1.1.5. Others
5.1.2. Mass Spectroscopy
5.1.3. Atomic Spectroscopy
5.2. Market Attractiveness Analysis, by Technology
6. Process Spectroscopy Market Analysis, by Application
6.1. Process Spectroscopy Market Size (US$ Bn) Analysis & Forecast, by Application, 2017–2031
6.1.1. Biopharma Research
6.1.2. Life Science Research
6.1.3. Polymer Analysis
6.1.4. Forensic Drug Analysis
6.1.5. Academic Research
6.1.6. Petrochemical Analysis
6.1.7. Others
6.2. Market Attractiveness Analysis, by Application
7. Process Spectroscopy Market Analysis, by End-use Industry
7.1. Process Spectroscopy Market Size (US$ Bn) Analysis & Forecast, by End-use Industry, 2017–2031
7.1.1. Chemical
7.1.2. Healthcare & Life Science
7.1.3. Pharmaceutical
7.1.4. Research & Academia
7.1.5. Food & Beverage
7.1.6. Oil & Gas
7.1.7. Others
7.2. Market Attractiveness Analysis, by End-use Industry
8. Process Spectroscopy Market Analysis and Forecast, by Region
8.1. Process Spectroscopy Market Size (US$ Bn) Analysis & Forecast, by Region, 2017–2031
8.1.1. North America
8.1.2. Europe
8.1.3. Asia Pacific
8.1.4. Middle East & Africa
8.1.5. South America
8.2. Market Attractiveness Analysis, by Region
9. North America Process Spectroscopy Market Analysis and Forecast
9.1. Market Snapshot
9.2. Drivers and Restraints: Impact Analysis
9.3. Process Spectroscopy Market Size (US$ Bn) Analysis & Forecast, by Technology, 2017–2031
9.3.1. Molecular Spectroscopy
9.3.1.1. Near Infrared (NIR) Spectroscopy
9.3.1.2. Raman Spectroscopy
9.3.1.3. Fourier Transform Infrared (FT-IR) Spectroscopy
9.3.1.4. Fluorescence Spectroscopy
9.3.1.5. Others
9.3.2. Mass Spectroscopy
9.3.3. Atomic Spectroscopy
9.4. Process Spectroscopy Market Size (US$ Bn) Analysis & Forecast, by Application, 2017–2031
9.4.1. Biopharma Research
9.4.2. Life Science Research
9.4.3. Polymer Analysis
9.4.4. Forensic Drug Analysis
9.4.5. Academic Research
9.4.6. Petrochemical Analysis
9.4.7. Others
9.5. Process Spectroscopy Market Size (US$ Bn) Analysis & Forecast, by End-use Industry, 2017–2031
9.5.1. Chemical
9.5.2. Healthcare & Life Science
9.5.3. Pharmaceutical
9.5.4. Research & Academia
9.5.5. Food & Beverage
9.5.6. Oil & Gas
9.5.7. Others
9.6. Process Spectroscopy Market Size (US$ Bn) Analysis & Forecast, by Country and Sub-region, 2017–2031
9.6.1. U.S.
9.6.2. Canada
9.6.3. Rest of America
9.7. Market Attractiveness Analysis
9.7.1. By Technology
9.7.2. By Application
9.7.3. By End-use Industry
9.7.4. By Country and Sub-region
10. Europe Process Spectroscopy Market Analysis and Forecast
10.1. Market Snapshot
10.2. Drivers and Restraints: Impact Analysis
10.3. Process Spectroscopy Market Size (US$ Bn) Analysis & Forecast, by Technology, 2017–2031
10.3.1. Molecular Spectroscopy
10.3.1.1. Near Infrared (NIR) Spectroscopy
10.3.1.2. Raman Spectroscopy
10.3.1.3. Fourier Transform Infrared (FT-IR) Spectroscopy
10.3.1.4. Fluorescence Spectroscopy
10.3.1.5. Others
10.3.2. Mass Spectroscopy
10.3.3. Atomic Spectroscopy
10.4. Process Spectroscopy Market Size (US$ Bn) Analysis & Forecast, by Application, 2017–2031
10.4.1. Biopharma Research
10.4.2. Life Science Research
10.4.3. Polymer Analysis
10.4.4. Forensic Drug Analysis
10.4.5. Academic Research
10.4.6. Petrochemical Analysis
10.4.7. Others
10.5. Process Spectroscopy Market Size (US$ Bn) Analysis & Forecast, by End-use Industry, 2017–2031
10.5.1. Chemical
10.5.2. Healthcare & Life Science
10.5.3. Pharmaceutical
10.5.4. Research & Academia
10.5.5. Food & Beverage
10.5.6. Oil & Gas
10.5.7. Others
10.6. Process Spectroscopy Market Size (US$ Bn) Analysis & Forecast, by Country and Sub-region, 2017–2031
10.6.1. Germany
10.6.2. UK
10.6.3. France
10.6.4. Rest of Europe
10.7. Market Attractiveness Analysis
10.7.1. By Technology
10.7.2. By Application
10.7.3. By End-use Industry
10.7.4. By Country and Sub-region
11. Asia Pacific Process Spectroscopy Market Analysis and Forecast
11.1. Market Snapshot
11.2. Drivers and Restraints: Impact Analysis
11.3. Process Spectroscopy Market Size (US$ Bn) Analysis & Forecast, by Technology, 2017–2031
11.3.1. Molecular Spectroscopy
11.3.1.1. Near Infrared (NIR) Spectroscopy
11.3.1.2. Raman Spectroscopy
11.3.1.3. Fourier Transform Infrared (FT-IR) Spectroscopy
11.3.1.4. Fluorescence Spectroscopy
11.3.1.5. Others
11.3.2. Mass Spectroscopy
11.3.3. Atomic Spectroscopy
11.4. Process Spectroscopy Market Size (US$ Bn) Analysis & Forecast, by Application, 2017–2031
11.4.1. Biopharma Research
11.4.2. Life Science Research
11.4.3. Polymer Analysis
11.4.4. Forensic Drug Analysis
11.4.5. Academic Research
11.4.6. Petrochemical Analysis
11.4.7. Others
11.5. Process Spectroscopy Market Size (US$ Bn) Analysis & Forecast, by End-use Industry, 2017–2031
11.5.1. Chemical
11.5.2. Healthcare & Life Science
11.5.3. Pharmaceutical
11.5.4. Research & Academia
11.5.5. Food & Beverage
11.5.6. Oil & Gas
11.5.7. Others
11.6. Process Spectroscopy Market Size (US$ Bn) Analysis & Forecast, by Country and Sub-region, 2017–2031
11.6.1. China
11.6.2. Japan
11.6.3. India
11.6.4. South Korea
11.6.5. ASEAN
11.6.6. Rest of Asia Pacific
11.7. Market Attractiveness Analysis
11.7.1. By Technology
11.7.2. By Application
11.7.3. By End-use Industry
11.7.4. By Country and Sub-region
12. Middle East & Africa Process Spectroscopy Market Analysis and Forecast
12.1. Market Snapshot
12.2. Drivers and Restraints: Impact Analysis
12.3. Process Spectroscopy Market Size (US$ Bn) Analysis & Forecast, by Technology, 2017–2031
12.3.1. Molecular Spectroscopy
12.3.1.1. Near Infrared (NIR) Spectroscopy
12.3.1.2. Raman Spectroscopy
12.3.1.3. Fourier Transform Infrared (FT-IR) Spectroscopy
12.3.1.4. Fluorescence Spectroscopy
12.3.1.5. Others
12.3.2. Mass Spectroscopy
12.3.3. Atomic Spectroscopy
12.4. Process Spectroscopy Market Size (US$ Bn) Analysis & Forecast, by Application, 2017–2031
12.4.1. Biopharma Research
12.4.2. Life Science Research
12.4.3. Polymer Analysis
12.4.4. Forensic Drug Analysis
12.4.5. Academic Research
12.4.6. Petrochemical Analysis
12.4.7. Others
12.5. Process Spectroscopy Market Size (US$ Bn) Analysis & Forecast, by End-use Industry, 2017–2031
12.5.1. Chemical
12.5.2. Healthcare & Life Science
12.5.3. Pharmaceutical
12.5.4. Research & Academia
12.5.5. Food & Beverage
12.5.6. Oil & Gas
12.5.7. Others
12.6. Process Spectroscopy Market Size (US$ Bn) Analysis & Forecast, by Country and Sub-region, 2017–2031
12.6.1. GCC
12.6.2. South Africa
12.6.3. Rest of Middle East & Africa
12.7. Market Attractiveness Analysis
12.7.1. By Technology
12.7.2. By Application
12.7.3. By End-use Industry
12.7.4. By Country and Sub-region
13. South America Process Spectroscopy Market Analysis and Forecast
13.1. Market Snapshot
13.2. Drivers and Restraints: Impact Analysis
13.3. Process Spectroscopy Market Size (US$ Bn) Analysis & Forecast, by Technology, 2017–2031
13.3.1. Molecular Spectroscopy
13.3.1.1. Near Infrared (NIR) Spectroscopy
13.3.1.2. Raman Spectroscopy
13.3.1.3. Fourier Transform Infrared (FT-IR) Spectroscopy
13.3.1.4. Fluorescence Spectroscopy
13.3.1.5. Others
13.3.2. Mass Spectroscopy
13.3.3. Atomic Spectroscopy
13.4. Process Spectroscopy Market Size (US$ Bn) Analysis & Forecast, by Application, 2017–2031
13.4.1. Biopharma Research
13.4.2. Life Science Research
13.4.3. Polymer Analysis
13.4.4. Forensic Drug Analysis
13.4.5. Academic Research
13.4.6. Petrochemical Analysis
13.4.7. Others
13.5. Process Spectroscopy Market Size (US$ Bn) Analysis & Forecast, by End-use Industry, 2017–2031
13.5.1. Chemical
13.5.2. Healthcare & Life Science
13.5.3. Pharmaceutical
13.5.4. Research & Academia
13.5.5. Food & Beverage
13.5.6. Oil & Gas
13.5.7. Others
13.6. Process Spectroscopy Market Size (US$ Bn) Analysis & Forecast, by Country and Sub-region, 2017–2031
13.6.1. Brazil
13.6.2. Rest of South America
13.7. Market Attractiveness Analysis
13.7.1. By Technology
13.7.2. By Application
13.7.3. By End-use Industry
13.7.4. By Country and Sub-region
14. Competition Assessment
14.1. Global Process Spectroscopy Market Competition Matrix - a Dashboard View
14.1.1. Global Process Spectroscopy Market Company Share Analysis, by Value (2021)
14.1.2. Technological Differentiator
15. Company Profiles (Global Manufacturers/Suppliers)
15.1. ABB Ltd.
15.1.1. Overview
15.1.2. Product Portfolio
15.1.3. Sales Footprint
15.1.4. Key Subsidiaries or Distributors
15.1.5. Strategy and Recent Developments
15.1.6. Key Financials
15.2. Agilent Technologies, Inc.
15.2.1. Overview
15.2.2. Product Portfolio
15.2.3. Sales Footprint
15.2.4. Key Subsidiaries or Distributors
15.2.5. Strategy and Recent Developments
15.2.6. Key Financials
15.3. Bruker Optics GmbH & Co. KG
15.3.1. Overview
15.3.2. Product Portfolio
15.3.3. Sales Footprint
15.3.4. Key Subsidiaries or Distributors
15.3.5. Strategy and Recent Developments
15.3.6. Key Financials
15.4. BÜCHI Labortechnik AG
15.4.1. Overview
15.4.2. Product Portfolio
15.4.3. Sales Footprint
15.4.4. Key Subsidiaries or Distributors
15.4.5. Strategy and Recent Developments
15.4.6. Key Financials
15.5. Danaher Corporation
15.5.1. Overview
15.5.2. Product Portfolio
15.5.3. Sales Footprint
15.5.4. Key Subsidiaries or Distributors
15.5.5. Strategy and Recent Developments
15.5.6. Key Financials
15.6. Foss A/S
15.6.1. Overview
15.6.2. Product Portfolio
15.6.3. Sales Footprint
15.6.4. Key Subsidiaries or Distributors
15.6.5. Strategy and Recent Developments
15.6.6. Key Financials
15.7. HORIBA, Ltd.
15.7.1. Overview
15.7.2. Product Portfolio
15.7.3. Sales Footprint
15.7.4. Key Subsidiaries or Distributors
15.7.5. Strategy and Recent Developments
15.7.6. Key Financials
15.8. Kett Electric Laboratory Co.Ltd.
15.8.1. Overview
15.8.2. Product Portfolio
15.8.3. Sales Footprint
15.8.4. Key Subsidiaries or Distributors
15.8.5. Strategy and Recent Developments
15.8.6. Key Financials
15.9. Magritek
15.9.1. Overview
15.9.2. Product Portfolio
15.9.3. Sales Footprint
15.9.4. Key Subsidiaries or Distributors
15.9.5. Strategy and Recent Developments
15.9.6. Key Financials
15.10. PerkinElmer, Inc.
15.10.1. Overview
15.10.2. Product Portfolio
15.10.3. Sales Footprint
15.10.4. Key Subsidiaries or Distributors
15.10.5. Strategy and Recent Developments
15.10.6. Key Financials
15.11. Sartorius AG
15.11.1. Overview
15.11.2. Product Portfolio
15.11.3. Sales Footprint
15.11.4. Key Subsidiaries or Distributors
15.11.5. Strategy and Recent Developments
15.11.6. Key Financials
15.12. Thermo Fisher Scientific Inc.
15.12.1. Overview
15.12.2. Product Portfolio
15.12.3. Sales Footprint
15.12.4. Key Subsidiaries or Distributors
15.12.5. Strategy and Recent Developments
15.12.6. Key Financials
15.13. Timegate Instruments Ltd.
15.13.1. Overview
15.13.2. Product Portfolio
15.13.3. Sales Footprint
15.13.4. Key Subsidiaries or Distributors
15.13.5. Strategy and Recent Developments
15.13.6. Key Financials
16. Recommendation
16.1. Opportunity Assessment
16.1.1. By Technology
16.1.2. By Application
16.1.3. By End-use Industry
16.1.4. By Region
List of Tables
Table 01: Global Process Spectroscopy Market Value (US$ Bn) & Forecast, by Technology, 2017‒2031
Table 02: Global Process Spectroscopy Market Value (US$ Bn) & Forecast, by Application, 2017‒2031
Table 03: Global Process Spectroscopy Market Value (US$ Bn) & Forecast, by End-use Industry, 2017‒2031
Table 04: Global Process Spectroscopy Market Value (US$ Bn) & Forecast, by Region, 2017‒2031
Table 05: North America Process Spectroscopy Market Value (US$ Bn) & Forecast, by Technology, 2017‒2031
Table 06: North America Process Spectroscopy Market Value (US$ Bn) & Forecast, by Application, 2017‒2031
Table 07: North America Process Spectroscopy Market Value (US$ Bn) & Forecast, by End-use Industry, 2017‒2031
Table 08: North America Process Spectroscopy Market Value (US$ Bn) & Forecast, by Country and Sub-region, 2017‒2031
Table 09: Europe Process Spectroscopy Market Value (US$ Bn) & Forecast, by Technology, 2017‒2031
Table 10: Europe Process Spectroscopy Market Value (US$ Bn) & Forecast, by Application, 2017‒2031
Table 11: Europe Process Spectroscopy Market Value (US$ Bn) & Forecast, by End-use Industry, 2017‒2031
Table 12: Europe Process Spectroscopy Market Value (US$ Bn) & Forecast, by Country and Sub-region, 2017‒2031
Table 13: Asia Pacific Process Spectroscopy Market Value (US$ Bn) & Forecast, by Technology, 2017‒2031
Table 14: Asia Pacific Process Spectroscopy Market Value (US$ Bn) & Forecast, by Application, 2017‒2031
Table 15: Asia Pacific Process Spectroscopy Market Value (US$ Bn) & Forecast, by End-use Industry, 2017‒2031
Table 16: Asia Pacific Process Spectroscopy Market Value (US$ Bn) & Forecast, by Country and Sub-region, 2017‒2031
Table 17: Middle East & Africa Process Spectroscopy Market Value (US$ Bn) & Forecast, by Technology, 2017‒2031
Table 18: Middle East & Africa Process Spectroscopy Market Value (US$ Bn) & Forecast, by Application, 2017‒2031
Table 19: Middle East & Africa Process Spectroscopy Market Value (US$ Bn) & Forecast, by End-use Industry, 2017‒2031
Table 20: Middle East & Africa Process Spectroscopy Market Value (US$ Bn) & Forecast, by Country and Sub-region, 2017‒2031
Table 21: South America Process Spectroscopy Market Value (US$ Bn) & Forecast, by Technology, 2017‒2031
Table 22: South America Process Spectroscopy Market Value (US$ Bn) & Forecast, by Application, 2017‒2031
Table 23: South America Process Spectroscopy Market Value (US$ Bn) & Forecast, by End-use Industry, 2017‒2031
Table 24: South America Process Spectroscopy Market Value (US$ Bn) & Forecast, by Country and Sub-region, 2017‒2031
List of Figures
Figure 01: Global Process Spectroscopy Market, Value (US$ Bn), 2017‒2031
Figure 02: Global Process Spectroscopy Market Size & Forecast, by Technology, Value (US$ Bn), 2017‒2031
Figure 03: Global Process Spectroscopy Market Attractiveness, by Technology, Value (US$ Bn), 2022‒2031
Figure 04: Global Process Spectroscopy Market Share Analysis, by Technology, 2022 and 2031
Figure 05: Global Process Spectroscopy Market Size & Forecast, by Application, Value (US$ Bn), 2017‒2031
Figure 06: Global Process Spectroscopy Market Attractiveness, by Application, Value (US$ Bn), 2022‒2031
Figure 07: Global Process Spectroscopy Market Share Analysis, by Application, 2022 and 2031
Figure 08: Global Process Spectroscopy Market Size & Forecast, by End-use Industry, Value (US$ Bn), 2017‒2031
Figure 09: Global Process Spectroscopy Market Attractiveness, by End-use Industry, Value (US$ Bn), 2022‒2031
Figure 10: Global Process Spectroscopy Market Share Analysis, by End-use Industry, 2022 and 2031
Figure 11: Global Process Spectroscopy Market Size & Forecast, by Region, Value (US$ Bn), 2017‒2031
Figure 12: Global Process Spectroscopy Market Attractiveness, by Region, Value (US$ Bn), 2022‒2031
Figure 13: Global Process Spectroscopy Market Share Analysis, by Region, 2022 and 2031
Figure 14: North America Process Spectroscopy Market, Value (US$ Bn), 2017‒2031
Figure 15: North America Process Spectroscopy Market Size & Forecast, by Technology, Value (US$ Bn), 2017‒2031
Figure 16: North America Process Spectroscopy Market Attractiveness, by Technology, Value (US$ Bn), 2022‒2031
Figure 17: North America Process Spectroscopy Market Share Analysis, by Technology, 2022 and 2031
Figure 18: North America Process Spectroscopy Market Size & Forecast, by Application, Value (US$ Bn), 2017‒2031
Figure 19: North America Process Spectroscopy Market Attractiveness, by Application, Value (US$ Bn), 2022‒2031
Figure 20: North America Process Spectroscopy Market Share Analysis, by Application, 2022 and 2031
Figure 21: North America Process Spectroscopy Market Size & Forecast, by End-use Industry, Value (US$ Bn), 2017‒2031
Figure 22: North America Process Spectroscopy Market Attractiveness, by End-use Industry, Value (US$ Bn), 2022‒2031
Figure 23: North America Process Spectroscopy Market Share Analysis, by End-use Industry, 2022 and 2031
Figure 24: North America Process Spectroscopy Market Size & Forecast, by Country and Sub-region, Value (US$ Bn), 2017‒2031
Figure 25: North America Process Spectroscopy Market Attractiveness, by Country and Sub-region, Value (US$ Bn), 2022‒2031
Figure 26: North America Process Spectroscopy Market Share Analysis, by Country and Sub-region, 2022 and 2031
Figure 27: Europe Process Spectroscopy Market, Value (US$ Bn), 2017‒2031
Figure 28: Europe Process Spectroscopy Market Size & Forecast, by Technology, Value (US$ Bn), 2017‒2031
Figure 29: Europe Process Spectroscopy Market Attractiveness, by Technology, Value (US$ Bn), 2022‒2031
Figure 30: Europe Process Spectroscopy Market Share Analysis, by Technology, 2022 and 2031
Figure 31: Europe Process Spectroscopy Market Size & Forecast, by Application, Value (US$ Bn), 2017‒2031
Figure 32: Europe Process Spectroscopy Market Attractiveness, by Application, Value (US$ Bn), 2022‒2031
Figure 33: Europe Process Spectroscopy Market Share Analysis, by Application, 2022 and 2031
Figure 34: Europe Process Spectroscopy Market Size & Forecast, by End-use Industry, Value (US$ Bn), 2017‒2031
Figure 35: Europe Process Spectroscopy Market Attractiveness, by End-use Industry, Value (US$ Bn), 2022‒2031
Figure 36: Europe Process Spectroscopy Market Share Analysis, by End-use Industry, 2022 and 2031
Figure 37: Europe Process Spectroscopy Market Size & Forecast, by Country and Sub-region, Value (US$ Bn), 2017‒2031
Figure 38: Europe Process Spectroscopy Market Attractiveness, by Country and Sub-region, Value (US$ Bn), 2022‒2031
Figure 39: Europe Process Spectroscopy Market Share Analysis, by Country and Sub-region, 2022 and 2031
Figure 40: Asia Pacific Process Spectroscopy Market, Value (US$ Bn), 2017‒2031
Figure 41: Asia Pacific Process Spectroscopy Market Size & Forecast, by Technology, Value (US$ Bn), 2017‒2031
Figure 42: Asia Pacific Process Spectroscopy Market Attractiveness, by Technology, Value (US$ Bn), 2022‒2031
Figure 43: Asia Pacific Process Spectroscopy Market Share Analysis, by Technology, 2022 and 2031
Figure 44: Asia Pacific Process Spectroscopy Market Size & Forecast, by Application, Value (US$ Bn), 2017‒2031
Figure 45: Asia Pacific Process Spectroscopy Market Attractiveness, by Application, Value (US$ Bn), 2022‒2031
Figure 46: Asia Pacific Process Spectroscopy Market Share Analysis, by Application, 2022 and 2031
Figure 47: Asia Pacific Process Spectroscopy Market Size & Forecast, by End-use Industry, Value (US$ Bn), 2017‒2031
Figure 48: Asia Pacific Process Spectroscopy Market Attractiveness, by End-use Industry, Value (US$ Bn), 2022‒2031
Figure 49: Asia Pacific Process Spectroscopy Market Share Analysis, by End-use Industry, 2022 and 2031
Figure 50: Asia Pacific Process Spectroscopy Market Size & Forecast, by Country and Sub-region, Value (US$ Bn), 2017‒2031
Figure 51: Asia Pacific Process Spectroscopy Market Attractiveness, by Country and Sub-region, Value (US$ Bn), 2022‒2031
Figure 52: Asia Pacific Process Spectroscopy Market Share Analysis, by Country and Sub-region, 2022 and 2031
Figure 53: Middle East & Africa Process Spectroscopy Market, Value (US$ Bn), 2017‒2031
Figure 54: Middle East & Africa Process Spectroscopy Market Size & Forecast, by Technology, Value (US$ Bn), 2017‒2031
Figure 55: Middle East & Africa Process Spectroscopy Market Attractiveness, by Technology, Value (US$ Bn), 2022‒2031
Figure 56: Middle East & Africa Process Spectroscopy Market Share Analysis, by Technology, 2022 and 2031
Figure 57: Middle East & Africa Process Spectroscopy Market Size & Forecast, by Application, Value (US$ Bn), 2017‒2031
Figure 58: Middle East & Africa Process Spectroscopy Market Attractiveness, by Application, Value (US$ Bn), 2022‒2031
Figure 59: Middle East & Africa Process Spectroscopy Market Share Analysis, by Application, 2022 and 2031
Figure 60: Middle East & Africa Process Spectroscopy Market Size & Forecast, by End-use Industry, Value (US$ Bn), 2017‒2031
Figure 61: Middle East & Africa Process Spectroscopy Market Attractiveness, by End-use Industry, Value (US$ Bn), 2022‒2031
Figure 62: Middle East & Africa Process Spectroscopy Market Share Analysis, by End-use Industry, 2022 and 2031
Figure 63: Middle East & Africa Process Spectroscopy Market Size & Forecast, by Country and Sub-region, Value (US$ Bn), 2017‒2031
Figure 64: Middle East & Africa Process Spectroscopy Market Attractiveness, by Country and Sub-region, Value (US$ Bn), 2022‒2031
Figure 65: Middle East & Africa Process Spectroscopy Market Share Analysis, by Country and Sub-region, 2022 and 2031
Figure 66: South America Process Spectroscopy Market, Value (US$ Bn), 2017‒2031
Figure 67: South America Process Spectroscopy Market Size & Forecast, by Technology, Value (US$ Bn), 2017‒2031
Figure 68: South America Process Spectroscopy Market Attractiveness, by Technology, Value (US$ Bn), 2022‒2031
Figure 69: South America Process Spectroscopy Market Share Analysis, by Technology, 2022 and 2031
Figure 70: South America Process Spectroscopy Market Size & Forecast, by Application, Value (US$ Bn), 2017‒2031
Figure 71: South America Process Spectroscopy Market Attractiveness, by Application, Value (US$ Bn), 2022‒2031
Figure 72: South America Process Spectroscopy Market Share Analysis, by Application, 2022 and 2031
Figure 73: South America Process Spectroscopy Market Size & Forecast, by End-use Industry, Value (US$ Bn), 2017‒2031
Figure 74: South America Process Spectroscopy Market Attractiveness, by End-use Industry, Value (US$ Bn), 2022‒2031
Figure 75: South Amerca Process Spectroscopy Market Share Analysis, by End-use Industry, 2022 and 2031
Figure 76: South America Process Spectroscopy Market Size & Forecast, by Country and Sub-region, Value (US$ Bn), 2017‒2031
Figure 77: South America Process Spectroscopy Market Attractiveness, by Country and Sub-region, Value (US$ Bn), 2022‒2031
Figure 78: South America Process Spectroscopy Market Share Analysis, by Country and Sub-region, 2022 and 2031
Copyright © Transparency Market Research, Inc. All Rights reserved
Trust Online

Process Spectroscopy Market