
Reports
Reports
Prevention Strategies Gain Importance During Coronavirus Pandemic
Given the importance of pressure ulcer (PU) prevention in patients during the coronavirus pandemic, stakeholders in the pressure ulcer diagnostics market are gaining awareness about focused prevention strategies involving skin assessment and care. In order to achieve this, stakeholders and healthcare providers are increasing the availability of diagnostic tests such as magnetic resonance imaging (MRI) and computed tomography (CT) scan, among others.
Since stakeholders in the pressure ulcer diagnostics market are under scrutiny similar to the entire healthcare sector, stakeholders are encouraging healthcare providers to adopt prevention strategies including offloading and pressure redistribution to improve the patient quality of life. Healthcare providers are maintaining sufficient inventories for dressing and other therapeutics to reduce the incidence and prevalence of largely preventable wounds.
Progression of BP May Lead to Challenges in Accurate Diagnosis
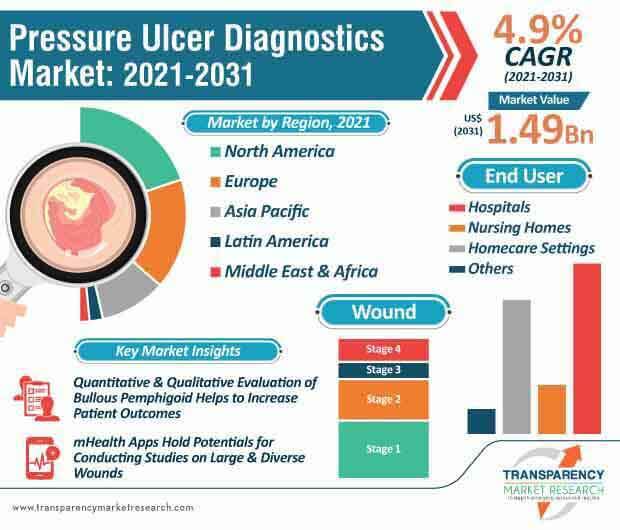
The pressure ulcer diagnostics market is projected to cross US$ 1.49 Bn by 2031. Bullous pemphigoid (BP) is a severe skin disorder with high morbidity and mortality rates. However, as the condition progresses, rendering an accurate diagnosis may be a challenge for clinicians. Hence, practitioners are arriving at a diagnosis of BP by evaluating the clinical manifestations of the disorder and by obtaining a detailed patient history.
In order to improve patient outcomes, healthcare providers are conducting clinical evaluation of a pressure ulcer based on quantitative and qualitative evaluation. The acetate tracing is emerging as the gold standard for measuring wound surface area.
mHealth Apps Proving Advantageous in Digital Wound Measurement
Mobile health (mHealth) apps are being publicized as a new business model in the pressure ulcer diagnostics market. Since acetate tracing is associated with difficulties in material availability, data storage issues, and the time needed to calculate the surface area, stakeholders and startups are bullish on expanding their medical services through mHealth apps.
mHealth apps are storming the pressure ulcer diagnostics market. These apps help use planimetry techniques that are a promising alternative to traditional wound assessment methods. Thus, to maximize the use of mHealth apps, market stakeholders must increase R&D to conduct studies on larger and more diverse wounds. The imitoMeasure is gaining popularity for digital wound measurement.
Treatment of Underlying Diseases Helps Improve Patient Outcomes
Despite awareness about the issues associated with pressure ulcers, the rates of pressure wounds remain high in long-term care facilities and nursing homes, where there is a lack of staff and optimal care is not always possible. In order to prevent decubitus ulcers, healthcare providers are creating awareness about the proper placement of patients in bed and treatment of underlying diseases.
CT is the modality of choice for assessment of bone involvement in pressure ulcers. Companies in the pressure ulcer diagnostics market are increasing their focus in CT fistulography with contrast introduction in the fistula in order to show contrast diffusion in the fistulous tract, thus allowing the evaluation of necrosis extension to the joints or bone surface.
Analysts’ Viewpoint
Besides advanced services through MRI and CT, healthcare providers should maintain inventories for pH-balanced cleansers, dressings such as hydrocolloids, and positioning devices to improve the patient quality of life amid the COVID-19 pandemic. Pain and discomfort are being controlled with the help of analgesics. Although acetate tracing is the standard technique used to measure wound surface, using it in daily practice is linked with challenges in data storage issues, material availability, and the time needed to calculate the surface area. Hence, companies in the pressure ulcer diagnostics market should unlock value-grab opportunities in mHealth apps that help in implementing planimetry techniques.
Pressure Ulcer Diagnostics Market: Overview
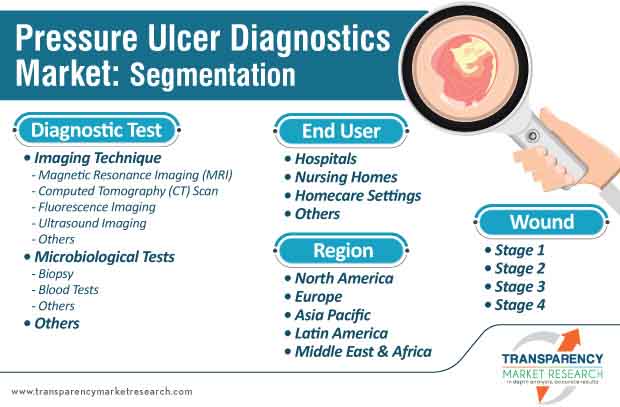
Pressure Ulcer Diagnostics Market: Segmentation
Pressure Ulcer Diagnostics Market: Regional Segmentation
Pressure Ulcer Diagnostics Market: Major Players
Pressure ulcer diagnostics market is projected to cross US$ 1.49 Bn by 2031
Pressure ulcer diagnostics market is driven by rise in awareness about pressure ulcer diagnostic tools & tests, and surge in COVID-19 patients suffering from pressure ulcers & other chronic diseases
North America accounted for a major share of the global pressure ulcer diagnostics market
The imaging technique segment accounted for major pressure ulcer diagnostics market share and the trend is projected to continue during the forecast period
Key players operating in the global pressure ulcer diagnostics market are IR-MED, Bruin Biometrics LLC, Canon Medical Systems Corporation, Esaote SPA, Fonar Corporation, Bruker Corporation, FUJIFILM Healthcare Corporation, GE Healthcare
1. Preface
1.1. Market Definition and Scope
1.2. Market Segmentation
1.3. Key Research Objectives
1.4. Research Highlights
2. Assumptions and Research Methodology
3. Executive Summary: Global Pressure Ulcer Diagnostics Market
4. Market Overview
4.1. Introduction
4.1.1. Market Definition
4.1.2. Industry Evolution / Developments
4.2. Overview
4.3. Market Dynamics
4.3.1. Drivers
4.3.2. Restraints
4.3.3. Opportunities
4.4. Global Pressure Ulcer Diagnostics Market Analysis and Forecast, 2017–2031
4.4.1. Market Revenue Projections (US$ Mn)
5. Key Insights
5.1. Technological Advancements
5.2. Disease Prevalence & Incidence Rate globally with key countries
5.3. Regulatory Scenario by Region/globally
5.4. Overview of Diagnostic Processes in Wound Management
5.5. COVID-19 pandemic impact on the Global Pressure Ulcer Diagnostics Market
6. Global Pressure Ulcer Diagnostics Market Analysis and Forecast, by Diagnostic Test
6.1. Introduction & Definition
6.2. Key Findings / Developments
6.3. Global Pressure Ulcer Diagnostics Market Value (US$ Mn) Forecast, by Diagnostic Test, 2017–2031
6.3.1. Imaging Technique
6.3.1.1. Magnetic Resonance Imaging (MRI)
6.3.1.2. Computed Tomography (CT) Scan
6.3.1.3. Fluorescence Imaging
6.3.1.4. Ultrasound Imaging
6.3.1.5. Others
6.3.2. Microbiological Tests
6.3.2.1. Biopsy
6.3.2.2. Blood Tests
6.3.2.3. Others
6.3.3. Others
6.4. Global Pressure Ulcer Diagnostics Market Attractiveness Analysis, by Diagnostic Test
7. Global Pressure Ulcer Diagnostics Market Analysis and Forecast, by Wound, 2017-2031
7.1. Introduction & Definition
7.2. Key Findings / Developments
7.3. Global Pressure Ulcer Diagnostics Market Value (US$ Mn) Forecast, by Wound, 2017–2031
7.3.1. Stage 1
7.3.2. Stage 2
7.3.3. Stage 3
7.3.4. Stage 4
7.4. Global Pressure Ulcer Diagnostics Market Attractiveness Analysis, by Wound
8. Global Pressure Ulcer Diagnostics Market Analysis and Forecast, by End-user
8.1. Introduction & Definition
8.2. Key Findings / Developments
8.3. Global Pressure Ulcer Diagnostics Market Value (US$ Mn) Forecast, by End-user, 2017–2031
8.3.1. Hospitals
8.3.2. Nursing Homes
8.3.3. Homecare Settings
8.3.4. Others
8.4. Global Pressure Ulcer Diagnostics Market Attractiveness Analysis, by End-user
9. Global Pressure Ulcer Diagnostics Market Analysis and Forecast, by Region
9.1. Key Findings
9.2. Global Pressure Ulcer Diagnostics Market Value (US$ Mn) Forecast, by Region
9.2.1. North America
9.2.2. Europe
9.2.3. Asia Pacific
9.2.4. Latin America
9.2.5. Middle East & Africa
9.3. Global Pressure Ulcer Diagnostics Market Attractiveness Analysis, by Region
10. North America Pressure Ulcer Diagnostics Market Analysis and Forecast
10.1. Introduction
10.1.1. Key Findings
10.2. North America Pressure Ulcer Diagnostics Market Value (US$ Mn) Forecast, by Diagnostic Test, 2017–2031
10.2.1. Imaging Technique
10.2.1.1. Magnetic Resonance Imaging (MRI)
10.2.1.2. Computed Tomography (CT) Scan
10.2.1.3. Fluorescence Imaging
10.2.1.4. Ultrasound Imaging
10.2.1.5. Others
10.2.2. Microbiological Tests
10.2.2.1. Biopsy
10.2.2.2. Blood Tests
10.2.2.3. Others
10.2.3. Others
10.3. North America Pressure Ulcer Diagnostics Market Value (US$ Mn) Forecast, by Wound, 2017–2031
10.3.1. Stage 1
10.3.2. Stage 2
10.3.3. Stage 3
10.3.4. Stage 4
10.4. North America Pressure Ulcer Diagnostics Market Value (US$ Mn) Forecast, by End-user, 2017–2031
10.4.1. Hospitals
10.4.2. Nursing Homes
10.4.3. Homecare Settings
10.4.4. Others
10.5. North America Pressure Ulcer Diagnostics Market Value (US$ Mn) Forecast, by Country, 2017–2031
10.5.1. U.S.
10.5.2. Canada
10.6. North America Pressure Ulcer Diagnostics Market Attractiveness Analysis, 2017–2031
11. Europe Pressure Ulcer Diagnostics Market Analysis and Forecast
11.1. Introduction
11.1.1. Key Findings
11.2. Europe Pressure Ulcer Diagnostics Market Value (US$ Mn) Forecast, by Diagnostic Test, 2017–2031
11.2.1. Imaging Technique
11.2.1.1. Magnetic Resonance Imaging (MRI)
11.2.1.2. Computed Tomography (CT) Scan
11.2.1.3. Fluorescence Imaging
11.2.1.4. Ultrasound Imaging
11.2.1.5. Others
11.2.2. Microbiological Tests
11.2.2.1. Biopsy
11.2.2.2. Blood Tests
11.2.2.3. Others
11.2.3. Others
11.3. Europe Pressure Ulcer Diagnostics Market Value (US$ Mn) Forecast, by Wound, 2017–2031
11.3.1. Stage 1
11.3.2. Stage 2
11.3.3. Stage 3
11.3.4. Stage 4
11.4. Europe Pressure Ulcer Diagnostics Market Value (US$ Mn) Forecast, by End-user, 2017–2031
11.4.1. Hospitals
11.4.2. Nursing Homes
11.4.3. Homecare Settings
11.4.4. Others
11.5. Europe Pressure Ulcer Diagnostics Market Value (US$ Mn) Forecast, by Country/Sub-region, 2017–2031
11.5.1. Germany
11.5.2. U.K.
11.5.3. France
11.5.4. Spain
11.5.5. Italy
11.5.6. Rest of Europe
11.6. Europe Pressure Ulcer Diagnostics Market Attractiveness Analysis, 2017–2031
12. Asia Pacific Pressure Ulcer Diagnostics Market Analysis and Forecast
12.1. Introduction
12.1.1. Key Findings
12.2. Asia Pacific Pressure Ulcer Diagnostics Market Value (US$ Mn) Forecast, by Diagnostic Test, 2017–2031
12.2.1. Imaging Technique
12.2.1.1. Magnetic Resonance Imaging (MRI)
12.2.1.2. Computed Tomography (CT) Scan
12.2.1.3. Fluorescence Imaging
12.2.1.4. Ultrasound Imaging
12.2.1.5. Others
12.2.2. Microbiological Tests
12.2.2.1. Biopsy
12.2.2.2. Blood Tests
12.2.2.3. Others
12.2.3. Others
12.3. Asia Pacific Pressure Ulcer Diagnostics Market Value (US$ Mn) Forecast, by Wound, 2017–2031
12.3.1. Stage 1
12.3.2. Stage 2
12.3.3. Stage 3
12.3.4. Stage 4
12.4. Asia Pacific Pressure Ulcer Diagnostics Market Value (US$ Mn) Forecast, by End-user, 2017–2031
12.4.1. Hospitals
12.4.2. Nursing Homes
12.4.3. Homecare Settings
12.4.4. Others
12.5. Asia Pacific Pressure Ulcer Diagnostics Market Value (US$ Mn) Forecast, by Country/Sub-region, 2017–2031
12.5.1. Japan
12.5.2. China
12.5.3. India
12.5.4. Australia & New Zealand
12.5.5. Rest of Asia Pacific
12.6. Asia Pacific Pressure Ulcer Diagnostics Market Attractiveness Analysis, 2017–2031
13. Latin America Pressure Ulcer Diagnostics Market Analysis and Forecast
13.1. Introduction
13.1.1. Key Findings
13.2. Latin America Pressure Ulcer Diagnostics Market Value (US$ Mn) Forecast, by Diagnostic Test, 2017–2031
13.2.1. Imaging Technique
13.2.1.1. Magnetic Resonance Imaging (MRI)
13.2.1.2. Computed Tomography (CT) Scan
13.2.1.3. Fluorescence Imaging
13.2.1.4. Ultrasound Imaging
13.2.1.5. Others
13.2.2. Microbiological Tests
13.2.2.1. Biopsy
13.2.2.2. Blood Tests
13.2.2.3. Others
13.2.3. Others
13.3. Latin America Pressure Ulcer Diagnostics Market Value (US$ Mn) Forecast, by Wound, 2017–2031
13.3.1. Stage 1
13.3.2. Stage 2
13.3.3. Stage 3
13.3.4. Stage 4
13.4. Latin America Pressure Ulcer Diagnostics Market Value (US$ Mn) Forecast, by End-user, 2017–2031
13.4.1. Hospitals
13.4.2. Nursing Homes
13.4.3. Homecare Settings
13.4.4. Others
13.5. Latin America Pressure Ulcer Diagnostics Market Value (US$ Mn) Forecast, by Country/Sub-region, 2017–2031
13.5.1. Brazil
13.5.2. Mexico
13.5.3. Rest of Latin America
13.6. Latin America Pressure Ulcer Diagnostics Market Attractiveness Analysis, 2017–2031
14. Middle East & Africa Pressure Ulcer Diagnostics Market Analysis and Forecast
14.1. Introduction
14.1.1. Key Findings
14.2. Middle East & Africa Pressure Ulcer Diagnostics Market Value (US$ Mn) Forecast, by Diagnostic Test, 2017–2031
14.2.1. Imaging Technique
14.2.1.1. Magnetic Resonance Imaging (MRI)
14.2.1.2. Computed Tomography (CT) Scan
14.2.1.3. Fluorescence Imaging
14.2.1.4. Ultrasound Imaging
14.2.1.5. Others
14.2.2. Microbiological Tests
14.2.2.1. Biopsy
14.2.2.2. Blood Tests
14.2.2.3. Others
14.2.3. Others
14.3. Middle East & Africa Pressure Ulcer Diagnostics Market Value (US$ Mn) Forecast, by Wound, 2017–2031
14.3.1. Stage 1
14.3.2. Stage 2
14.3.3. Stage 3
14.3.4. Stage 4
14.4. Middle East & Africa Pressure Ulcer Diagnostics Market Value (US$ Mn) Forecast, by End-user, 2017–2031
14.4.1. Hospitals
14.4.2. Nursing Homes
14.4.3. Homecare Settings
14.4.4. Others
14.5. Middle East & Africa Pressure Ulcer Diagnostics Market Value (US$ Mn) Forecast, by Country/Sub-region, 2017–2031
14.5.1. GCC Countries
14.5.2. South Africa
14.5.3. Rest of Middle East & Africa
14.6. Middle East & Africa Pressure Ulcer Diagnostics Market Attractiveness Analysis, 2017–2031
15. Competitive Landscape
15.1. Market Player - Competition Matrix (by tier and size of companies)
15.2. Market Share Analysis, by Company, 2020
15.3. Company Profiles
15.3.1. IR-MED
15.3.1.1. Company Overview (HQ, Business Segments, Employee Strength)
15.3.1.2. Product Portfolio
15.3.1.3. Strategic Overview
15.3.1.4. SWOT Analysis
15.3.2. Bruin Biometrics, LLC
15.3.2.1. Company Overview (HQ, Business Segments, Employee Strength)
15.3.2.2. Product Portfolio
15.3.2.3. Strategic Overview
15.3.2.4. SWOT Analysis
15.3.3. Canon Medical Systems Corporation
15.3.3.1. Company Overview (HQ, Business Segments, Employee Strength)
15.3.3.2. Product Portfolio
15.3.3.3. Financial Overview
15.3.3.4. Strategic Overview
15.3.3.5. SWOT Analysis
15.3.4. Esaote SPA
15.3.4.1. Company Overview (HQ, Business Segments, Employee Strength)
15.3.4.2. Product Portfolio
15.3.4.3. Strategic Overview
15.3.4.4. SWOT Analysis
15.3.5. Fonar Corporation
15.3.5.1. Company Overview (HQ, Business Segments, Employee Strength)
15.3.5.2. Product Portfolio
15.3.5.3. Financial Overview
15.3.5.4. Strategic Overview
15.3.5.5. SWOT Analysis
15.3.6. Bruker Corporation
15.3.6.1. Company Overview (HQ, Business Segments, Employee Strength)
15.3.6.2. Product Portfolio
15.3.6.3. Financial Overview
15.3.6.4. Strategic Overview
15.3.6.5. SWOT Analysis
15.3.7. FUJIFILM Healthcare Corporation
15.3.7.1. Company Overview (HQ, Business Segments, Employee Strength)
15.3.7.2. Product Portfolio
15.3.7.3. Strategic Overview
15.3.7.4. SWOT Analysis
15.3.8. GE Healthcare
15.3.8.1. Company Overview (HQ, Business Segments, Employee Strength)
15.3.8.2. Product Portfolio
15.3.8.3. Financial Overview
15.3.8.4. Strategic Overview
15.3.8.5. SWOT Analysis
15.3.9. Arjo
15.3.9.1. Company Overview (HQ, Business Segments, Employee Strength)
15.3.9.2. Product Portfolio
15.3.9.3. Financial Overview
15.3.9.4. Strategic Overview
15.3.9.5. SWOT Analysis
15.3.10. CYBERDYNE INC
15.3.10.1. Company Overview (HQ, Business Segments, Employee Strength)
15.3.10.2. Product Portfolio
15.3.10.3. Financial Overview
15.3.10.4. Strategic Overview
15.3.10.5. SWOT Analysis
15.3.11. MolecuLight Inc.
15.3.11.1. Company Overview (HQ, Business Segments, Employee Strength)
15.3.11.2. Product Portfolio
15.3.11.3. Strategic Overview
15.3.11.4. SWOT Analysis
List of Tables
Table 01: Global Pressure Ulcer Diagnostics Market Value (US$ Mn) Forecast, by Diagnostic Test, 2017–2031
Table 02: Global Pressure Ulcer Diagnostics Market Value (US$ Mn) Forecast, by Imaging Technique, 2017–2031
Table 03: Global Pressure Ulcer Diagnostics Market Value (US$ Mn) Forecast, by Microbiological Tests, 2017–2031
Table 04: Global Pressure Ulcer Diagnostics Market Value (US$ Mn) Forecast, by Wound, 2017–2031
Table 05: Global Pressure Ulcer Diagnostics Market Value (US$ Mn) Forecast, by End-user, 2017–2031
Table 06: Global Pressure Ulcer Diagnostics Value Share and Attractiveness Analysis, by Region, 2017–2031
Table 07: North America Pressure Ulcer Diagnostics Market Value (US$ Mn) Forecast, by Diagnostic Tests, 2017–2031
Table 08: North America Pressure Ulcer Diagnostics Market Value (US$ Mn) Forecast, by Imaging Technique, 2017–2031
Table 09: North America Pressure Ulcer Diagnostics Market Value (US$ Mn) Forecast, by Microbiological Tests, 2017–2031
Table 10: North America Pressure Ulcer Diagnostics Market Value (US$ Mn) Forecast, by Wound, 2017–2031
Table 11: North America Pressure Ulcer Diagnostics Market Value (US$ Mn) Forecast, by End-user, 2017–2031
Table 12: North America Pressure Ulcer Diagnostics Market Value (US$ Mn) Forecast, by Country, 2017–2031
Table 13: Europe Pressure Ulcer Diagnostics Market Value (US$ Mn) Forecast, by Diagnostic Tests, 2017–2031
Table 14: Europe Pressure Ulcer Diagnostics Market Value (US$ Mn) Forecast, by Imaging Technique, 2017–2031
Table 15: Europe Pressure Ulcer Diagnostics Market Value (US$ Mn) Forecast, by Microbiological Tests, 2017–2031
Table 16: Europe Pressure Ulcer Diagnostics Market Value (US$ Mn) Forecast, by Wound, 2017–2031
Table 17: Europe Pressure Ulcer Diagnostics Market Value (US$ Mn) Forecast, by End-user, 2017–2031
Table 18: Europe Pressure Ulcer Diagnostics Market Value (US$ Mn) Forecast, by Country/Sub-region, 2017–2031
Table 19: Asia Pacific Pressure Ulcer Diagnostics Market Value (US$ Mn) Forecast, by Diagnostic Tests, 2017–2031
Table 20: Asia Pacific Pressure Ulcer Diagnostics Market Value (US$ Mn) Forecast, by Imaging Technique, 2017–2031
Table 21: Asia Pacific Pressure Ulcer Diagnostics Market Value (US$ Mn) Forecast, by Microbiological Tests, 2017–2031
Table 22: Asia Pacific Pressure Ulcer Diagnostics Market Value (US$ Mn) Forecast, by Wound, 2017–2031
Table 23: Asia Pacific Pressure Ulcer Diagnostics Market Value (US$ Mn) Forecast, by End-user, 2017–2031
Table 24: Asia Pacific Pressure Ulcer Diagnostics Market Value (US$ Mn) Forecast, by Country/Sub-region, 2017–2031
Table 25: Latin America Pressure Ulcer Diagnostics Market Value (US$ Mn) Forecast, by Diagnostic Tests, 2017–2031
Table 26: Latin America Pressure Ulcer Diagnostics Market Value (US$ Mn) Forecast, by Imaging Technique, 2017–2031
Table 27: Latin America Pressure Ulcer Diagnostics Market Value (US$ Mn) Forecast, by Microbiological Tests, 2017–2031
Table 28: Latin America Pressure Ulcer Diagnostics Market Value (US$ Mn) Forecast, by Wound, 2017–2031
Table 29: Latin America Pressure Ulcer Diagnostics Market Value (US$ Mn) Forecast, by End-user, 2017–2031
Table 30: Latin America Pressure Ulcer Diagnostics Market Value (US$ Mn) Forecast, by Country/Sub-region, 2017–2031
Table 31: Middle East & Africa Pressure Ulcer Diagnostics Market Value (US$ Mn) Forecast, by Diagnostic Tests, 2017–2031
Table 32: Middle East & Africa Pressure Ulcer Diagnostics Market Value (US$ Mn) Forecast, by Imaging Technique, 2017–2031
Table 33: Middle East & Africa Pressure Ulcer Diagnostics Market Value (US$ Mn) Forecast, by Microbiological Tests, 2017–2031
Table 34: Middle East & Africa Pressure Ulcer Diagnostics Market Value (US$ Mn) Forecast, by Wound, 2017–2031
Table 35: Middle East & Africa Pressure Ulcer Diagnostics Market Value (US$ Mn) Forecast, by End-user, 2017–2031
Table 36: Middle East & Africa Pressure Ulcer Diagnostics Market Value (US$ Mn) Forecast, by Country/Sub-region, 2017–2031
List of Figures
Figure 01: Global Pressure Ulcer Diagnostics Market Value (US$ Mn) Forecast, 2017–2031
Figure 02: Global Pressure Ulcer Diagnostics Market Value Share, by Diagnostic Test, 2020
Figure 03: Global Pressure Ulcer Diagnostics Market Value Share, by Wound, 2020
Figure 04: Global Pressure Ulcer Diagnostics Value Share, by Region, 2020
Figure 05: Global Pressure Ulcer Diagnostics Value Share, by Region, 2020
Figure 06: Global Pressure Ulcer Diagnostics Market Value Share Analysis, by Diagnostic Test, 2020 and 2031
Figure 07: Global Pressure Ulcer Diagnostics Market Attractiveness Analysis, by Diagnostic Test, 2021–2031
Figure 08: Global Pressure Ulcer Diagnostics Market Value (US$ Mn), by Imaging Technique, 2017–2031
Figure 09: Global Pressure Ulcer Diagnostics Market Value (US$ Mn), by Microbiological Tests, 2017–2031
Figure 10: Global Pressure Ulcer Diagnostics Market Value (US$ Mn), by Others, 2017–2031
Figure 11: Global Pressure Ulcer Diagnostics Market Value Share Analysis, by Wound, 2020 and 2031
Figure 12: Global Pressure Ulcer Diagnostics Market Attractiveness Analysis, by Wound, 2021–2031
Figure 13: Global Pressure Ulcer Diagnostics Market Value (US$ Mn), by Stage 1, 2017–2031
Figure 14: Global Pressure Ulcer Diagnostics Market Value (US$ Mn), by Stage 2, 2017–2031
Figure 15: Global Pressure Ulcer Diagnostics Market Value (US$ Mn), by Stage 3, 2017–2031
Figure 16: Global Pressure Ulcer Diagnostics Market Value (US$ Mn), by Stage 4, 2017–2031
Figure 17: Global Pressure Ulcer Diagnostics Market Value Share Analysis, by End-user, 2020 and 2031
Figure 18: Global Pressure Ulcer Diagnostics Market Attractiveness Analysis, by End-user, 2021–2031
Figure 19: Global Pressure Ulcer Diagnostics Market Value (US$ Mn), by Hospitals, 2017–2031
Figure 20: Global Pressure Ulcer Diagnostics Market Value (US$ Mn), by Home Care Settings, 2017–2031
Figure 21: Global Pressure Ulcer Diagnostics Market Value (US$ Mn), by Nursing Homes, 2017–2031
Figure 22: Global Pressure Ulcer Diagnostics Market Value (US$ Mn), by Others, 2017–2031
Figure 23: Global Pressure Ulcer Diagnostics Market Value Share Analysis, by Region, 2020 and 2031
Figure 24: Global Pressure Ulcer Diagnostics Market Attractiveness Analysis, by Region, 2021–2031
Figure 25: North America Pressure Ulcer Diagnostics Market Value (US$ Mn) Forecast, 2017–2031
Figure 26: North America Pressure Ulcer Diagnostics Market Value Share Analysis, by Diagnostic Tests, 2020 and 2031
Figure 27: North America Pressure Ulcer Diagnostics Market Attractiveness Analysis, by Diagnostic Tests, 2021–2031
Figure 28: North America Pressure Ulcer Diagnostics Market Value Share Analysis, by Wound, 2020 and 2031
Figure 29: North America Pressure Ulcer Diagnostics Market Attractiveness Analysis, by Wound, 2021–2031
Figure 30: North America Pressure Ulcer Diagnostics Market Analysis, by End-user, 2020 and 2031
Figure 31: North America Pressure Ulcer Diagnostics Market Attractiveness Analysis, by End-user, 2021–2031
Figure 32: North America Pressure Ulcer Diagnostics Market Analysis, by Country, 2020 and 2031
Figure 33: North America Pressure Ulcer Diagnostics Market Attractiveness Analysis, by Country, 2021–2031
Figure 34: Europe Pressure Ulcer Diagnostics Market Value (US$ Mn) Forecast, 2017–2031
Figure 35: Europe Pressure Ulcer Diagnostics Market Value Share Analysis, by Diagnostic Tests, 2020 and 2031
Figure 36: Europe Pressure Ulcer Diagnostics Market Attractiveness Analysis, by Diagnostic Tests, 2021–2031
Figure 37: Europe Pressure Ulcer Diagnostics Market Value Share Analysis, by Wound, 2020 and 2031
Figure 38: Europe Pressure Ulcer Diagnostics Market Attractiveness Analysis, by Wound, 2021–2031
Figure 39: Europe Pressure Ulcer Diagnostics Market Analysis, by End-user, 2020 and 2031
Figure 40: Europe Pressure Ulcer Diagnostics Market Attractiveness Analysis, by End-user, 2021–2031
Figure 41: Europe Pressure Ulcer Diagnostics Market Analysis, by Country/Sub-region, 2020 and 2031
Figure 42: Europe Pressure Ulcer Diagnostics Market Attractiveness Analysis, by Country/Sub-region, 2021–2031
Figure 43: Asia Pacific Pressure Ulcer Diagnostics Market Value (US$ Mn) Forecast, 2017–2031
Figure 44: Asia Pacific Pressure Ulcer Diagnostics Market Value Share Analysis, by Diagnostic Tests, 2020 and 2031
Figure 45: Asia Pacific Pressure Ulcer Diagnostics Market Attractiveness Analysis, by Diagnostic Tests, 2021–2031
Figure 46: Asia Pacific Pressure Ulcer Diagnostics Market Value Share Analysis, by Wound, 2020 and 2031
Figure 47: Asia Pacific Pressure Ulcer Diagnostics Market Attractiveness Analysis, by Wound, 2021–2031
Figure 48: Asia Pacific Pressure Ulcer Diagnostics Market Analysis, by End-user, 2020 and 2031
Figure 49: Asia Pacific Pressure Ulcer Diagnostics Market Attractiveness Analysis, by End-user, 2021–2031
Figure 50: Asia Pacific Pressure Ulcer Diagnostics Market Analysis, by Country/Sub-region, 2020 and 2031
Figure 51: Asia Pacific Pressure Ulcer Diagnostics Market Attractiveness Analysis, by Country/Sub-region, 2021–2031
Figure 52: Latin America Pressure Ulcer Diagnostics Market Value (US$ Mn) Forecast, 2017–2031
Figure 53: Latin America Pressure Ulcer Diagnostics Market Value Share Analysis, by Diagnostic Tests, 2020 and 2031
Figure 54: Latin America Pressure Ulcer Diagnostics Market Attractiveness Analysis, by Diagnostic Tests, 2021–2031
Figure 55: Latin America Pressure Ulcer Diagnostics Market Value Share Analysis, by Wound, 2020 and 2031
Figure 56: Latin America Pressure Ulcer Diagnostics Market Attractiveness Analysis, by Wound, 2021–2031
Figure 57: Latin America Pressure Ulcer Diagnostics Market Analysis, by End-user, 2020 and 2031
Figure 58: Latin America Pressure Ulcer Diagnostics Market Attractiveness Analysis, by End-user, 2021–2031
Figure 59: Latin America Pressure Ulcer Diagnostics Market Analysis, by Country/Sub-region, 2020 and 2031
Figure 60: Latin America Pressure Ulcer Diagnostics Market Attractiveness Analysis, by Country/Sub-region, 2021–2031
Figure 61: Middle East & Africa Pressure Ulcer Diagnostics Market Value (US$ Mn) Forecast, 2017–2031
Figure 62: Middle East & Africa Pressure Ulcer Diagnostics Market Value Share Analysis, by Diagnostic Tests, 2020 and 2031
Figure 63: Middle East & Africa Pressure Ulcer Diagnostics Market Attractiveness Analysis, by Diagnostic Tests, 2021–2031
Figure 64: Middle East & Africa Pressure Ulcer Diagnostics Market Value Share Analysis, by Wound, 2020 and 2031
Figure 65: Middle East & Africa Pressure Ulcer Diagnostics Market Attractiveness Analysis, by Wound, 2021–2031
Figure 66: Middle East & Africa Pressure Ulcer Diagnostics Market Analysis, by End-user, 2020 and 2031
Figure 67: Middle East & Africa Pressure Ulcer Diagnostics Market Attractiveness Analysis, by End-user, 2021–2031
Figure 68: Middle East & Africa Pressure Ulcer Diagnostics Market Analysis, by Country/Sub-region, 2020 and 2031
Figure 69: Middle East & Africa Pressure Ulcer Diagnostics Market Attractiveness Analysis, by Country/Sub-region, 2021–2031
Copyright © Transparency Market Research, Inc. All Rights reserved
Trust Online

Pressure Ulcer Diagnostics Market Trends, 2021-2031