
Reports
Reports
Surgical imaging arms are devices that are highly essential to meet the rising demand for minimally invasive procedures and hence, they have become an important tool in healthcare facilities such as hospitals, clinics, and in research institutes. In terms of revenue, the global surgical imaging arms market was valued at above US$ 1,000 Mn in 2017 and is anticipated to reach approximately US$ 1,600 Mn by 2026, expanding at a CAGR of 4.6% from 2018 to 2026. Rise in the number of interventional radiology procedures, high demand for minimally invasive surgeries, and complication of orthopedic surgeries with traditional equipment are key factors that are anticipated to propel the surgical imaging arms market during the forecast period.
Rising globalization leads to the outbreak of several diseases, and some of them require surgery. According to the According to the Annual Plastic Surgery Report by the American Society of Plastic Surgeons, there were almost 15.9 million surgical and minimally-invasive cosmetic procedures performed in the U.S, in 2015, a 2% increase over 2014. This increasing number of surgeries is fueling the demand for more advanced surgical arms. A large number of global manufacturers are emphasizing on the development and manufacture of novel equipment so that the surgeons can carry out the surgical process more effectively and smoothly. Demand for mini C-arms devices is rising due to features such as small size, lower price as compared to other types of C-arms, and easy maneuverability in the operation theater. Key players are focusing on the development of new C-arm devices with better efficacy. For instance, in 2018, Hologic, Inc. launched the Fluoroscan Insight FD Mini C-arm. The system offers a variety of improved imaging features with low-dose rate modes and more flexible transport facility. These key developments are likely to augment the global surgical imaging arms market in the near future. However, high price of surgical imaging arms and technical errors of these devices are likely to restrain the global surgical imaging arms during the forecast period.
The global surgical imaging arms market has been segmented based on product, application, end-user, and region. In terms of product, the C-arm surgical imaging devices segment is projected to dominate the market. However, the segment is expected to lose market share during the forecast period, due to fewer opportunities for new entrants in the segment and the availability of more advanced devices in the market, such as the G-arm. In terms of application, the orthopedic segment is projected to expand rapidly at a notable CAGR during the forecast period. Demand for minimally invasive surgeries among orthopedic diseases patients for rapid recovery and high incidence of orthopedic disorders among the increasing geriatric population are fueling the segment. Based on end-user, the hospitals & ambulatory surgical centers segment led the market, in terms of revenue, in 2017. It is anticipated to maintain its dominance of the market during the forecast period.
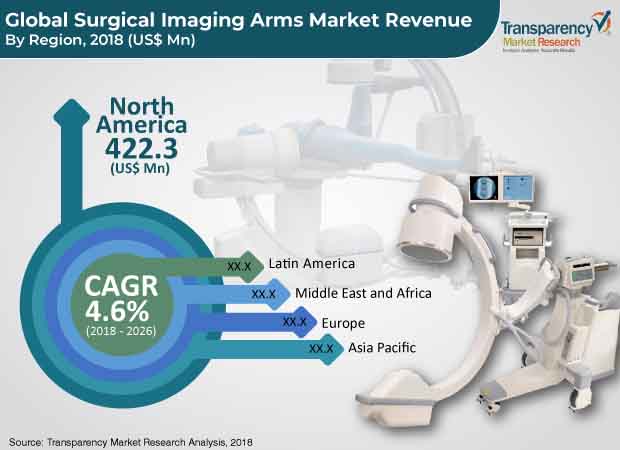
In terms of region, North America held a major share of the global surgical imaging arms market in 2017. Robust healthcare infrastructure and rise in number of surgeries are propelling the market in North America. In terms of revenue, the market in Asia Pacific is projected to expand at a rapid pace during the forecast period, due to a rise in the number of surgeries in such a huge population. Rise in hospitals in countries such as Saudi Arabia and Qatar, and increase in government investment in the healthcare system in countries such as Colombia, Mexico, and South Africa are likely to boost the market in Latin America and Middle East & Africa.
Key companies operating in the global surgical imaging arms market that are profiled in the report include GE Healthcare, Medtronic, Koninklijke Philips N.V., Canon Medical Systems Corporation, Siemens Healthineers AG, Shimadzu Corporation, Whale Imaging Inc., Hologic, Inc., and ATON GmbH. These players are adopting organic and inorganic growth strategies to expand their product offerings, strengthen their geographical reach, increase customer base, and gain market share. For instance, in May 2015, Ziehm Imaging Inc. a Germany-based company, acquired Ortho Scan Inc., a U.S.-based mini C-arm manufacturer to expand its C-arms product portfolio and geographic presence.
Surgical Imaging Arms Market to Gain Attractive Revenues from Rising Number of Medical Procedures
Careful imaging arms are gadgets that are profoundly fundamental for fulfill the rising need for negligibly intrusive methodology and thus, they have become a significant instrument in medical services offices like medical clinics, centers, and in research organizations. Ascend in the quantity of interventional radiology systems, popularity for negligibly obtrusive medical procedures, and complexity of muscular medical procedures with customary hardware are key factors that are expected to push the careful imaging arms market in the coming years.
Ascend in geriatric populace that prompts expansion in number of medical procedures, which are caused because of extreme illnesses and performed at medical clinics and facilities, and ascend in the quantity of emergency clinics are probably going to support the careful imaging arms market. Rising globalization prompts the flare-up of a few sicknesses, and some of them require a medical procedure.
This expanding number of medical procedures is energizing the interest for further developed careful arms. Countless worldwide producers are accentuating on the turn of events and production of novel gear with the goal that the specialists can do the careful interaction all the more successfully and easily. Interest for smaller than usual C-arms gadgets is ascending because of highlights like little size, lower cost when contrasted with different kinds of C-arms, and simple mobility in the activity theater. Vital participants are zeroing in on the advancement of new C-arm gadgets with better viability. The framework offers an assortment of improved imaging highlights with low-portion rate modes and more adaptable vehicle office. These key advancements are probably going to expand the worldwide careful imaging arms market sooner rather than later. Notwithstanding, excessive cost of careful imaging arms and specialized mistakes of these gadgets are probably going to limit the worldwide careful imaging arms during the estimate time frame.
Chapter 1. Preface
1.1. Market Definition and Scope
1.2. Market Segmentation
1.3. Key Research Objectives
1.4. Research Highlights
Chapter 2. Assumptions and Research Methodology
Chapter 3. Executive Summary: Global Surgical Imaging Arms Market
Chapter 4. Market Overview
4.1. Introduction
4.1.1. Product Overview
4.2. Market Dynamics
4.2.1. Drivers
4.2.2. Restraints
4.2.3. Opportunities
4.3. Global Surgical Imaging Arms Market Analysis and Forecast, 2016–2026
4.3.1. Global Surgical Imaging Arms Market Revenue Projection (US$ Mn)
Chapter 5. Market Outlook
5.1. Technological Advancement
5.2. Pricing Analysis by Product
5.3. Key Merger & Acquisition
Chapter 6. Global Surgical Imaging Arms Market Analysis and Forecast, by Product
6.1. Key Findings/Developments
6.2. Introduction & Definition
6.3. Global Surgical Imaging Arms Market Value Forecast, by Product, 2017–2026
6.3.1. C-arm Surgical Imaging Devices
6.3.1.1. Full-size C-arm
6.3.1.2. Mini C-arm
6.3.1.3. Compact C-arm
6.3.2. O-arm Surgical Imaging Devices
6.3.3. G-arm Surgical Imaging Devices
6.4. Market Attractiveness, by Product
Chapter 7. Global Surgical Imaging Arms Market Analysis and Forecast, by Application
7.1. Key Findings/Developments
7.2. Introduction & Definition
7.3. Global Surgical Imaging Arms Market Value Forecast, by Application, 2017–2026
7.3.1. Orthopedic
7.3.2. Cardiovascular
7.3.3. Pain Management
7.3.4. Urology
7.3.5. Others
7.4. Global Surgical Imaging Arms Market Attractiveness, by Application
Chapter 8. Global Surgical Imaging Arms Market Analysis and Forecast, by End-user
8.1. Key Findings/Developments
8.2. Introduction & Definition
8.3. Global Surgical Imaging Arms Market Value Forecast, by End-user, 2017–2026
8.3.1. Hospitals & Ambulatory Surgical Centers
8.3.2. Academic & Research Institutes
8.3.3. Others
8.4. Global Surgical Imaging Arms Market Attractiveness, by End-user
Chapter 9. Global Surgical Imaging Arms Market Analysis and Forecast, by Region
9.1. Geographical Representation
9.2. Global Surgical Imaging Arms Market Value Forecast, by Region
9.2.1. North America
9.2.2. Europe
9.2.3. Asia Pacific
9.2.4. Latin America
9.2.5. Middle East & Africa
9.3. Global Surgical Imaging Arms Market Attractiveness, by Region
Chapter 10. North America Surgical Imaging Arms Market Analysis and Forecast
10.1. North America Surgical Imaging Arms Market Value Forecast, by Country, 2017–2026
10.1.1. U.S.
10.1.2. Canada
10.2. North America Surgical Imaging Arms Market Value Share Analysis, by Product, 2017–2026
10.3. North America Surgical Imaging Arms Market Value Forecast, by Product, 2016–2026
10.3.1. C-arm Surgical Imaging Devices
10.3.1.1. Full-size C-arm
10.3.1.2. Mini C-arm
10.3.1.3. Compact C-arm
10.3.2. O-arm Surgical Imaging Devices
10.3.3. G-arm Surgical Imaging Devices
10.4. North America Surgical Imaging Arms Market Value Share Analysis, by Application, 2017–2026
10.5. North America Surgical Imaging Arms Market Value Forecast, by Application, 2016–2026
10.5.1. Orthopedic
10.5.2. Cardiovascular
10.5.3. Pain Management
10.5.4. Urology
10.5.5. Others
10.6. North America Surgical Imaging Arms Market Value Share Analysis, by End-user, 2017–2026
10.7. North America Surgical Imaging Arms Market Value Forecast, by End-user, 2016–2026
10.7.1. Hospitals & Ambulatory Surgical Centers
10.7.2. Academic & Research Institutes
10.7.3. Others
10.8. North America Surgical Imaging Arms Market Attractiveness Analysis
10.8.1. By Country
10.8.2. By Product
10.8.3. By Application
10.8.4. By End-user
Chapter 11. Europe Surgical Imaging Arms Market Analysis and Forecast
11.1. Europe Surgical Imaging Arms Market Value Forecast, by Country/Sub-region, 2017–2026
11.1.1. Germany
11.1.2. France
11.1.3. U.K.
11.1.4. Spain
11.1.5. Italy
11.1.6. Rest of Europe
11.2. Europe Surgical Imaging Arms Market Value Share Analysis, by Product, 2017–2026
11.3. Europe Surgical Imaging Arms Market Value Forecast, by Product, 2016–2026
11.3.1. C-arm Surgical Imaging Devices
11.3.1.1. Full-size C-arm
11.3.1.2. Mini C-arm
11.3.1.3. Compact C-arm
11.3.2. O-arm Surgical Imaging Devices
11.3.3. G-arm Surgical Imaging Devices
11.4. Europe Surgical Imaging Arms Market Value Share Analysis, by Application, 2017–2026
11.5. Europe Surgical Imaging Arms Market Value Forecast, by Application, 2016–2026
11.5.1. Orthopedic
11.5.2. Cardiovascular
11.5.3. Pain Management
11.5.4. Urology
11.5.5. Others
11.6. Europe Surgical Imaging Arms Market Value Share Analysis, by End-user, 2017–2026
11.7. Europe Surgical Imaging Arms Market Value Forecast, by End-user, 2016-2026
11.7.1. Hospitals & Ambulatory Surgical Centers
11.7.2. Academic & Research Institutes
11.7.3. Others
11.8. Europe Surgical Imaging Arms Market Attractiveness Analysis
11.8.1. By Country/Sub-region
11.8.2. By Product
11.8.3. By Application
11.8.4. By End-user
Chapter 12. Asia Pacific Surgical Imaging Arms Market Analysis and Forecast
12.1. Asia Pacific Surgical Imaging Arms Market Value Forecast, by Country/Sub-regions, 2017–2026
12.1.1. China
12.1.2. Japan
12.1.3. India
12.1.4. Australia & New Zealand
12.1.5. Rest of Asia Pacific
12.2. Asia Pacific Surgical Imaging Arms Market Value Share Analysis, by Product, 2017–2026
12.3. Asia Pacific Surgical Imaging Arms Market Value Forecast, by Product, 2016–2026
12.3.1. C-arm Surgical Imaging Devices
12.3.1.1. Full-size C-arm
12.3.1.2. Mini C-arm
12.3.1.3. Compact C-arm
12.3.2. O-arm Surgical Imaging Devices
12.3.3. G-arm Surgical Imaging Devices
12.4. Asia Pacific Surgical Imaging Arms Market Value Share Analysis, by Application, 2017–2026
12.5. Asia Pacific Surgical Imaging Arms Market Value Forecast, by Application, 2016–2026
12.5.1. Orthopedic
12.5.2. Cardiovascular
12.5.3. Pain Management
12.5.4. Urology
12.5.5. Others
12.6. Asia Pacific Surgical Imaging Arms Market Value Share Analysis, by End-user, 2017–2026
12.7. Asia Pacific Surgical Imaging Arms Market Value Forecast, by End-user, 2016–2026
12.7.1. Hospitals & Ambulatory Surgical Centers
12.7.2. Academic & Research Institutes
12.7.3. Others
12.8. Asia Pacific Surgical Imaging Arms Market Attractiveness Analysis
12.8.1. By Country/Sub-region
12.8.2. By Product
12.8.3. By Application
12.8.4. By End-user
Chapter 13. Latin America Surgical Imaging Arms Market Analysis and Forecast
13.1. Latin America Surgical Imaging Arms Market Value Forecast, by Country/Sub-region, 2017–2026
13.1.1. Brazil
13.1.2. Mexico
13.1.3. Rest of Latin America
13.2. Latin America Surgical Imaging Arms Market Value Share Analysis, by Product, 2017–2026
13.3. Latin America Surgical Imaging Arms Market Value Forecast, by Product, 2016–2026
13.3.1. C-arm Surgical Imaging Devices
13.3.1.1. Full-size C-arm
13.3.1.2. Mini C-arm
13.3.1.3. Compact C-arm
13.3.2. O-arm Surgical Imaging Devices
13.3.3. G-arm Surgical Imaging Devices
13.4. Latin America Surgical Imaging Arms Market Value Share Analysis, by Application, 2017–2026
13.5. Latin America Surgical Imaging Arms Market Value Forecast, by Application, 2016–2026
13.5.1. Orthopedic
13.5.2. Cardiovascular
13.5.3. Pain Management
13.5.4. Urology
13.5.5. Others
13.6. Latin America Surgical Imaging Arms Market Value Share Analysis, by End-user, 2017–2026
13.7. Latin America Surgical Imaging Arms Market Value Forecast, by End-user, 2016–2026
13.7.1. Hospitals & Ambulatory Surgical Centers
13.7.2. Academic & Research Institutes
13.7.3. Others
13.8. Latin America Surgical Imaging Arms Market Attractiveness Analysis
13.8.1. By Country/Sub-region
13.8.2. By Product
13.8.3. By Application
13.8.4. By End-user
Chapter 14. Middle East & Africa Surgical Imaging Arms Market Analysis and Forecast
14.1. Middle East & Africa Surgical Imaging Arms Market Value Forecast, by Country/Sub-regions, 2017–2026
14.1.1. GCC Countries
14.1.2. South Africa
14.1.3. Israel
14.1.4. Rest of Middle East & Africa
14.2. Middle East & Africa Surgical Imaging Arms Market Value Share Analysis, by Product, 2017–2026
14.3. Middle East & Africa Surgical Imaging Arms Market Value Forecast, by Product, 2016–2026
14.3.1. C-arm Surgical Imaging Devices
14.3.1.1. Full-size C-arm
14.3.1.2. Mini C-arm
14.3.1.3. Compact C-arm
14.3.2. O-arm Surgical Imaging Devices
14.3.3. G-arm Surgical Imaging Devices
14.4. Middle East & Africa Surgical Imaging Arms Market Value Share Analysis, by Application, 2017–2026
14.5. Middle East & Africa Surgical Imaging Arms Market Value Forecast, by Application, 2016–2026
14.5.1. Orthopedic
14.5.2. Cardiovascular
14.5.3. Pain Management
14.5.4. Urology
14.5.5. Others
14.6. Middle East & Africa Surgical Imaging Arms Market Value Share Analysis, by End-user, 2017–2026
14.7. Middle East & Africa Surgical Imaging Arms Market Value Forecast, by End-user, 2016–2026
14.7.1. Hospitals & Ambulatory Surgical Centers
14.7.2. Academic & Research Institutes
14.7.3. Others
14.8. Middle East & Africa Surgical Imaging Arms Market Attractiveness Analysis
14.8.1. By Country/Sub-region
14.8.2. By Product
14.8.3. By Application
14.8.4. By End-user
Chapter 15. Competition Landscape
15.1. Competition Matrix
15.1.1. GE Healthcare
15.1.2. Whale Imaging Inc.
15.2. Company Profiles (Details – Overview, Financials, Recent Developments, Strategy)
15.2.1. Medtronic (HQ, Business Segments, Employee Strength)
15.2.1.1. Company Details
15.2.1.2. Company Description
15.2.1.3. Business Overview
15.2.1.4. SWOT Analysis
15.2.1.5. Financial Analysis
15.2.1.6. Strategic Overview
15.2.2. GE Healthcare (HQ, Business Segments, Employee Strength)
15.2.2.1. Company Details
15.2.2.2. Company Description
15.2.2.3. Business Overview
15.2.2.4. SWOT Analysis
15.2.2.5. Strategic Overview
15.2.3. Hologic Inc. (HQ, Business Segments, Employee Strength)
15.2.3.1. Company Details
15.2.3.2. Company Description
15.2.3.3. Business Overview
15.2.3.4. SWOT Analysis
15.2.3.5. Strategic Overview
15.2.4. Koninklijke Philips N.V. (HQ, Business Segments, Employee Strength)
15.2.4.1. Company Details
15.2.4.2. Company Description
15.2.4.3. Business Overview
15.2.4.4. SWOT Analysis
15.2.4.5. Strategic Overview
15.2.5. Siemens Healthineers AG (HQ, Business Segments, Employee Strength)
15.2.5.1. Company Details
15.2.5.2. Company Description
15.2.5.3. Business Overview
15.2.5.4. SWOT Analysis
15.2.5.5. Financial Analysis
15.2.5.6. Strategic Overview
15.2.6. Canon Medical System Corporation (HQ, Business Segments, Employee Strength)
15.2.6.1. Company Details
15.2.6.2. Company Description
15.2.6.3. Business Overview
15.2.6.4. SWOT Analysis
15.2.6.5. Financial Analysis
15.2.6.6. Strategic Overview
15.2.7. Shimadzu Corporation (HQ, Business Segments, Employee Strength)
15.2.7.1. Company Details
15.2.7.2. Company Description
15.2.7.3. Business Overview
15.2.7.4. SWOT Analysis
15.2.7.5. Financial Analysis
15.2.7.6. Strategic Overview
15.2.8. Whale Imaging Inc. (HQ, Business Segments, Employee Strength)
15.2.8.1. Company Details
15.2.8.2. Company Description
15.2.8.3. Business Overview
15.2.8.4. SWOT Analysis
15.2.8.5. Financial Analysis
15.2.8.6. Strategic Overview
15.2.9. ATON GmbH (HQ, Business Segments, Employee Strength)
15.2.9.1. Company Details
15.2.9.2. Company Description
15.2.9.3. Business Overview
15.2.9.4. SWOT Analysis
15.2.9.5. Strategic Overview
List of Tables
Table 01: Global Surgical Imaging Arms Market Value (US$ Mn) Forecast, by Product, 2016–2026
Table 02: Global Surgical Imaging Arms Market Value (US$ Mn) Forecast, by C-arms, 2016–2026
Table 03: Global Surgical Imaging Arms Market Value (US$ Mn) Forecast, by Application, 2016–2026
Table 04: Global Surgical Imaging Arms Market Value (US$ Mn) Forecast, by End-user, 2016–2026
Table 05: Global Surgical Imaging Arms Market Value (US$ Mn) Forecast, by Region, 2016–2026
Table 06: North America Surgical Imaging Arms Market Value (US$ Mn) Forecast, by Country, 2016–2026
Table 07: North America Surgical Imaging Arms Market Value (US$ Mn) Forecast, by Product, 2016–2026
Table 08: North America Surgical Imaging Arms Market Value (US$ Mn) Forecast, by Product (C-arms) 2016–2026
Table 09: North America Surgical Imaging Arms Market Value (US$ Mn) Forecast, by Application, 2016–2026
Table 10: North America Surgical Imaging Arms Market Value (US$ Mn) Forecast, by End-user, 2016–2026
Table 11: Europe Surgical Imaging Arms Market Value (US$ Mn) Forecast, by Country/Sub-region, 2016–2026
Table 12: Europe Surgical Imaging Arms Market Value (US$ Mn) Forecast, by Product, 2016–2026
Table 13: Europe Surgical Imaging Arms Market Value (US$ Mn) Forecast, by Product, (C-arms) 2016–2026
Table 14: Europe Surgical Imaging Arms Market Value (US$ Mn) Forecast, by Application, 2016–2026
Table 15: Europe Surgical Imaging Arms Market Value (US$ Mn) Forecast, by End-user, 2016–2026
Table 16: Asia Pacific Surgical Imaging Arms Market Value (US$ Mn) Forecast, by Country/Sub-region, 2016–2026
Table 17: Asia Pacific Surgical Imaging Arms Market Value (US$ Mn) Forecast, by Product, 2016–2026
Table 18: Asia Pacific Surgical Imaging Arms Market Value (US$ Mn) Forecast, by Product, (C-arms) 2016–2026
Table 19: Asia Pacific Surgical Imaging Arms Market Value (US$ Mn) Forecast, by Application, 2016–2026
Table 20: Asia Pacific Surgical Imaging Arms Market Value (US$ Mn) Forecast, by End-user, 2016–2026
Table 21: Latin America Surgical Imaging Arms Market Value (US$ Mn) Forecast, by Country/Sub-region, 2016–2026
Table 22: Latin America Surgical Imaging Arms Market Value (US$ Mn) Forecast, by Product, 2016–2026
Table 23: Latin America Surgical Imaging Arms Market Value (US$ Mn) Forecast, by Product, (C-arms Surgical Imaging Devices) 2016–2026
Table 24: Latin America Surgical Imaging Arms Market Value (US$ Mn) Forecast, by Application, 2016–2026
Table 25: Latin America Surgical Imaging Arms Market Value (US$ Mn) Forecast, by End-user, 2016–2026
Table 26: Middle East & Africa Surgical Imaging Arms Market Value (US$ Mn) Forecast, by Country/Sub-region, 2016–2026
Table 27: Middle East & Africa Surgical Imaging Arms Market Value (US$ Mn) Forecast, by Product, 2016–2026
Table 28: Middle East & Africa Surgical Imaging Arms Market Value (US$ Mn) Forecast, by Product, (C-arms) 2016–2026
Table 29: Middle East & Africa Surgical Imaging Arms Market Value (US$ Mn) Forecast, by Application, 2016–2026
Table 30: Middle East & Africa Surgical Imaging Arms Market Value (US$ Mn) Forecast, by End-user, 2016–2026
List of Figures
Figure 01: Global Surgical Imaging Arms Market Size (US$ Mn) and Distribution, by Region, 2018 and 2026
Figure 02: Global Surgical Imaging Arms Market Snapshot of Global Surgical Imaging Arms Market
Figure 03: Global Surgical Imaging Arms Market Opportunity Map, Revenue Share, by Product
Figure 04: Global Surgical Imaging Arms Market Opportunity Map, Revenue Share, by Application
Figure 05: Global Surgical Imaging Arms Market Opportunity Map, Revenue Share, by End user
Figure 06: Global Surgical Imaging Arms Market Value (US$ Mn) Forecast and Y-o-Y Growth (%) Projection, 2016–2026
Figure 07: Global Surgical Imaging Arms Market Value Share, by Product (2017)
Figure 08: Global Surgical Imaging Arms Market Value Share, by Application (2017)
Figure 09: Global Surgical Imaging Arms Market Value Share, by End-user (2017)
Figure 10: Global Surgical Imaging Arms Market Value Share Analysis, by Product, 2018 and 2026
Figure 11: Global Surgical Imaging Arms Market Value (US$ Mn) Forecast and Y-o-Y Growth (%) Projection, by C-arms, 2016–2026
Figure 12: Global Surgical Imaging Arms Market Value (US$ Mn) Forecast and Y-o-Y Growth (%) Projection, by O-arms, 2016–2026
Figure 13: Global Surgical Imaging Arms Market Value (US$ Mn) Forecast and Y-o-Y Growth (%) Projection, by G-arms, 2016–2026
Figure 14: Global Surgical Imaging Arms Market Attractiveness, by Product, 2018–2026
Figure 15: Global Surgical Imaging Arms Market Value Share Analysis, by Application, 2017 and 2026
Figure 16: Global Surgical Imaging Arms Market Value (US$ Mn) Forecast and Y-o-Y Growth (%) Projection, by Orthopedic, 2016–2026
Figure 17: Global Surgical Imaging Arms Market Value (US$ Mn) Forecast and Y-o-Y Growth (%) Projection, by Cardiovascular, 2016–2026
Figure 18: Global Surgical Imaging Arms Market Value (US$ Mn) Forecast and Y-o-Y Growth (%) Projection, by Pain Management, 2016–2026
Figure 19: Global Surgical Imaging Arms Market Value (US$ Mn) Forecast and Y-o-Y Growth (%) Projection, by Urology, 2016–2026
Figure 20: Global Surgical Imaging Arms Market Value (US$ Mn) Forecast and Y-o-Y Growth (%) Projection, by Others, 2016–2026
Figure 21: Global Surgical Imaging Arms Market Attractiveness, by Application, 2018–2026
Figure 22: Global Surgical Imaging Arms Market Value Share Analysis, by End-user, 2017 and 2026
Figure 23: Global Surgical Imaging Arms Market Value (US$ Mn) Forecast and Y-o-Y Growth (%) Projection, by Hospitals & Ambulatory Surgical Centers 2016–2026
Figure 24: Global Surgical Imaging Arms Market Value (US$ Mn) Forecast and Y-o-Y Growth (%) Projection, by Academic & Research Institutes, 2016–2026
Figure 25: Global Surgical Imaging Arms Market Value (US$ Mn) Forecast and Y-o-Y Growth (%) Projection, by Others, 2016–2026
Figure 26: Global Surgical Imaging Arms Market Attractiveness, by End-user, 2018–2026
Figure 27: Global Surgical Imaging Arms Market Value Share (%), by Region, 2018 and 2026
Figure 28: Global Surgical Imaging Arms Market Attractiveness, by Region, 2018–2026
Figure 29: North America Surgical Imaging Arms Market Value (US$ Mn) Forecast and Y-o-Y Growth Projection (%), 2016–2026
Figure 30: North America Surgical Imaging Arms Market Value Share, by Country, 2017 and 2026
Figure 31: North America Surgical Imaging Arms Market Attractiveness, by Country, 2017–2026
Figure 32: North America Surgical Imaging Arms Market Value Share, by Product, 2017 and 2026
Figure 33: North America Surgical Imaging Arms Market Attractiveness, by Product, 2017–2026
Figure 34: North America Surgical Imaging Arms Market Value Share, by Application, 2017 and 2026
Figure 35: North America Surgical Imaging Arms Market Attractiveness, by Application, 2017–2026
Figure 36: North America Surgical Imaging Arms Market Value Share, by End-user, 2017 and 2026
Figure 37: North America Surgical Imaging Arms Market Attractiveness, by End-user, 2017–2026
Figure 38: Europe Surgical Imaging Arms Market Value (US$ Mn) Forecast and Y-o-Y Growth Projection (%), 2016–2026
Figure 39: Europe Surgical Imaging Arms Market Value Share, by Country/Sub-region, 2017 and 2026
Figure 40: Europe Surgical Imaging Arms Market Attractiveness, by Country/Sub-region, 2017–2026
Figure 41: Europe Surgical Imaging Arms Market Value Share, by Product, 2017 and 2026
Figure 42: Europe Surgical Imaging Arms Market Attractiveness, by Product, 2017–2026
Figure 43: Europe Surgical Imaging Arms Market Value Share, by Application, 2017 and 2026
Figure 44: Europe Surgical Imaging Arms Market Attractiveness, by Application, 2017–2026
Figure 45: Europe Surgical Imaging Arms Market Value Share, by End-user, 2017 and 2026
Figure 46: Europe Surgical Imaging Arms Market Attractiveness, by End-user, 2017–2026
Figure 47: Asia Pacific Surgical Imaging Arms Market Value (US$ Mn) Forecast and Y-o-Y Growth Projection (%), 2016–2026
Figure 48: Asia Pacific Surgical Imaging Arms Market Value Share, by Country/Sub-region, 2017 and 2026
Figure 49: Asia Pacific Surgical Imaging Arms Market Attractiveness, by Country/Sub-region, 2017–2026
Figure 50: Asia Pacific Surgical Imaging Arms Market Value Share, by Product, 2017 and 2026
Figure 51: Asia Pacific Surgical Imaging Arms Market Attractiveness, by Product, 2017–2026
Figure 52: Asia Pacific Surgical Imaging Arms Market Value Share, by Application, 2017 and 2026
Figure 53: Asia Pacific Surgical Imaging Arms Market Attractiveness, by Application, 2017–2026
Figure 54: Asia Pacific Surgical Imaging Arms Market Value Share, by End-user, 2017 and 2026
Figure 55: Asia Pacific Surgical Imaging Arms Market Attractiveness, by End-user, 2017–2026
Figure 56: Latin America Surgical Imaging Arms Market Value (US$ Mn) Forecast and Y-o-Y Growth Projection (%), 2016–2026
Figure 57: Latin America Surgical Imaging Arms Market Value Share, by Country/Sub-region, 2017 and 2026
Figure 58: Latin America Surgical Imaging Arms Market Attractiveness, by Country/Sub-region, 2017–2026
Figure 59: Latin America Surgical Imaging Arms Market Value Share, by Product, 2017 and 2026
Figure 60: Latin America Surgical Imaging Arms Market Attractiveness, by Product, 2017–2026
Figure 61: Latin America Surgical Imaging Arms Market Value Share, by Application, 2017 and 2026
Figure 62: Latin America Surgical Imaging Arms Market Attractiveness, by Application, 2017–2026
Figure 63: Latin America Surgical Imaging Arms Market Value Share, by End-user, 2017 and 2026
Figure 64: Latin America Surgical Imaging Arms Market Attractiveness, by End-user, 2017–2026
Figure 65: Middle East & Africa Surgical Imaging Arms Market Value (US$ Mn) Forecast and Y-o-Y Growth Projection (%), 2016–2026
Figure 66: Middle East & Africa Surgical Imaging Arms Market Value Share, by Country/Sub-region, 2017 and 2026
Figure 67: Middle East & Africa Surgical Imaging Arms Market Attractiveness, by Country/Sub-region, 2017–2026
Figure 68: Middle East & Africa Surgical Imaging Arms Market Value Share, by Product, 2017 and 2026
Figure 69: Middle East & Africa Surgical Imaging Arms Market Attractiveness, by Product, 2017–2026
Figure 70: Middle East & Africa Surgical Imaging Arms Market Value Share, by Application, 2017 and 2026
Figure 71: Middle East & Africa Surgical Imaging Arms Market Attractiveness, by Application, 2017–2026
Figure 72: Middle East & Africa Surgical Imaging Arms Market Value Share, by End-user, 2017 and 2026
Figure 73: Middle East & Africa Surgical Imaging Arms Market Attractiveness, by End-user, 2018–2026
Copyright © Transparency Market Research, Inc. All Rights reserved
Trust Online

Surgical Imaging Arms Market