
Reports
Reports
The healthcare sector worldwide continues to embrace new medical treatments, therapies, and drugs. At present, cardiovascular diseases are considered to be the leading causes of death worldwide due to which, research and development activities pertaining to the treatment of an array of cardiovascular diseases have gained considerable momentum. Although international guidelines advocate the adoption of statins, aspirin, and pressure-lowering therapy for individuals with a history of cardiovascular condition, the adoption of these medications is relatively low. Multiple clinical trials have revealed that the combination of these medications with a polypill product is likely to improve systolic blood pressure, adherence, and low-density lipoprotein cholesterol.
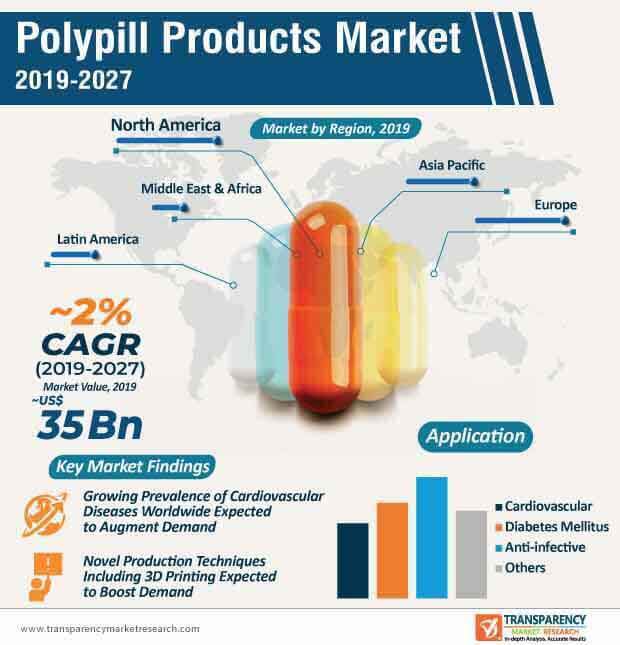
Although the demand for polypill products is expected to witness steady growth during the forecast period, mounting safety concerns surrounding the use of polypill products could hamper its adoption. Research and development activities within the polypill products market are largely focused on minimizing the side effects and investigating the consequences of non-adherence to polypill products in comparison with individual medication. Thus, due to a surge in the prevalence of chronic diseases across the world, the demand for polypill products is projected to witness notable growth in the coming years. At the back of these factors, the global polypill products market is expected to reach market value of ~US$ 35 Bn by the end of 2027.
High cholesterol and high blood pressure are some of the leading causes of cardiovascular deaths worldwide. Although there are treatments and medications available to address these conditions, they are left undertreated particularly in the underdeveloped and developing regions. The lack of adequate prescription and poor medication adherence are some of the leading factors as to why high cholesterol and high blood pressure are undertreated across the world. One of the potential methods to enhance medication adherence that is currently being investigated is the combination of one or more medications into a polypill.
Some of the major factors that are likely to boost the adoption of polypill products during the forecast period include lower dosage of different medications, which, in turn are projected to reduce the side effects. In addition, players operating in the current polypill products market are expected to advertise polypill products as an easy to remember medication and convenience as the USP to improve their sales. In addition, polypill products have also emerged as a cost-effective medication alternative and likely to replace therapies that require multiple medications.
Despite factors that are likely to increase the demand for polypill products in the coming years, the potential side-effects, overtreatment, undesirable interaction of different medication, and low dosing flexibility are some of the factors that could hinder the demand.
Novel technologies such as 3D printing have played a key role in revolutionizing manufacturing processes in various industries, including automotive, aerospace, and dental. The narrative stands true within the healthcare sector wherein 3D printing is gradually making its mark. Most recently, 3D printing is increasingly being used to develop personalized drugs with improved reliability. The exceptional capability of 3D printing to develop medication with high degree of precision particularly in tune with the requirement of patients is expected to increase the adoption of 3D printing in the polypill products market. Several pharmaceutical companies are inclined toward adopting 3D printing medicines with different drug compounds such as polypills. The growing awareness regarding the benefits of 3D printed medicines is likely to influence the demand for 3D printed polypill products in the coming years.
While new technologies continue to make inroads in the healthcare sector, research and development activities will continue to accelerate the development of new polypill products. Several studies within the polypill products market aim toward the discovery of new polypill products and the potential benefits of the same. For instance, a recent study that is published in the New England Journal of Medicine reveals that polypill products have significant potential in lowering cholesterol and blood pressure among individuals suffering from cardiovascular problems.
Analysts’ Viewpoint
The global polypill products market is expected to grow at a sluggish CAGR of ~2% during the forecast period. Some of the leading factors that are expected to contribute to market growth include a high prevalence of cardiovascular diseases worldwide, gradual adoption of new technologies, including 3D printing to develop polypill products, lower medication cost compared to multiple medications, and research & development activities. Companies operating in the current market landscape should focus on research and development to improve the efficacy of polypill products and simultaneously lower the development costs. The advent of the 3D printing technology could open up new avenues for players in the polypill products market in the coming years.
Polypill products market is expected to reach valuation of ~US$ 35 Bn by the end of 2027
Polypill products market is projected to expand at a CAGR of ~2% from 2019 to 2027
Polypill products market is driven by rise in awareness about advanced therapeutics, and increase in patients with chronic diseases
North America accounted for major share of the global polypill products market and the trend is anticipated to continue during the forecast period
Key players in the global polypill products market include Pfizer, Inc., AstraZeneca, Merck & Co., Inc. (Merck Sharp & Dohme Corp.), Janssen Pharmaceuticals, Inc.(Johnson & Johnson), Dr. Reddy’s Laboratories Ltd.
1. Preface
1.1. Market Definition and Scope
1.2. Market Segmentation
1.3. Key Research Objectives
1.4. Research Highlights
2. Assumptions and Research Methodology
3. Executive Summary: Global Polypill Products Market
4. Market Overview
4.1. Introduction
4.1.1. Application/Definition
4.1.2. Industry Evolution / Developments
4.2. Overview
4.3. Market Dynamics
4.3.1. Drivers
4.3.2. Restraints
4.3.3. Opportunities
4.4. Global Polypill Products Market Analysis and Forecast, 2017–2027
5. Market Outlook
5.1. Epidemiology of Cardiovascular Diseases, Diabetes Mellitus and Infectious Diseases
5.2. Pipeline Analysis
5.3. Regulatory Scenario/Drug Approval Process, by Country/Sub-region
5.4. Technological Advancements
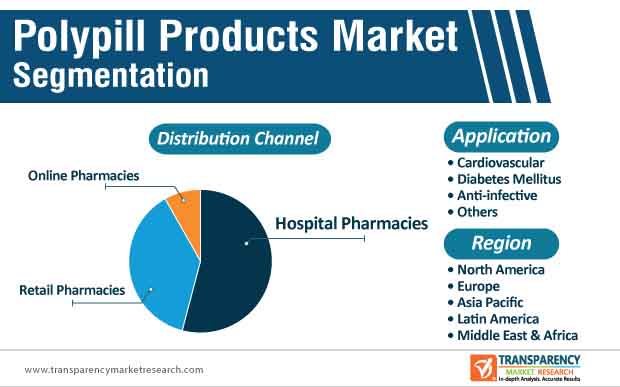
6. Global Polypill Products Market Analysis and Forecast, by Application
6.1. Introduction & Definition
6.2. Key Findings / Developments
6.3. Global Polypill Products Market Value Forecast, by Application, 2017–2027
6.3.1. Cardiovascular
6.3.2. Diabetes Mellitus
6.3.3. Anti-infective
6.3.4. Others
6.4. Global Polypill Products Market Attractiveness Analysis, by Application
7. Global Polypill Products Market Analysis and Forecast, by Distribution Channel
7.1. Introduction & Definition
7.2. Key Findings / Developments
7.3. Global Polypill Products Market Value Forecast, by Distribution Channel, 2017–2027
7.3.1. Hospital Pharmacies
7.3.2. Retail Pharmacies
7.3.3. Online Pharmacies
7.4. Global Polypill Products Market Attractiveness Analysis, by Distribution Channel
8. Global Polypill Products Market Analysis and Forecast, by Region
8.1. Key Findings
8.2. Global Polypill Products Market Value Forecast, by Region
8.2.1. North America
8.2.2. Europe
8.2.3. Asia Pacific
8.2.4. Latin America
8.2.5. Middle East & Africa
8.3. Global Polypill Products Market Attractiveness Analysis, by Region
9. North America Polypill Products Market Analysis and Forecast
9.1. Introduction
9.1.1. Key Findings
9.2. North America Polypill Products Market Value Forecast, by Application, 2017–2027
9.2.1. Cardiovascular
9.2.2. Diabetes Mellitus
9.2.3. Anti-infective
9.2.4. Others
9.3. North America Polypill Products Market Value Forecast, by Distribution Channel, 2017–2027
9.3.1. Hospital Pharmacies
9.3.2. Retail Pharmacies
9.3.3. Online Pharmacies
9.4. North America Polypill Products Market Value Forecast, by Country, 2017–2027
9.4.1. U.S.
9.4.2. Canada
9.5. North America Polypill Products Market Attractiveness Analysis
9.5.1. By Application
9.5.2. By Distribution Channel
9.5.3. By Country
10. Europe Polypill Products Market Analysis and Forecast
10.1. Introduction
10.1.1. Key Findings
10.2. Europe Polypill Products Market Value Forecast, by Application, 2017–2027
10.2.1. Cardiovascular
10.2.2. Diabetes Mellitus
10.2.3. Anti-infective
10.2.4. Others
10.3. Europe Polypill Products Market Value Forecast, by Distribution Channel, 2017–2027
10.3.1. Hospital Pharmacies
10.3.2. Retail Pharmacies
10.3.3. Online Pharmacies
10.4. Europe Polypill Products Market Value Forecast, by Country/Sub-region, 2017–2027
10.4.1. Germany
10.4.2. U.K.
10.4.3. France
10.4.4. Spain
10.4.5. Italy
10.4.6. Rest of Europe
10.5. Europe Polypill Products Market Attractiveness Analysis
10.5.1. By Application
10.5.2. By Distribution Channel
10.5.3. By Country/Sub-region
11. Asia Pacific Polypill Products Market Analysis and Forecast
11.1. Introduction
11.1.1. Key Findings
11.2. Asia Pacific Polypill Products Market Value Forecast, by Application, 2017–2027
11.2.1. Cardiovascular
11.2.2. Diabetes Mellitus
11.2.3. Anti-infective
11.2.4. Others
11.3. Asia Pacific Polypill Products Market Value Forecast, by Distribution Channel, 2017–2027
11.3.1. Hospital Pharmacies
11.3.2. Retail Pharmacies
11.3.3. Online Pharmacies
11.4. Asia Pacific Polypill Products Market Value Forecast, by Country/Sub-region, 2017–2027
11.4.1. China
11.4.2. Japan
11.4.3. India
11.4.4. Australia & New Zealand
11.4.5. Rest of Asia Pacific
11.5. Asia Pacific Polypill Products Market Attractiveness Analysis
11.5.1. By Application
11.5.2. By Distribution Channel
11.5.3. By Country/Sub-region
12. Latin America Polypill Products Market Analysis and Forecast
12.1. Introduction
12.1.1. Key Findings
12.2. Latin America Polypill Products Market Value Forecast, by Application, 2017–2027
12.2.1. Cardiovascular
12.2.2. Diabetes Mellitus
12.2.3. Anti-infective
12.2.4. Others
12.3. Latin America Polypill Products Market Value Forecast, by Distribution Channel, 2017–2027
12.3.1. Hospital Pharmacies
12.3.2. Retail Pharmacies
12.3.3. Online Pharmacies
12.4. Latin America Polypill Products Market Value Forecast, by Country/Sub-region, 2017–2027
12.4.1. Brazil
12.4.2. Mexico
12.4.3. Rest of Latin America
12.5. Latin America Polypill Products Market Attractiveness Analysis
12.5.1. By Application
12.5.2. By Distribution Channel
12.5.3. By Country/Sub-region
13. Middle East & Africa Polypill Products Market Analysis and Forecast
13.1. Introduction
13.1.1. Key Findings
13.2. Middle East & Africa Polypill Products Market Value Forecast, by Application, 2017–2027
13.2.1. Cardiovascular
13.2.2. Diabetes Mellitus
13.2.3. Anti-infective
13.2.4. Others
13.3. Middle East & Africa Polypill Products Market Value Forecast, by Distribution Channel, 2017–2027
13.3.1. Hospital Pharmacies
13.3.2. Retail Pharmacies
13.3.3. Online Pharmacies
13.4. Middle East & Africa Polypill Products Market Value Forecast, by Country/Sub-region, 2017–2027
13.4.1. GCC Countries
13.4.2. South Africa
13.4.3. Rest of Middle East & Africa
13.5. Middle East & Africa Polypill Products Market Attractiveness Analysis
13.5.1. By Application
13.5.2. By Distribution Channel
13.5.3. By Country/Sub-region
14. Competitive Landscape
14.1. Market Player - Competition Matrix (By Tier and Size of companies)
14.2. Market Share Analysis/Ranking, by Company, 2018
14.3. Company Profiles
14.3.1. Pfizer Inc.
14.3.1.1. Company Overview
14.3.1.2. Company Financials
14.3.1.3. Growth Strategies
14.3.1.4. SWOT Analysis
14.3.2. AstraZeneca
14.3.2.1. Company Overview
14.3.2.2. Company Financials
14.3.2.3. Growth Strategies
14.3.2.4. SWOT Analysis
14.3.3. Merck & Co., Inc. (Merck Sharp & Dohme Corp)
14.3.3.1. Company Overview
14.3.3.2. Company Financials
14.3.3.3. Growth Strategies
14.3.3.4. SWOT Analysis
14.3.4. Janssen Pharmaceuticals, Inc. (Johnson & Johnson)
14.3.4.1. Company Overview
14.3.4.2. Company Financials
14.3.4.3. Growth Strategies
14.3.4.4. SWOT Analysis
14.3.5. Dr. Reddy’s Laboratories Ltd.
14.3.5.1. Company Overview
14.3.5.2. Company Financials
14.3.5.3. Growth Strategies
14.3.5.4. SWOT Analysis
14.3.6. Cipla, Inc.
14.3.6.1. Company Overview
14.3.6.2. Company Financials
14.3.6.3. Growth Strategies
14.3.6.4. SWOT Analysis
14.3.7. Cadila Pharmaceuticals
14.3.7.1. Company Overview
14.3.7.2. Growth Strategies
14.3.7.3. SWOT Analysis
14.3.8. Grupo Ferrer International, S.A.
14.3.8.1. Company Overview
14.3.8.2. Growth Strategies
14.3.8.3. SWOT Analysis
14.3.9. Gebro Pharma GmbH
14.3.9.1. Company Overview
14.3.9.2. Growth Strategies
14.3.9.3. SWOT Analysis
14.3.10. Gilead Sciences, Inc.
14.3.10.1. Company Overview
14.3.10.2. Company Financials
14.3.10.3. Growth Strategies
14.3.10.4. SWOT Analysis
14.3.11. Takeda Pharmaceutical Company Limited
14.3.11.1. Company Overview
14.3.11.2. Company Financials
14.3.11.3. Growth Strategies
14.3.11.4. SWOT Analysis
List of Table
Table 01: Global Polypill Products Market Value (US$ Mn) Forecast, by Application, 2017–2027
Table 02: Global Polypill Products Market Value (US$ Mn) Forecast, by Distribution Channel, 2017–2027
Table 03: Global Polypill Products Market Value (US$ Mn) Forecast, by Region, 2017–2027
Table 04: North America Polypill Products Market Value (US$ Mn) Forecast, by Application, 2017–2027
Table 05: North America Polypill Products Market Value (US$ Mn) Forecast, by Distribution Channel, 2017–2027
Table 06: North America Polypill Products Market Value (US$ Mn) Forecast, by Country, 2017–2027
Table 07: Europe Polypill Products Market Value (US$ Mn) Forecast, by Application, 2017–2027
Table 08: Europe Polypill Products Market Value (US$ Mn) Forecast, by Distribution Channel, 2017–2027
Table 09: Europe Polypill Products Market Value (US$ Mn) Forecast, by Country/Sub-region, 2017–2027
Table 10: Asia Pacific Polypill Products Market Value (US$ Mn) Forecast, by Application, 2017–2027
Table 11: Asia Pacific Polypill Products Market Value (US$ Mn) Forecast, by Distribution Channel, 2017–2027
Table 12: Asia Pacific Polypill Products Market Value (US$ Mn) Forecast, by Country/Sub-region, 2017–2027
Table 13: Latin America Polypill Products Market Value (US$ Mn) Forecast, by Application, 2017–2027
Table 14: Latin America Polypill Products Market Value (US$ Mn) Forecast, by Distribution Channel, 2017–2027
Table 15: Latin America Polypill Products Market Value (US$ Mn) Forecast, by Country/Sub-region, 2017–2027
Table 16: Middle East & Africa Polypill Products Market Value (US$ Mn) Forecast, by Application, 2017–2027
Table 17: Middle East & Africa Polypill Products Market Value (US$ Mn) Forecast, by Distribution Channel, 2017–2027
Table 18: Middle East & Africa Polypill Products Market Value (US$ Mn) Forecast, by Country/Sub-region, 2017–2027
List of Figure
Figure 01: Global Polypill Products Market Value (US$ Mn) and Distribution (%), by Region, 2018 and 2027
Figure 02: Global Polypill Products Market Value (US$ Mn), by Application, 2018
Figure 03: Global Polypill Products Market Value Share Analysis, by Distribution Channel, 2018
Figure 04: Market Overview
Figure 05: Global Polypill Products Market Value Share, by Application, 2018
Figure 06: Global Polypill Products Market Value Share, by Distribution Channel, 2018
Figure 07: Global Polypill Products Market Value Share, by Region, 2018
Figure 08: Global Polypill Products Market Value (US$ Mn) and Y-o-Y Growth (%) Forecast, 2017–2027
Figure 09: Global Polypill Products Market Value Share Analysis, by Application, 2018 and 2027
Figure 10: Global Polypill Products Market Value (US$ Mn) and Y-o-Y Growth, by Cardiovascular, 2017–2027
Figure 11: Global Polypill Products Market Value (US$ Mn) and Y-o-Y Growth, by Diabetes Mellitus, 2017–2027
Figure 12: Global Polypill Products Market Value (US$ Mn) and Y-o-Y Growth, by Anti-infective, 2017–2027
Figure 13: Global Polypill Products Market Value (US$ Mn) and Y-o-Y Growth, by Others, 2017–2027
Figure 14: Global Polypill Products Market Attractiveness Analysis, by Application, 2019–2027
Figure 15: Global Polypill Products Market Value Share Analysis, by Distribution Channel, 2018 and 2027
Figure 16: Global Polypill Products Market Value (US$ Mn) and Y-o-Y Growth, by Hospital Pharmacies, 2017–2027
Figure 17: Global Polypill Products Market Value (US$ Mn) and Y-o-Y Growth, by Retail Pharmacies, 2017–2027
Figure 18: Global Polypill Products Market Value (US$ Mn) and Y-o-Y Growth, by Online Pharmacies, 2017–2027
Figure 19: Global Polypill Products Market Attractiveness Analysis, by Distribution Channel, 2019–2027
Figure 20: Global Polypill Products Market Value Share Analysis, by Region, 2018 and 2027
Figure 21: Global Polypill Products Market Attractiveness Analysis, by Region, 2019–2027
Figure 22: North America Polypill Products Market Value (US$ Mn) Forecast and Y-o-Y Growth (%) Projection, 2017–2027
Figure 23: North America Polypill Products Market Value Share Analysis, by Application, 2018 and 2027
Figure 24: North America Polypill Products Market Attractiveness Analysis, by Application, 2019–2027
Figure 25: North America Polypill Products Market Value Share Analysis, by Distribution Channel, 2018 and 2027
Figure 26: North America Polypill Products Market Attractiveness Analysis, by Distribution Channel, 2019 -2027
Figure 27: North America Polypill Products Market Value Share Analysis, by Country, 2018 and 2027
Figure 28: North America Polypill Products Market Attractiveness Analysis, by Country, 2019–2027
Figure 29: Europe Polypill Products Market Value (US$ Mn) Forecast and Y-o-Y Growth (%) Projection, 2017–2027
Figure 30: Europe Polypill Products Market Value Share Analysis, by Application, 2018 and 2027
Figure 31: Europe Polypill Products Market Attractiveness Analysis, by Application, 2019–2027
Figure 32: Europe Polypill Products Market Value Share Analysis, by Distribution Channel, 2018 and 2027
Figure 33: Europe Polypill Products Market Attractiveness Analysis, by Distribution Channel, 2019 -2027
Figure 34: Europe Polypill Products Market Value Share Analysis, by Country/Sub-region, 2018 and 2027
Figure 35: Europe Polypill Products Market Attractiveness Analysis, by Country/Sub-region, 2019–2027
Figure 36: Asia Pacific Polypill Products Market Value (US$ Mn) Forecast and Y-o-Y Growth (%) Projection, 2017–2027
Figure 37: Asia Pacific Polypill Products Market Value Share Analysis, by Application, 2018 and 2027
Figure 38: Asia Pacific Polypill Products Market Attractiveness Analysis, by Application, 2019–2027
Figure 39: Asia Pacific Polypill Products Market Value Share Analysis, by Distribution Channel, 2018 and 2027
Figure 40: Asia Pacific Polypill Products Market Attractiveness Analysis, by Distribution Channel, 2019 -2027
Figure 41: Asia Pacific Polypill Products Market Value Share Analysis, by Country/Sub-region, 2018 and 2027
Figure 42: Asia Pacific Polypill Products Market Attractiveness Analysis, by Country/Sub-region, 2019–2027
Figure 43: Latin America Polypill Products Market Value (US$ Mn) Forecast and Y-o-Y Growth (%) Projection, 2017–2027
Figure 44: Latin America Polypill Products Market Value Share Analysis, by Application, 2018 and 2027
Figure 45: Latin America Polypill Products Market Attractiveness Analysis, by Application, 2019–2027
Figure 46: Latin America Polypill Products Market Value Share Analysis, by Distribution Channel, 2018 and 2027
Figure 47: Latin America Polypill Products Market Attractiveness Analysis, by Distribution Channel, 2019 -2027
Figure 48: Latin America Polypill Products Market Value Share Analysis, by Country/Sub-region, 2018 and 2027
Figure 49: Latin America Polypill Products Market Attractiveness Analysis, by Country/Sub-region, 2019–2027
Figure 50: Middle East & Africa Polypill Products Market Value (US$ Mn) Forecast and Y-o-Y Growth (%) Projection, 2017–2027
Figure 51: Middle East & Africa Polypill Products Market Value Share Analysis, by Application, 2018 and 2027
Figure 52: Middle East & Africa Polypill Products Market Attractiveness Analysis, by Application, 2019–2027
Figure 53: Middle East & Africa Polypill Products Market Value Share Analysis, by Distribution Channel, 2018 and 2027
Figure 54: Middle East & Africa Polypill Products Market Attractiveness Analysis, by Distribution Channel, 2019 -2027
Figure 55: Middle East & Africa Polypill Products Market Value Share Analysis, by Country/Sub-region, 2018 and 2027
Figure 56: Middle East & Africa Polypill Products Market Attractiveness Analysis, by Country/Sub-region, 2019–2027
Figure 57: Market Position Analysis, 2018, by Tier and Size of the Company
Figure 58: Pfizer, Inc. Revenue (US$ Mn) and Y-o-Y Growth (%), 2015–2018
Figure 59: Pfizer, Inc. Breakdown of Net Sales, by Geography, 2018
Figure 60: Pfizer, Inc. Breakdown of Net Sales, by Business Segments (%), 2018
Figure 61: Pfizer, Inc. R&D Expenses (US$ Mn) and Y-o-Y Growth (%), 2015–2018
Figure 62: AstraZeneca Revenue (US$ Mn) and Y-o-Y Growth (%), 2016–2018
Figure 63: AstraZeneca Breakdown of Net Sales (%), by Geography, 2018
Figure 64: AstraZeneca R&D Expenses (US$ Mn) and Y-o-Y Growth (%), 2016–2018
Figure 65: AstraZeneca Respiratory Segment Revenue (US$ Mn) and Y-o-Y Growth (%), 2016–2018
Figure 66: Merck & Co., Inc. Revenue (US$ Mn) and Y-o-Y Growth (%), 2015–2018
Figure 67: Merck & Co., Inc. Breakdown of Net Sales (%), by Region/Country, 2018
Figure 68: Merck & Co., Inc. Revenue Breakdown of Net Sales (%), by Segment, 2018
Figure 69: Merck & Co., Inc. R&D Expenses (US$ Mn) and Y-o-Y Growth (%), 2015–2018
Figure 70: Johnson & Johnson Pharmaceutical Segment Revenue (US$ Mn) and Y-o-Y Growth (%), 2016–2018
Figure 71: Johnson & Johnson Breakdown of Net Sales (%), of Pharmaceutical Segment by Region/Country, 2018
Figure 72: Johnson & Johnson Revenue Breakdown of Net Sales (%), by Pharmaceutical Segment, 2018
Figure 73: Johnson & Johnson, Pharmaceutical Segment R&D Expenses (US$ Mn) and Y-o-Y Growth (%), 2016–2018
Figure 74: Dr. Reddy’s Laboratories Ltd. Revenue (US$ Mn) and Y-o-Y Growth (%), 2015–2018
Figure 75: Dr. Reddy’s Laboratories Ltd. Breakdown of Net Sales (%) of Global Generics Business Segment, by Region/Country, 2018
Figure 76: Dr. Reddy’s Laboratories Ltd. Revenue Breakdown of Net Sales (%), by Global Generics Segment, 2018
Figure 77: Dr. Reddy’s Laboratories Ltd. R&D Expenses (US$ Mn) and Y-o-Y Growth (%), 2016–2018
Figure 78: Cipla Inc., Revenue (US$ Mn), 2017–2018
Figure 79: Cipla Inc., Breakdown of Net Sales (%), by Region, 2018
Figure 80: Cipla Inc., Breakdown of Net Sales (%), by Business Segment, 2018
Figure 81: Gilead Sciences, Inc. Revenue (US$ Mn) and Y-o-Y Growth (%), 2015–2018
Figure 82: Genvoya Breakdown of Net Sales (%), by Region/Country, 2018
Figure 83: Stribild Breakdown of Net Sales (%), by Region/Country, 2018
Figure 84: Gilead Sciences, Inc. R&D Expenses (US$ Mn) and Y-o-Y Growth (%), 2017–2018
Figure 85: Takeda Pharmaceutical Company Limited Revenue (US$ Mn) and Y-o-Y Growth (%), 2016–2019
Figure 86: Takeda Pharmaceutical Company Limited Breakdown of Net Sales (%), by Region/Country, 2019
Figure 87: Takeda Pharmaceutical Company Limited R&D Expenses (US$ Mn) and Y-o-Y Growth (%), 2017–2019
Copyright © Transparency Market Research, Inc. All Rights reserved
Trust Online

Polypill Products Market