
Reports
Reports
Analysts’ Viewpoint on Oil Condition Monitoring Services Market Scenario
Companies in the global oil condition monitoring services market are focusing on high-growth end-use industries such as automotive & transportation, marine, and energy & utilities to keep their businesses growing post the COVID-19 pandemic. Rise in demand for laboratory testing of lubrication oil, engine oil, and assessment of quality degradation in machinery is expected to drive the global market during the forecast period. Furthermore, demand for oil condition monitoring in industries is high due to a rise in the demand for energy and an increase in adoption of big data analytics and IIoT adoption. Stakeholders should focus on online, real-time platforms for evaluation of machinery and oil in order to gain revenue benefits. Continuous predictive analysis can be achieved with the help of IIoT and appropriate client and service provider consultation.
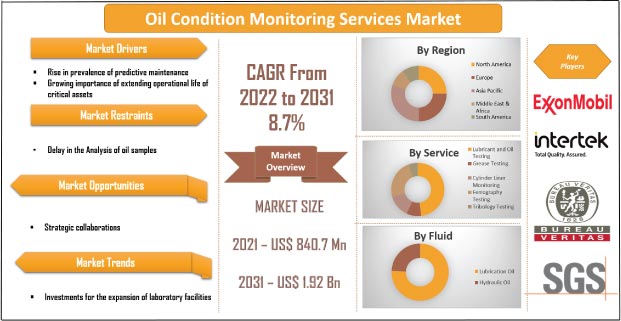
Oil condition monitoring (OCM) is an important element of any predictive maintenance program. OCM entails measuring, monitoring, and analyzing changes in lubricant and fuel oil for contamination and chemical content, as well as tracking oil quality degradation from new to end-of-life. Accurate, high-quality oil condition analysis, or oil quality monitoring, provides a complete understanding of the equipment's health and status. Contamination by fuel, water, or acid can rapidly cause oil to lose its lubricating properties, resulting in equipment damage. The condition of the lubricant oil used often reflects operational issues in machines, engines, and other components. Oil analysis parameters or regularly scheduled oil condition monitoring can detect mechanical issues before they disrupt the efficient operation of machinery, saving money in the long run. Rise in prevalence of predictive maintenance among asset managers and machine operators across the globe is likely to propel the global oil condition monitoring market. Manufacturers are expected to gain incremental opportunities in the oil analysis condition monitoring services market in the next few years.
The method of predictive maintenance emerged in the last few years and rapidly started gaining prominence among industry operators and asset managers. Predictive maintenance can help industries evaluate the health of the assets and predict when a particular component or a system is likely to fail and thus, needs replacement or repair.
Several organizations are preferring predictive maintenance analytics, ranging from targeted solutions for a single machine part, to factory-wide deployments to increase Overall Equipment Effectiveness (OEE) throughout the production line. Oil condition monitoring companies help identify the equipment before it leads to serious damage. Oil condition monitoring technology reduces unplanned downtime, extends the lifetime of the equipment, and safely extends oil change intervals which is a costly affair. Thus, rise in prevalence of predictive maintenance is projected to increase the oil condition monitoring market size during the forecast period.
When it comes to the lifecycle of any asset, one expects it to perform its intended function as efficiently as possible for as long as possible. The lifecycle of an asset in a system includes its design, installation, operation, and decommissioning. There are numerous factors that influence asset performance and, ultimately, asset health. For instance, lubricants in the machinery have to constantly work under critical conditions and are exposed to constant high pressures. Additionally, factors such as high pressures, temperatures and other harmful factors, including water contamination, corrosion, fuel, and air ingested particles adversely impact the performance of the lubricant. This further leads to mechanical damage to the spare parts of the machinery. It is of pivotal importance to monitor the condition of the assets to avoid unexpected breakdowns and hamper the operations of the industry as a whole. This can be achieved by employing effective monitoring solutions which keep a check on the health of the asset and helps in predicting the maintenance needs, well in advance.
Failure to implement a suitable oil condition monitoring program can lead to unexpected shutdown of the system. This can lead to wear and tear in the machinery components causing the machinery to stop functioning which further leads to a reduced lifetime of the asset. Industries then have to incur the cost of procuring new machinery, which results in a significant expense. The cost of replacement of the equipment can be brought down by as much as 50% with the help of suitable oil condition monitoring services. Therefore, numerous industries are opting for real time oil condition monitoring services in a bid to minimize equipment failure and further extend their operational life.
In terms of service, the global oil condition monitoring services market has been segregated into lubricant and oil testing, grease testing, cylinder liner monitoring, ferrography testing, and tribology testing. Among the segments, lubricant and oil testing held the highest share in the market in 2021. Lubricants are used to reduce friction, thereby reducing wear & tear among the components in the equipment. Lubricant and oil are the lifeblood of any machinery, as they help maintain the temperature levels of the equipment ensure smooth performance. Intertek is one of the major players in the market, which has a large network of lubricant and oil condition monitoring (OCM) laboratories that work with diverse industries to ensure quick, accurate, and reliable testing and reporting.
In terms of fluid, the global oil condition monitoring services have been bifurcated into lubrication oil and hydraulic oil. Increase in use of lubrication testing services by industry operators and widespread use of lubrication oil in machinery and equipment contributed to the prominent. Appropriate lubrication is a critical factor in determining the longevity and overall health of mechanical equipment or machinery in use. Lubricating oils are frequently subjected to extreme stress in service, where they are tasked with providing lubrication, cooling, removing contamination/wear, and providing corrosion protection.
North America held the largest market share of approximately 31% of the global oil condition monitoring services market in 2021. It is projected to maintain its share during the forecast period. The presence of key players and a rise in adoption of predictive maintenance in the U.S. are key factors boosting the oil condition monitoring services market share held by the region. The market in Asia Pacific is also growing due to rapid industrialization and urbanization. Furthermore, increase in usage of oil condition monitoring services for industrial applications drives the market in the region. Middle East & Africa is a larger market for oil condition monitoring services as compared to South America; however, the market in South America is estimated to grow at a rapid pace as compared to the market in Middle East & Africa.
The global oil condition monitoring services market is consolidated with a small number of large-scale vendors that control majority of the market share. Several firms are spending significantly on comprehensive research and development, and new product development. Expansion of product portfolios and mergers and acquisitions are major strategies adopted by key players. Bureau Veritas, CONDITION MONITORING SERVICES, INC, Eastway, Element Materials Technology, Exxon Mobil Corporation, Intertek Group plc, SGS SA, Shell, Veritas Petroleum Services, and Vickers Oils are the prominent entities operating in this market.
In August 2021, Shell announces the launch of VitalyX. It is an intelligent, advanced analytics-based oil condition monitoring and machine health service for the marine sector powered by Shell Remote Sense and Bently Nevada, a Baker Hughes business. It uses oil condition monitoring sensors and machine learning to provide customers with actionable insights to maximize equipment health, lower maintenance costs, and increase the operational efficiency of marine vessels by deploying industrial internet of things (IIOT) and artificial intelligence (AI) technology in innovative ways.
In June 2020, Intertek Group PLC expanded its current oil condition monitoring services network with two new locations in Jakarta, Indonesia, and Baku, Azerbaijan. Through this expansion, the company would be able to offer services to clients in Asia and across Europe. The new laboratories are also projected to complement the company's existing global network.
Each of these players has been profiled in the oil condition monitoring services market report based on parameters such as company overview, financial overview, business strategies, product portfolio, business segments, and recent developments.
|
Attribute |
Detail |
|
Market Size Value in 2021 |
US$ 840.7 Mn |
|
Market Forecast Value in 2031 |
US$ 1.92 Bn |
|
Growth Rate (CAGR) |
8.7% |
|
Forecast Period |
2022–2031 |
|
Historical Data Available for |
2017–2020 |
|
Quantitative Units |
US$ Mn/Bn for Value |
|
Market Analysis |
It includes cross segment analysis at global as well as regional level. Furthermore, qualitative analysis includes drivers, restraints, opportunities, key trends, Porter’s Five Forces analysis, value chain analysis, and key trend analysis. |
|
Competition Landscape |
|
|
Format |
Electronic (PDF) + Excel |
|
Market Segmentation |
|
|
Regions Covered |
|
|
Countries Covered |
|
|
Companies Profiled |
|
|
Customization Scope |
Available upon request |
|
Pricing |
Available upon request |
The global Oil Condition Monitoring Services market is projected to reach US$ 1.4 Bn by 2027, at a CAGR of 7%.
Rising Adoption of Predictive Maintenance Among Industries: A Key Driver of Oil Condition Monitoring Services Market
Companies such as Exxon Mobil Corporation, Intertek Group plc, SGS SA, Bureau Veritas, and Veritas Petroleum Services fall under the star category.
North America contributes the largest market share in Oil Condition Monitoring Services market during the forecast period.
Industrial Internet of Things (IIoT) and Industry 4.0 revolution are adding great value to the development of Oil Condition Monitoring Services is expected to shape the market in the coming years
1. Preface
1.1. Market Introduction
1.2. Market and Segments Definition
1.3. Market Taxonomy
1.4. Research Methodology
1.5. Assumption and Acronyms
2. Executive Summary
2.1. Oil Condition Monitoring Services Market Overview
2.2. Regional Outline
2.3. Industry Outline
2.4. Market Dynamics Snapshot
2.5. Competition Blueprint
3. Market Dynamics
3.1. Macro-economic Factors
3.2. Drivers
3.3. Restraints
3.4. Opportunities
3.5. Key Trends
3.6. Regulatory Scenario
4. Associated Industry and Key Indicator Assessment
4.1. Parent Industry Overview – Global Condition Monitoring Industry Overview
4.2. Supply Chain Analysis
4.3. Technology Roadmap Analysis
4.4. Industry SWOT Analysis
4.5. Porter Five Forces Analysis
4.6. Covid-19 Impact and Recovery Analysis
5. Oil Condition Monitoring Services Market Analysis, by Service
5.1. Oil Condition Monitoring Services Market Value (US$ Mn) Analysis & Forecast, by Service, 2017–2031
5.1.1. Lubricant and Oil Testing
5.1.2. Grease Testing
5.1.3. Cylinder Liner Monitoring
5.1.4. Ferrography Testing
5.1.5. Tribology Testing
5.2. Market Attractiveness Analysis, By Service
6. Oil Condition Monitoring Services Market Analysis, by Fluid
6.1. Oil Condition Monitoring Services Market Value (US$ Mn) Analysis & Forecast, by Fluid, 2017–2031
6.1.1. Lubrication Oil
6.1.2. Hydraulic Oil
6.2. Market Attractiveness Analysis, By Fluid
7. Oil Condition Monitoring Services Market Analysis, by Application
7.1. Oil Condition Monitoring Services Market Value (US$ Mn) Analysis & Forecast, by Application, 2017–2031
7.1.1. Engines
7.1.2. Turbines
7.1.3. Hydraulic Systems
7.1.4. Compressors
7.1.5. Others
7.2. Market Attractiveness Analysis, By Application
8. Oil Condition Monitoring Services Market Analysis, by End-use Industry
8.1. Oil Condition Monitoring Services Market Value (US$ Mn) Analysis & Forecast, by End-use Industry, 2017–2031
8.1.1. Automotive & Transportation
8.1.2. Marine
8.1.3. Energy & Utilities
8.1.4. Industrial
8.1.5. Others
8.2. Market Attractiveness Analysis, By End-use Industry
9. Oil Condition Monitoring Services Market Analysis and Forecast, by Region
9.1. Oil Condition Monitoring Services Market Value (US$ Mn) Analysis & Forecast, by Region, 2017–2031
9.1.1. North America
9.1.2. Europe
9.1.3. Asia Pacific
9.1.4. Middle East & Africa
9.1.5. South America
9.2. Market Attractiveness Analysis, By Region
10. North America Oil Condition Monitoring Services Market Analysis and Forecast
10.1. Market Snapshot
10.2. Drivers and Restraints: Impact Analysis
10.3. Oil Condition Monitoring Services Market Value (US$ Mn) Analysis & Forecast, by Service, 2017–2031
10.3.1. Lubricant and Oil Testing
10.3.2. Grease Testing
10.3.3. Cylinder Liner Monitoring
10.3.4. Ferrography Testing
10.3.5. Tribology Testing
10.4. Oil Condition Monitoring Services Market Value (US$ Mn) Analysis & Forecast, by Fluid, 2017–2031
10.4.1. Lubrication Oil
10.4.2. Hydraulic Oil
10.5. Oil Condition Monitoring Services Market Value (US$ Mn) Analysis & Forecast, by Application, 2017–2031
10.5.1. Engines
10.5.2. Turbines
10.5.3. Hydraulic Systems
10.5.4. Compressors
10.5.5. Others
10.6. Oil Condition Monitoring Services Market Value (US$ Mn) Analysis & Forecast, by End-use Industry, 2017–2031
10.6.1. Automotive & Transportation
10.6.2. Marine
10.6.3. Energy & Utilities
10.6.4. Industrial
10.6.5. Others
10.7. Oil Condition Monitoring Services Value (US$ Mn) Analysis & Forecast, by Country and Sub-region, 2017–2031
10.7.1. U.S.
10.7.2. Canada
10.7.3. Rest of North America
10.8. Market Attractiveness Analysis
10.8.1. By Service
10.8.2. By Fluid
10.8.3. By Application
10.8.4. By End-use Industry
10.8.5. By Country and Sub-region
11. Europe Oil Condition Monitoring Services Market Analysis and Forecast
11.1. Market Snapshot
11.2. Drivers and Restraints: Impact Analysis
11.3. Oil Condition Monitoring Services Market Value (US$ Mn) Analysis & Forecast, by Service, 2017–2031
11.3.1. Lubricant and Oil Testing
11.3.2. Grease Testing
11.3.3. Cylinder Liner Monitoring
11.3.4. Ferrography Testing
11.3.5. Tribology Testing
11.4. Oil Condition Monitoring Services Market Value (US$ Mn) Analysis & Forecast, by Fluid, 2017–2031
11.4.1. Lubrication Oil
11.4.2. Hydraulic Oil
11.5. Oil Condition Monitoring Services Market Value (US$ Mn) Analysis & Forecast, by Application, 2017–2031
11.5.1. Engines
11.5.2. Turbines
11.5.3. Hydraulic Systems
11.5.4. Compressors
11.5.5. Others
11.6. Oil Condition Monitoring Services Market Value (US$ Mn) Analysis & Forecast, by End-use Industry, 2017–2031
11.6.1. Automotive & Transportation
11.6.2. Marine
11.6.3. Energy & Utilities
11.6.4. Industrial
11.6.5. Others
11.7. Oil Condition Monitoring Services Value (US$ Mn) Analysis & Forecast, by Country and Sub-region, 2017–2031
11.7.1. The U.K.
11.7.2. Germany
11.7.3. France
11.7.4. Rest of Europe
11.8. Market Attractiveness Analysis
11.8.1. By Service
11.8.2. By Fluid
11.8.3. By Application
11.8.4. By End-use Industry
11.8.5. By Country and Sub-region
12. Asia Pacific Oil Condition Monitoring Services Market Analysis and Forecast
12.1. Market Snapshot
12.2. Drivers and Restraints: Impact Analysis
12.3. Oil Condition Monitoring Services Market Value (US$ Mn) Analysis & Forecast, by Service, 2017–2031
12.3.1. Lubricant and Oil Testing
12.3.2. Grease Testing
12.3.3. Cylinder Liner Monitoring
12.3.4. Ferrography Testing
12.3.5. Tribology Testing
12.4. Oil Condition Monitoring Services Market Value (US$ Mn) Analysis & Forecast, by Fluid, 2017–2031
12.4.1. Lubrication Oil
12.4.2. Hydraulic Oil
12.5. Oil Condition Monitoring Services Market Value (US$ Mn) Analysis & Forecast, by Application, 2017–2031
12.5.1. Engines
12.5.2. Turbines
12.5.3. Hydraulic Systems
12.5.4. Compressors
12.5.5. Others
12.6. Oil Condition Monitoring Services Market Value (US$ Mn) Analysis & Forecast, by End-use Industry, 2017–2031
12.6.1. Automotive & Transportation
12.6.2. Marine
12.6.3. Energy & Utilities
12.6.4. Industrial
12.6.5. Others
12.7. Oil Condition Monitoring Services Value (US$ Mn) Analysis & Forecast, by Country and Sub-region, 2017–2031
12.7.1. China
12.7.2. India
12.7.3. Japan
12.7.4. South Korea
12.7.5. ASEAN
12.7.6. Rest of Asia Pacific
12.8. Market Attractiveness Analysis
12.8.1. By Service
12.8.2. By Fluid
12.8.3. By Application
12.8.4. By End-use Industry
12.8.5. By Country and Sub-region
13. Middle East and Africa Oil Condition Monitoring Services Market Analysis and Forecast
13.1. Market Snapshot
13.2. Drivers and Restraints: Impact Analysis
13.3. Oil Condition Monitoring Services Market Value (US$ Mn) Analysis & Forecast, by Service, 2017–2031
13.3.1. Lubricant and Oil Testing
13.3.2. Grease Testing
13.3.3. Cylinder Liner Monitoring
13.3.4. Ferrography Testing
13.3.5. Tribology Testing
13.4. Oil Condition Monitoring Services Market Value (US$ Mn) Analysis & Forecast, by Fluid, 2017–2031
13.4.1. Lubrication Oil
13.4.2. Hydraulic Oil
13.5. Oil Condition Monitoring Services Market Value (US$ Mn) Analysis & Forecast, by Application, 2017–2031
13.5.1. Engines
13.5.2. Turbines
13.5.3. Hydraulic Systems
13.5.4. Compressors
13.5.5. Others
13.6. Oil Condition Monitoring Services Market Value (US$ Mn) Analysis & Forecast, by End-use Industry, 2017–2031
13.6.1. Automotive & Transportation
13.6.2. Marine
13.6.3. Energy & Utilities
13.6.4. Industrial
13.6.5. Others
13.7. Oil Condition Monitoring Services Value (US$ Mn) Analysis & Forecast, by Country and Sub-region, 2017–2031
13.7.1. GCC
13.7.2. South Africa
13.7.3. Rest of the Middle East and Africa
13.8. Market Attractiveness Analysis
13.8.1. By Service
13.8.2. By Fluid
13.8.3. By Application
13.8.4. By End-use Industry
13.8.5. By Country and Sub-region
14. South America Oil Condition Monitoring Services Market Analysis and Forecast
14.1. Market Snapshot
14.2. Drivers and Restraints: Impact Analysis
14.3. Oil Condition Monitoring Services Market Value (US$ Mn) Analysis & Forecast, by Service, 2017–2031
14.3.1. Lubricant and Oil Testing
14.3.2. Grease Testing
14.3.3. Cylinder Liner Monitoring
14.3.4. Ferrography Testing
14.3.5. Tribology Testing
14.4. Oil Condition Monitoring Services Market Value (US$ Mn) Analysis & Forecast, by Fluid, 2017–2031
14.4.1. Lubrication Oil
14.4.2. Hydraulic Oil
14.5. Oil Condition Monitoring Services Market Value (US$ Mn) Analysis & Forecast, by Application, 2017–2031
14.5.1. Engines
14.5.2. Turbines
14.5.3. Hydraulic Systems
14.5.4. Compressors
14.5.5. Others
14.6. Oil Condition Monitoring Services Market Value (US$ Mn) Analysis & Forecast, by End-use Industry, 2017–2031
14.6.1. Automotive & Transportation
14.6.2. Marine
14.6.3. Energy & Utilities
14.6.4. Industrial
14.6.5. Others
14.7. Oil Condition Monitoring Services Value (US$ Mn) Analysis & Forecast, by Country and Sub-region, 2017–2031
14.7.1. Brazil
14.7.2. Rest of South America
14.8. Market Attractiveness Analysis
14.8.1. By Service
14.8.2. By Fluid
14.8.3. By Application
14.8.4. By End-use Industry
14.8.5. By Country and Sub-region
15. Competition Assessment
15.1. Global Oil Condition Monitoring Services Market Competition Matrix - a Dashboard View
15.1.1. Global Oil Condition Monitoring Services Market Company Share Analysis, by Value (2021)
15.1.2. Technological Differentiator
16. Company Profiles (Global Manufacturers/Suppliers)
16.1. Bureau Veritas
16.1.1. Overview
16.1.2. Product Portfolio
16.1.3. Sales Footprint
16.1.4. Key Subsidiaries or Distributors
16.1.5. Strategy and Recent Developments
16.1.6. Key Financials
16.2. CONDITION MONITORING SERVICES, INC
16.2.1. Overview
16.2.2. Product Portfolio
16.2.3. Sales Footprint
16.2.4. Key Subsidiaries or Distributors
16.2.5. Strategy and Recent Developments
16.2.6. Key Financials
16.3. Eastway
16.3.1. Overview
16.3.2. Product Portfolio
16.3.3. Sales Footprint
16.3.4. Key Subsidiaries or Distributors
16.3.5. Strategy and Recent Developments
16.3.6. Key Financials
16.4. Element Materials Technology
16.4.1. Overview
16.4.2. Product Portfolio
16.4.3. Sales Footprint
16.4.4. Key Subsidiaries or Distributors
16.4.5. Strategy and Recent Developments
16.4.6. Key Financials
16.5. Exxon Mobil Corporation
16.5.1. Overview
16.5.2. Product Portfolio
16.5.3. Sales Footprint
16.5.4. Key Subsidiaries or Distributors
16.5.5. Strategy and Recent Developments
16.5.6. Key Financials
16.6. Intertek Group plc
16.6.1. Overview
16.6.2. Product Portfolio
16.6.3. Sales Footprint
16.6.4. Key Subsidiaries or Distributors
16.6.5. Strategy and Recent Developments
16.6.6. Key Financials
16.7. SGS SA
16.7.1. Overview
16.7.2. Product Portfolio
16.7.3. Sales Footprint
16.7.4. Key Subsidiaries or Distributors
16.7.5. Strategy and Recent Developments
16.7.6. Key Financials
16.8. Shell
16.8.1. Overview
16.8.2. Product Portfolio
16.8.3. Sales Footprint
16.8.4. Key Subsidiaries or Distributors
16.8.5. Strategy and Recent Developments
16.8.6. Key Financials
16.9. Veritas Petroleum Services
16.9.1. Overview
16.9.2. Product Portfolio
16.9.3. Sales Footprint
16.9.4. Key Subsidiaries or Distributors
16.9.5. Strategy and Recent Developments
16.9.6. Key Financials
16.10. Vickers Oils
16.10.1. Overview
16.10.2. Product Portfolio
16.10.3. Sales Footprint
16.10.4. Key Subsidiaries or Distributors
16.10.5. Strategy and Recent Developments
16.10.6. Key Financials
17. Recommendation
17.1. Opportunity Assessment
17.1.1. By Service
17.1.2. By Fluid
17.1.3. By Application
17.1.4. By End-use Industry
17.1.5. By Region
List of Tables
Table 01: Global Oil Condition Monitoring Services Market Value (US$ Mn) Forecast, by Service, 2017‒2031
Table 02: Global Oil Condition Monitoring Services Market Value (US$ Mn) Forecast, by Fluid, 2017‒2031
Table 03: Global Oil Condition Monitoring Services Market Value (US$ Mn) Forecast, by Application, 2017‒2031
Table 04: Global Oil Condition Monitoring Services Market Value (US$ Mn) Forecast, by End-use Industry, 2017‒2031
Table 05: Global Oil Condition Monitoring Services Market Value (US$ Mn) Forecast, by Region, 2017‒2031
Table 06: North America Oil Condition Monitoring Services Market Value (US$ Mn) Forecast, by Service, 2017‒2031
Table 07: North America Oil Condition Monitoring Services Market Value (US$ Mn) Forecast, by Fluid, 2017‒2031
Table 08: North America Oil Condition Monitoring Services Market Value (US$ Mn) Forecast, by Application, 2017‒2031
Table 09: North America Oil Condition Monitoring Services Market Value (US$ Mn) Forecast, by End-use Industry, 2017‒2031
Table 10: North America Oil Condition Monitoring Services Market Value (US$ Mn) Forecast, by Country and Sub-region, 2017‒2031
Table 11: Europe Oil Condition Monitoring Services Market Value (US$ Mn) Forecast, by Service, 2017‒2031
Table 12: Europe Oil Condition Monitoring Services Market Value (US$ Mn) Forecast, by Fluid, 2017‒2031
Table 13: Europe Oil Condition Monitoring Services Market Value (US$ Mn) Forecast, by Application, 2017‒2031
Table 14: Europe Oil Condition Monitoring Services Market Value (US$ Mn) Forecast, by End-use Industry, 2017‒2031
Table 15: Europe Oil Condition Monitoring Services Market Value (US$ Mn) Forecast, by Country and Sub-region, 2017‒2031
Table 16: Asia Pacific Oil Condition Monitoring Services Market Value (US$ Mn) Forecast, by Service, 2017‒2031
Table 17: Asia Pacific Oil Condition Monitoring Services Market Value (US$ Mn) Forecast, by Fluid, 2017‒2031
Table 18: Asia Pacific Oil Condition Monitoring Services Market Value (US$ Mn) Forecast, by Application, 2017‒2031
Table 19: Asia Pacific Oil Condition Monitoring Services Market Value (US$ Mn) Forecast, by End-use Industry, 2017‒2031
Table 20: Asia Pacific Oil Condition Monitoring Services Market Value (US$ Mn) Forecast, by Country and Sub-region, 2017‒2031
Table 21: Middle East & Africa Oil Condition Monitoring Services Market Value (US$ Mn) Forecast, by Service, 2017‒2031
Table 22: Middle East & Africa Oil Condition Monitoring Services Market Value (US$ Mn) Forecast, by Fluid, 2017‒2031
Table 23: Middle East & Africa Oil Condition Monitoring Services Market Value (US$ Mn) Forecast, by Application, 2017‒2031
Table 24: Middle East & Africa Oil Condition Monitoring Services Market Value (US$ Mn) Forecast, by End-use Industry, 2017‒2031
Table 25: Middle East & Africa Oil Condition Monitoring Services Market Value (US$ Mn) Forecast, by Country and Sub-region, 2017‒2031
Table 26: South America Oil Condition Monitoring Services Market Value (US$ Mn) Forecast, by Service, 2017‒2031
Table 27: South America Oil Condition Monitoring Services Market Value (US$ Mn) Forecast, by Fluid, 2017‒2031
Table 28: South America Oil Condition Monitoring Services Market Value (US$ Mn) Forecast, by Application, 2017‒2031
Table 29: South America Oil Condition Monitoring Services Market Value (US$ Mn) Forecast, by End-use Industry, 2017‒2031
Table 30: South America Oil Condition Monitoring Services Market Value (US$ Mn) Forecast, by Country and Sub-region, 2017‒2031
List of Figures
Figure 01: Global Oil Condition Monitoring Services Market Share Analysis, by Region, 2022 and 2031
Figure 02: Global Oil Condition Monitoring Services Price Trend Analysis (Average Price, US$ Thousand)
Figure 03: Global Oil Condition Monitoring Services Market Size & Forecast, Value (US$ Mn), 2017-2031
Figure 04: Global Oil Condition Monitoring Services Market, Year-on-Year Growth, Global Overview, 2018-2031
Figure 05: Global Oil Condition Monitoring Services Market Projections by Service, Value (US$ Mn), 2017-2031
Figure 06: Global Oil Condition Monitoring Services Market, Incremental Opportunity, by Service, Value (US$ Mn ), 2022-2031
Figure 07: Global Oil Condition Monitoring Services Market Share Analysis, by Service, 2022 and 2031
Figure 08: Global Oil Condition Monitoring Services Market Projections by Fluid, Value (US$ Mn), 2017-2031
Figure 09: Global Oil Condition Monitoring Services Market, Incremental Opportunity, by Fluid, Value (US$ Mn), 2022-2031
Figure 10: Global Oil Condition Monitoring Services Market Share Analysis, by Fluid, 2022 and 2031
Figure 11: Global Oil Condition Monitoring Services Market Projections by Application, Value (US$ Mn ), 2017-2031
Figure 12: Global Oil Condition Monitoring Services Market, Incremental Opportunity, by Application, Value (US$ Mn ), 2022-2031
Figure 13: Global Oil Condition Monitoring Services Market Share Analysis, by Application, 2022 and 2031
Figure 14: Global Oil Condition Monitoring Services Market Projections by End-use Industry, Value (US$ Mn), 2017-2031
Figure 15: Global Oil Condition Monitoring Services Market, Incremental Opportunity, by End-use Industry, Value (US$ Mn), 2022-2031
Figure 16: Global Oil Condition Monitoring Services Market Share Analysis, by End-use Industry, 2022 and 2031
Figure 17: Global Oil Condition Monitoring Services Market Projections by Region, Value (US$ Mn), 2017-2031
Figure 18: Global Oil Condition Monitoring Services Market, Incremental Opportunity, by Region, Value (US$ Mn), 2022-2031
Figure 19: Global Oil Condition Monitoring Services Market Share Analysis, by Region, 2022 and 2031
Figure 20: North America Oil Condition Monitoring Services Market Size & Forecast, Value (US$ Mn), 2017-2031
Figure 21: North America Oil Condition Monitoring Services Market, Year-on-Year Growth, North America Overview, 2018-2031
Figure 22: North America Oil Condition Monitoring Services Market Projections by Service, Value (US$ Mn), 2017-2031
Figure 23: North America Oil Condition Monitoring Services Market, Incremental Opportunity, by Service, Value (US$ Mn ), 2022-2031
Figure 24: North America Oil Condition Monitoring Services Market Share Analysis, by Service, 2022 and 2031
Figure 25: North America Oil Condition Monitoring Services Market Projections by Fluid, Value (US$ Mn), 2017-2031
Figure 26: North America Oil Condition Monitoring Services Market, Incremental Opportunity, by Fluid, Value (US$ Mn), 2022-2031
Figure 27: North America Oil Condition Monitoring Services Market Share Analysis, by Fluid, 2022 and 2031
Figure 28: North America Oil Condition Monitoring Services Market Projections by Application, Value (US$ Mn ), 2017-2031
Figure 29: North America Oil Condition Monitoring Services Market, Incremental Opportunity, by Application, Value (US$ Mn ), 2022-2031
Figure 30: North America Oil Condition Monitoring Services Market Share Analysis, by Application, 2022 and 2031
Figure 31: North America Oil Condition Monitoring Services Market Projections by End-use Industry, Value (US$ Mn), 2017-2031
Figure 32: North America Oil Condition Monitoring Services Market, Incremental Opportunity, by End-use Industry, Value (US$ Mn), 2022-2031
Figure 33: North America Oil Condition Monitoring Services Market Share Analysis, by End-use Industry, 2022 and 2031
Figure 34: North America Oil Condition Monitoring Services Market Projections by Country and Sub-region, Value (US$ Mn), 2017-2031
Figure 35: North America Oil Condition Monitoring Services Market, Incremental Opportunity, by Country and Sub-region, Value (US$ Mn), 2022-2031
Figure 36: North America Oil Condition Monitoring Services Market Share Analysis, by Country and Sub-region, 2022 and 2031
Figure 37: Europe Oil Condition Monitoring Services Market Size & Forecast, Value (US$ Mn), 2017-2031
Figure 38: Europe Oil Condition Monitoring Services Market, Year-on-Year Growth, Europe Overview, 2018-2031
Figure 39: Europe Oil Condition Monitoring Services Market Projections by Service, Value (US$ Mn), 2017-2031
Figure 40: Europe Oil Condition Monitoring Services Market, Incremental Opportunity, by Service, Value (US$ Mn ), 2022-2031
Figure 41: Europe Oil Condition Monitoring Services Market Share Analysis, by Service, 2022 and 2031
Figure 42: Europe Oil Condition Monitoring Services Market Projections by Fluid, Value (US$ Mn), 2017-2031
Figure 43: Europe Oil Condition Monitoring Services Market, Incremental Opportunity, by Fluid, Value (US$ Mn), 2022-2031
Figure 44: Europe Oil Condition Monitoring Services Market Share Analysis, by Fluid, 2022 and 2031
Figure 45: Europe Oil Condition Monitoring Services Market Projections by Application, Value (US$ Mn ), 2017-2031
Figure 46: Europe Oil Condition Monitoring Services Market, Incremental Opportunity, by Application, Value (US$ Mn ), 2022-2031
Figure 47: Europe Oil Condition Monitoring Services Market Share Analysis, by Application, 2022 and 2031
Figure 48: Europe Oil Condition Monitoring Services Market Projections by End-use Industry, Value (US$ Mn), 2017-2031
Figure 49: Europe Oil Condition Monitoring Services Market, Incremental Opportunity, by End-use Industry, Value (US$ Mn), 2022-2031
Figure 50: Europe Oil Condition Monitoring Services Market Share Analysis, by End-use Industry, 2022 and 2031
Figure 51: Europe Oil Condition Monitoring Services Market Projections by Country and Sub-region, Value (US$ Mn), 2017-2031
Figure 52: Europe Oil Condition Monitoring Services Market, Incremental Opportunity, by Country and Sub-region, Value (US$ Mn), 2022-2031
Figure 53: Europe Oil Condition Monitoring Services Market Share Analysis, by Country and Sub-region, 2022 and 2031
Figure 54: Asia Pacific Oil Condition Monitoring Services Market Size & Forecast, Value (US$ Mn), 2017-2031
Figure 55: Asia Pacific Oil Condition Monitoring Services Market, Year-on-Year Growth, Asia Pacific Overview, 2018-2031
Figure 56: Asia Pacific Oil Condition Monitoring Services Market Projections by Service, Value (US$ Mn), 2017-2031
Figure 57: Asia Pacific Oil Condition Monitoring Services Market, Incremental Opportunity, by Service, Value (US$ Mn ), 2022-2031
Figure 58: Asia Pacific Oil Condition Monitoring Services Market Share Analysis, by Service, 2022 and 2031
Figure 59: Asia Pacific Oil Condition Monitoring Services Market Projections by Fluid, Value (US$ Mn), 2017-2031
Figure 60: Asia Pacific Oil Condition Monitoring Services Market, Incremental Opportunity, by Fluid, Value (US$ Mn), 2022-2031
Figure 61: Asia Pacific Oil Condition Monitoring Services Market Share Analysis, by Fluid, 2022 and 2031
Figure 62: Asia Pacific Oil Condition Monitoring Services Market Projections by Application, Value (US$ Mn ), 2017-2031
Figure 63: Asia Pacific Oil Condition Monitoring Services Market, Incremental Opportunity, by Application, Value (US$ Mn ), 2022-2031
Figure 64: Asia Pacific Oil Condition Monitoring Services Market Share Analysis, by Application, 2022 and 2031
Figure 65: Asia Pacific Oil Condition Monitoring Services Market Projections by End-use Industry, Value (US$ Mn), 2017-2031
Figure 66: Asia Pacific Oil Condition Monitoring Services Market, Incremental Opportunity, by End-use Industry, Value (US$ Mn), 2022-2031
Figure 67: Asia Pacific Oil Condition Monitoring Services Market Share Analysis, by End-use Industry, 2022 and 2031
Figure 68: Asia Pacific Oil Condition Monitoring Services Market Projections by Country and Sub-region, Value (US$ Mn), 2017-2031
Figure 69: Asia Pacific Oil Condition Monitoring Services Market, Incremental Opportunity, by Country and Sub-region, Value (US$ Mn), 2022-2031
Figure 70: Asia Pacific Oil Condition Monitoring Services Market Share Analysis, by Country and Sub-region, 2022 and 2031
Figure 71: Middle East & Africa Oil Condition Monitoring Services Market Size & Forecast, Value (US$ Mn), 2017-2031
Figure 72: Middle East & Africa Oil Condition Monitoring Services Market Year-on-Year Growth Overview, 2018-2031
Figure 73: Middle East & Africa Oil Condition Monitoring Services Market Projections by Service, Value (US$ Mn), 2017-2031
Figure 74: Middle East & Africa Oil Condition Monitoring Services Market, Incremental Opportunity, by Service, Value (US$ Mn ), 2022-2031
Figure 75: Middle East & Africa Oil Condition Monitoring Services Market Share Analysis, by Service, 2022 and 2031
Figure 76: Middle East & Africa Oil Condition Monitoring Services Market Projections by Fluid, Value (US$ Mn), 2017-2031
Figure 77: Middle East & Africa Oil Condition Monitoring Services Market, Incremental Opportunity, by Fluid, Value (US$ Mn), 2022-2031
Figure 78: Middle East & Africa Oil Condition Monitoring Services Market Share Analysis, by Fluid, 2022 and 2031
Figure 79: Middle East & Africa Oil Condition Monitoring Services Market Projections by Application, Value (US$ Mn ), 2017-2031
Figure 80: Middle East & Africa Oil Condition Monitoring Services Market, Incremental Opportunity, by Application, Value (US$ Mn ), 2022-2031
Figure 81: Middle East & Africa Oil Condition Monitoring Services Market Share Analysis, by Application, 2022 and 2031
Figure 82: Middle East & Africa Oil Condition Monitoring Services Market Projections by End-use Industry, Value (US$ Mn), 2017-2031
Figure 83: Middle East & Africa Oil Condition Monitoring Services Market, Incremental Opportunity, by End-use Industry, Value (US$ Mn), 2022-2031
Figure 84: Middle East & Africa Oil Condition Monitoring Services Market Share Analysis, by End-use Industry, 2022 and 2031
Figure 85: Middle East & Africa Oil Condition Monitoring Services Market Projections by Country and Sub-region, Value (US$ Mn), 2017-2031
Figure 86: Middle East & Africa Oil Condition Monitoring Services Market, Incremental Opportunity, by Country and Sub-region, Value (US$ Mn), 2022-2031
Figure 87: Middle East & Africa Oil Condition Monitoring Services Market Share Analysis, by Country and Sub-region, 2022 and 2031
Figure 88: South America Oil Condition Monitoring Services Market Size & Forecast, Value (US$ Mn), 2017-2031
Figure 89: South America Oil Condition Monitoring Services Market Overview, 2018-2031
Figure 90: South America Oil Condition Monitoring Services Market Projections by Service, Value (US$ Mn), 2017-2031
Figure 91: South America Oil Condition Monitoring Services Market, Incremental Opportunity, by Service, Value (US$ Mn ), 2022-2031
Figure 92: South America Oil Condition Monitoring Services Market Share Analysis, by Service, 2022 and 2031
Figure 93: South America Oil Condition Monitoring Services Market Projections by Fluid, Value (US$ Mn), 2017-2031
Figure 94: South America Oil Condition Monitoring Services Market, Incremental Opportunity, by Fluid, Value (US$ Mn), 2022-2031
Figure 95: South America Oil Condition Monitoring Services Market Share Analysis, by Fluid, 2022 and 2031
Figure 96: South America Oil Condition Monitoring Services Market Projections by Application, Value (US$ Mn ), 2017-2031
Figure 97: South America Oil Condition Monitoring Services Market, Incremental Opportunity, by Application, Value (US$ Mn ), 2022-2031
Figure 98: South America Oil Condition Monitoring Services Market Share Analysis, by Application, 2022 and 2031
Figure 99: South America Oil Condition Monitoring Services Market Projections by End-use Industry, Value (US$ Mn), 2017-2031
Figure 100: South America Oil Condition Monitoring Services Market, Incremental Opportunity, by End-use Industry, Value (US$ Mn), 2022-2031
Figure 101: South America Oil Condition Monitoring Services Market Share Analysis, by End-use Industry, 2022 and 2031
Figure 102: South America Oil Condition Monitoring Services Market Projections by Country and Sub-region, Value (US$ Mn), 2017-2031
Figure 103: South America Oil Condition Monitoring Services Market, Incremental Opportunity, by Country and Sub-region, Value (US$ Mn), 2022-2031
Figure 104: South America Oil Condition Monitoring Services Market Share Analysis, by Country and Sub-region, 2022 and 2031
Copyright © Transparency Market Research, Inc. All Rights reserved
Trust Online

Oil Condition Monitoring Services Market