Reports
Reports
The medical transcription services industry is witnessing steadiness owing to factors such as the demand for precise clinical documentation and the transition to electronic and digital patient records. One of the major factors driving traction within this market is the increased demand for lightening the administrative burden on healthcare practitioners in order to improve capacity and the quality of care they can provide.

However, the medical transcription services market faces a number of restraints due to apprehension about the protection and confidentiality with regards to complying to regulatory standards and consideration for data privacy, especially, when outsourcing this service as appropriate. Nonetheless, there will be opportunities around cloud based transcription software platforms, machine learning and natural language processing (NLP) solution to provide transcription and the growth of elective surgery programs in the emerging markets.
Further growth of the market is attributed to the increasing use of telemedicine as well as the sustainability to taxes and outsources transcription with regards to specialized fields such as radiology and cardiology. As integration of AI fine tunes transcription services, using a hybrid human machine transcription solution will likely have a sustainable competitive advantage
| Attribute | Detail |
|---|---|
| Market Drivers |
|

Rising demand for healthcare documentation is expected to propel the growth of medical transcription services market over the forecast period. The rapid increase in patient volume experienced by healthcare systems across the globe has created requirement for accurate, detailed, and timely clinical documentation. Administrators, no matter the size of their practice or institution, are urged to ensure that their physicians maintain accurate and comprehensive medical records.
The overall effect of extensive administrative workload is leading to healthcare providers proactively looking for transcription solutions to effectively deal with the amount of clinical data produced from patient encounters and tests, as well as treatment documentation of both - new and established patients.
Medical transcription services providers offer the conversion of physicians’ dictation into structured digital reports. This promotes the retention of accurate electronic patient record content while allowing facilities to alleviate the documentation burden on healthcare staff. Consequently, market expansion is taking place in both - developed and developing healthcare services markets, with reliable and scalable transcription services being sought.
An increased administrative burden on healthcare professionals is expected to drive the growth of the medical transcription services market. The amount of time that physicians and clinical staff spend on documentation, charting, and data entry is requiring attention to develop solutions that do not affect the accuracy of medical records. Medical transcription services prove effective by allowing the voice-recorded notes of doctors and staff to be transcribed into structured digital documents, thereby allowing them to spend less time in documentation and data entry and more time on patient care.
Healthcare systems across the continuum of care have to address an increasing amount of data with less time, and outsourcing transcription is seen as an effective remedy for reducing burnout, thereby increasing productivity and more importantly documenting in a timely manner.
Hospitals are dominating the medical transcription services market by end-user due to the absolute volume of patient encounters and the complexity of clinical documentation. Daily hospitals produce enormous amounts of medical data including physician notes, diagnostics, surgical notes, and instructions for discharge just to name a few.
The ability to efficiently manage patient data is paramount for continuity of care, regulatory requirements, and proper billing. Due to the complexity of clinical documentation hospitals have moved toward transcription service providers to reduce the burden of clinical documentation on medical professionals, and improve hospital operational efficiencies.
Additionally, the increased use and adoption of electronic health records (EHR) creates an increased need for accurate and contemporaneous clinical transcription, furthering hospitals as an end-user segment in the market.

| Attribute | Detail |
|---|---|
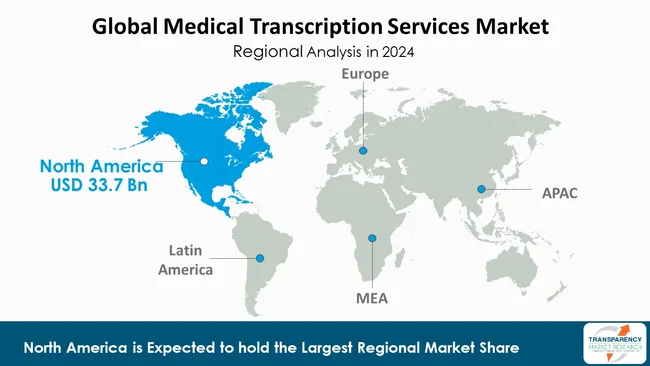
| Leading Region | North America |
The medical transcription services market's dominant region is North America, as it possesses the most advanced healthcare infrastructure, adoption of electronic health records (EHRs), and the presence of an excellent regulatory environment
The region has a high demand for accurate clinical documentation due to compliance issues (e.g. HIPAA). Additionally, administrative load for healthcare professionals continues to rise, and the increased outsourcing is helping them by reducing cost and improving productivity.
North America has the largest number of service providers, the earliest development and adoption of speech recognition technology and AI-based transcription, and the greatest number of healthcare institutions as well. All of these point to North America likely leading the medical transcription services market during the forecast period.
Acusis, Amberscript, Aquity Solutions, Caption First, Daily Transcription, Ditto Scribe, Eccellente Services Pvt. Ltd., EHR Transcriptions, GoTranscript, InSync Healthcare Solutions, Med-Scribe, MTBC, SmartMD, Voxtab, World Wide Dictation are amongst the prominent players in the global medical transcription services market.
Each of these players has been profiled in the medical transcription services market research report based on parameters such as company overview, financial overview, business strategies, product portfolio, business segments, and recent developments.
| Attribute | Detail |
|---|---|
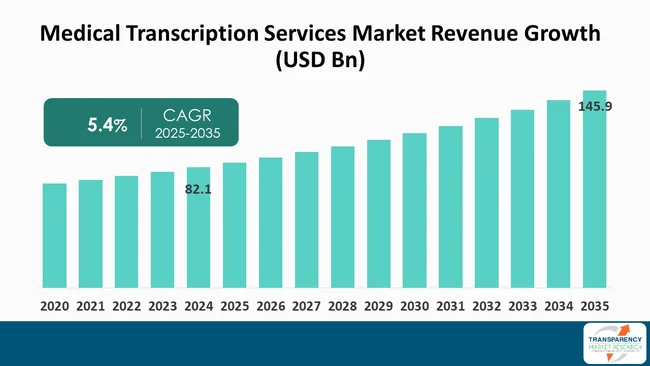
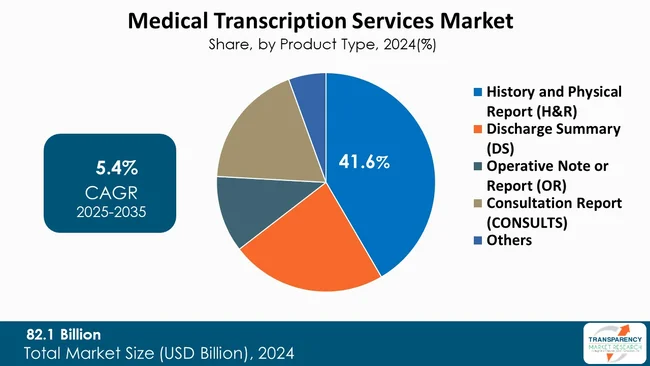
| Size in 2024 | US$ 82.1 Bn |
| Forecast Value in 2035 | US$ 145.9 Bn |
| CAGR | 5.4% |
| Forecast Period | 2025-2035 |
| Historical Data Available for | 2020–2023 |
| Quantitative Units | US$ Bn for Value |
| Market Analysis | It includes segment analysis as well as regional level analysis. Moreover, qualitative analysis includes drivers, restraints, opportunities, key trends, value chain analysis, and key trend analysis. |
| Competition Landscape |
|
| Format | Electronic (PDF) + Excel |
| Segmentation | Service Type
|
| Regions Covered |
|
| Countries Covered |
|
| Companies Profiled |
|
| Customization Scope | Available upon request |
| Pricing | Available upon request |
It was valued at US$ 82.1 Bn in 2024
It is projected to reach US$ 145.9 Bn by the end of 2035
Rising healthcare documentation needs, administrative burden on healthcare professionals and increased outsourcing by healthcare facilities
It is anticipated to grow at a CAGR of 5.4% from 2025 to 2035
North America is expected to account for the largest share from 2025 to 2035
Acusis, Amberscript, Aquity Solutions, Caption First, Daily Transcription, Ditto Scribe, Eccellente Services Pvt. Ltd., EHR Transcriptions, GoTranscript, InSync Healthcare Solutions, Med-Scribe, MTBC, SmartMD, Voxtab, World Wide Dictation, and others
Table 01: Global Market Value (US$ Bn) Forecast, By Service Type, 2020 to 2035
Table 02: Global Market Value (US$ Bn) Forecast, by Mode of Procurement, 2020 to 2035
Table 03: Global Market Value (US$ Bn) Forecast, By End-user, 2020 to 2035
Table 04: Global Market Value (US$ Bn) Forecast, By Region, 2020 to 2035
Table 05: North America Market Value (US$ Bn) Forecast, by Country, 2020-2035
Table 06: North America Market Value (US$ Bn) Forecast, By Service Type, 2020 to 2035
Table 07: North America Market Value (US$ Bn) Forecast, by Mode of Procurement, 2020 to 2035
Table 08: North America Market Value (US$ Bn) Forecast, By End-user, 2020 to 2035
Table 09: Europe Market Value (US$ Bn) Forecast, by Country / Sub-region, 2020-2035
Table 10: Europe Market Value (US$ Bn) Forecast, By Service Type, 2020 to 2035
Table 11: Europe Market Value (US$ Bn) Forecast, by Mode of Procurement, 2020 to 2035
Table 12: Europe Market Value (US$ Bn) Forecast, By End-user, 2020 to 2035
Table 13: Asia Pacific Market Value (US$ Bn) Forecast, by Country / Sub-region, 2020-2035
Table 14: Asia Pacific Market Value (US$ Bn) Forecast, By Service Type, 2020 to 2035
Table 15: Asia Pacific Market Value (US$ Bn) Forecast, by Mode of Procurement, 2020 to 2035
Table 16: Asia Pacific Market Value (US$ Bn) Forecast, By End-user, 2020 to 2035
Table 17: Latin America Market Value (US$ Bn) Forecast, by Country / Sub-region, 2020-2035
Table 18: Latin America Market Value (US$ Bn) Forecast, By Service Type, 2020 to 2035
Table 19: Latin America Market Value (US$ Bn) Forecast, by Mode of Procurement, 2020 to 2035
Table 20: Latin America Market Value (US$ Bn) Forecast, By End-user, 2020 to 2035
Table 21: Middle East & Africa Market Value (US$ Bn) Forecast, by Country / Sub-region, 2020-2035
Table 22: Middle East & Africa Market Value (US$ Bn) Forecast, By Service Type, 2020 to 2035
Table 23: Middle East & Africa Market Value (US$ Bn) Forecast, by Mode of Procurement, 2020 to 2035
Table 24: Middle East & Africa Market Value (US$ Bn) Forecast, By End-user, 2020 to 2035
Figure 01: Global Market Value Share Analysis, By Service Type, 2024 and 2035
Figure 02: Global Market Attractiveness Analysis, By Service Type, 2025 to 2035
Figure 03: Global Market Revenue (US$ Mn), by History and Physical Report (H&R), 2020 to 2035
Figure 04: Global Market Revenue (US$ Mn), by Discharge Summary (DS), 2020 to 2035
Figure 05: Global Market Revenue (US$ Mn), by Operative Note or Report (OR), 2020 to 2035
Figure 06: Global Market Revenue (US$ Mn), by Consultation Report (CONSULTS), 2020 to 2035
Figure 07: Global Market Revenue (US$ Mn), by Others 2020 to 2035
Figure 08: Global Market Value Share Analysis, by Mode of Procurement, 2024 and 2035
Figure 09: Global Market Attractiveness Analysis, by Mode of Procurement, 2025 to 2035
Figure 10: Global Market Revenue (US$ Mn), by Outsourcing, 2020 to 2035
Figure 11: Global Market Revenue (US$ Mn), by Offshoring, 2020 to 2035
Figure 12: Global Market Value Share Analysis, By End-user, 2024 and 2035
Figure 13: Global Market Attractiveness Analysis, By End-user, 2025 to 2035
Figure 14: Global Market Revenue (US$ Mn), by Hospitals, 2020 to 2035
Figure 15: Global Market Revenue (US$ Mn), by Clinical/Pathology Laboratories, 2020 to 2035
Figure 16: Global Market Revenue (US$ Mn), by Physician Clinics, 2020 to 2035
Figure 17: Global Market Revenue (US$ Mn), by Others, 2020 to 2035
Figure 18: Global Market Value Share Analysis, By Region, 2024 and 2035
Figure 19: Global Market Attractiveness Analysis, By Region, 2025 to 2035
Figure 20: North America Market Value (US$ Mn) Forecast, 2020 to 2035
Figure 21: North America Market Value Share Analysis, by Country, 2024 and 2035
Figure 22: North America Market Attractiveness Analysis, by Country, 2025 to 2035
Figure 23: North America Market Value Share Analysis, By Service Type, 2024 and 2035
Figure 24: North America Market Attractiveness Analysis, By Service Type, 2025 to 2035
Figure 25: North America Market Value Share Analysis, by Mode of Procurement, 2024 and 2035
Figure 26: North America Market Attractiveness Analysis, by Mode of Procurement, 2025 to 2035
Figure 27: North America Market Value Share Analysis, By End-user, 2024 and 2035
Figure 28: North America Market Attractiveness Analysis, By End-user, 2025 to 2035
Figure 29: Europe Market Value (US$ Mn) Forecast, 2020 to 2035
Figure 30: Europe Market Value Share Analysis, by Country / Sub-region, 2024 and 2035
Figure 31: Europe Market Attractiveness Analysis, by Country / Sub-region, 2025 to 2035
Figure 32: Europe Market Value Share Analysis, By Service Type, 2024 and 2035
Figure 33: Europe Market Attractiveness Analysis, By Service Type, 2025 to 2035
Figure 34: Europe Market Value Share Analysis, by Mode of Procurement, 2024 and 2035
Figure 35: Europe Market Attractiveness Analysis, by Mode of Procurement, 2025 to 2035
Figure 36: Europe Market Value Share Analysis, By End-user, 2024 and 2035
Figure 37: Europe Market Attractiveness Analysis, By End-user, 2025 to 2035
Figure 38: Asia Pacific Market Value (US$ Mn) Forecast, 2020 to 2035
Figure 39: Asia Pacific Market Value Share Analysis, by Country/Sub-region, 2024 and 2035
Figure 40: Asia Pacific Market Attractiveness Analysis, by Country/Sub-region, 2025 to 2035
Figure 41: Asia Pacific Market Value Share Analysis, By Service Type, 2024 and 2035
Figure 42: Asia Pacific Market Attractiveness Analysis, By Service Type, 2025 to 2035
Figure 43: Asia Pacific Market Value Share Analysis, by Mode of Procurement, 2024 and 2035
Figure 44: Asia Pacific Market Attractiveness Analysis, by Mode of Procurement, 2025 to 2035
Figure 45: Asia Pacific Market Value Share Analysis, By End-user, 2024 and 2035
Figure 46: Asia Pacific Market Attractiveness Analysis, By End-user, 2025 to 2035
Figure 47: Latin America Market Value (US$ Mn) Forecast, 2020 to 2035
Figure 48: Latin America Market Value Share Analysis, by Country / Sub-region, 2024 and 2035
Figure 49: Latin America Market Attractiveness Analysis, by Country / Sub-region, 2025 to 2035
Figure 50: Latin America Market Value Share Analysis, By Service Type, 2024 and 2035
Figure 51: Latin America Market Attractiveness Analysis, By Service Type, 2025 to 2035
Figure 52: Latin America Market Value Share Analysis, by Mode of Procurement, 2024 and 2035
Figure 53: Latin America Market Attractiveness Analysis, by Mode of Procurement, 2025 to 2035
Figure 54: Latin America Market Value Share Analysis, By End-user, 2024 and 2035
Figure 55: Latin America Market Attractiveness Analysis, By End-user, 2025 to 2035
Figure 56: Middle East & Africa Market Value (US$ Mn) Forecast, 2020 to 2035
Figure 57: Middle East & Africa Market Value Share Analysis, by Country / Sub-region, 2024 and 2035
Figure 58: Middle East & Africa Market Attractiveness Analysis, by Country / Sub-region, 2025 to 2035
Figure 59: Middle East & Africa Market Value Share Analysis, By Service Type, 2024 and 2035
Figure 60: Middle East & Africa Market Attractiveness Analysis, By Service Type, 2025 to 2035
Figure 61: Middle East & Africa Market Value Share Analysis, by Mode of Procurement, 2024 and 2035
Figure 62: Middle East & Africa Market Attractiveness Analysis, by Mode of Procurement, 2025 to 2035
Figure 63: Middle East & Africa Market Value Share Analysis, By End-user, 2024 and 2035
Figure 64: Middle East & Africa Market Attractiveness Analysis, By End-user, 2025 to 2035