
Reports
Reports
COVID-19 Impact on Food Supply Chain and Livestock Production
The pandemic negatively affected the livestock sector by impacting their production, consumption of livestock products, and food security. This global economic crisis is responsible for the disruption in food supply and demand. This stress has been reduced since coronavirus cases have significantly reduced worldwide. Stakeholders in the livestock cake market are effortlessly working on increasing the production of livestock animals. Agricultural professionals and manufacturers are taking help of governments to stay financially afloat by increasing the productivity of farm animals. Manufacturers operating in the livestock cake market are ensuring product quality and food safety to overcome challenges of COVID-19 disruption. Market players are ensuring business continuity with the help of technological advancements in livestock farming.
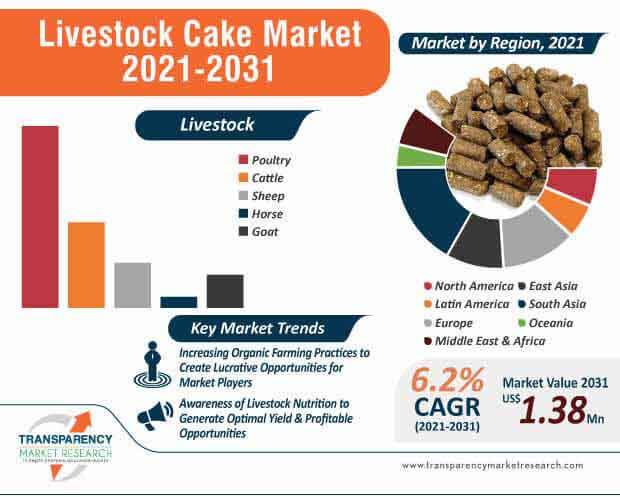
Increasing Popularity of Organic Farming Drives Livestock Cake Market
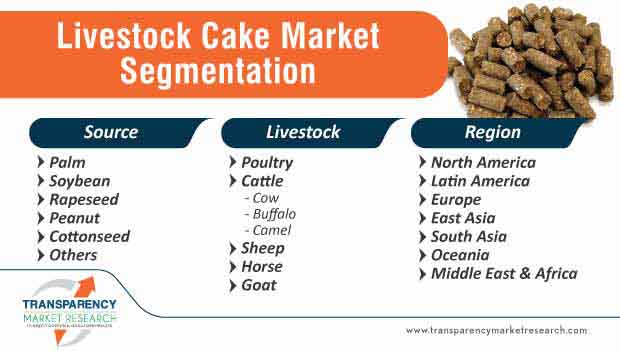
Agricultural practitioners are focusing on organic farming due to the increasing awareness about organic food products in consumers. There is an increasing demand for nutritional food due to rising health concerns across the globe. With the rapidly spreading coronavirus and its impact on immunity systems, people are more conscious about the food they eat. The surging demand for organic food products, protein-rich diet, dairy products, meat, etc. are boosting the popularity of organic farming. Livestock cakes can be widely used as fertilizers to provide strength to crops, and make them free from pests. Oilseeds, owing to their abundant nutrient content and herbicidal and pesticide properties, responsible for increasing fertility of the land. Livestock cakes produced from soya bean, groundnut, cottonseed, rapeseed, palm, etc. can be increasingly used as animal feed as well as plant fertilizers. Oilseed cake is used for increasing soil productivity, and in biogas production.
Rising Demand for Livestock Cake in Animal Feed Industry
The livestock cake market is expected to cross US$ 1.38 Bn by 2031. Livestock cakes are the perfect feed for animals to fulfill their protein needs. Livestock cakes, due to the presence of high-value proteins, fiber, fats, and all the necessary nutrients, beneficial for growth and productivity of animals, which, in turn, is driving the global livestock cake market. Farmers are targeting on maintaining good health and metabolism by feeding them high quality nutritional diet to produce optimal yields. The increasing R&D activities in livestock nutrition are responsible for the growing demand for livestock cake globally. Developing countries are spreading awareness about the health of farm animals. The increasing acceptance of feed-premixes made from oil extraction of different crops is responsible for the production of good quality dairy, meat, etc. Farmers are investing in livestock cakes to reduce the risk of diseases in farm animals due to unsafe feed.
Livestock Farming Trends Creating Value-grab opportunities
With rising population and urbanization, there is an increasing demand for healthy food across the globe. There are consistently changing patterns can be observed in food consumption, especially the demand for livestock products. In order to cater to these demands for safe and nutritious food, many developing countries are investing in and promoting awareness about livestock farming. Rising demand for meat and dairy products due to their high protein content positively influence the farmers to practice livestock farming. Beyond its economic value, livestock farming supports the livelihoods and provides food security to almost 1.3 billion people. Farmers are acquiring innovative techniques to produce high yield by allowing them into open space to observe their natural behavior. Livestock farming, being one of the sustainable livestock production systems promotes animal welfare and provides economic benefits. These factors are likely to drive the livestock cake market.
Analysts’ Viewpoint
Due to disruptions caused by the COVID-19 pandemic, manufacturers are boosting their production capabilities to ensure business continuity. Livestock cakes can be used as fertilizers to improve soil quality and reduce risks of pests, hence boosting productivity. Manufacturers in the livestock cake market should focus on increasing awareness about animal welfare, food safety, and producing high quality yields using livestock farming. Industrialization, growth in urban population, and increase in demand for livestock products in Asia Pacific, North America, and Europe are anticipated to drive the demand for animal feed and livestock cakes. The increasing awareness about health and food security across the globe also contributes to the global market growth.
Livestock Cake Market: Overview
Livestock Cake: Market Frontrunners
Livestock Cake Market: Trends
Livestock Cake Market: Strategies
Livestock Cake Market: Key Players
Livestock Cake Market Snapshot
|
Attribute |
Detail |
|
Market Size Value in 2021 (Base Year) |
US$ 755 Mn |
|
Market Forecast Value in 2031 |
US$ 1.38 Mn |
|
Growth Rate (CAGR) |
6.2% |
|
Forecast Period |
2021-2031 |
|
Quantitative Units |
US$ Mn for Value & Tons for Volume |
|
Market Analysis |
It includes cross segment analysis at global as well as regional level. Furthermore, qualitative analysis includes drivers, restraints, opportunities, key trends, Porters Five Forces analysis, supply chain analysis, parent industry overview, etc. |
|
Competition Landscape |
|
|
Format |
Electronic (PDF) + Excel |
|
Market Segmentation |
|
|
Regions Covered |
|
|
Countries Covered |
|
|
Companies Profiled |
|
|
Customization Scope |
Available upon Request |
|
Pricing |
Available upon Request |
In 2021, Livestock Cake Market was valued at US$ 210.3 Mn
Livestock Cake Market is expected to Reach US$ 1.38 Bn In 2031
Increasing popularity of organic farming is expected to drive the Livestock Cake Market
Asia Pacific is more attractive for vendors in the Livestock Cake Market
Key players of Livestock Cake Market are Archer Daniels Midland Company, Ruchi Soya Industries Ltd., Louis Dreyfus Company, Tirumalla Oil Cake, DHN International, Bunge Limited, Indian Hydrocolloids, Dhofar Cattle Feed Co, ALSAYER Holding, Al Ghurair Investment LLC
1. Executive Summary
1.1. Global Market Outlook
1.2. Demand Side Trends
1.3. Supply Side Trends
1.4. Analysis and Recommendations
2. Market Overview
2.1. Market Coverage / Taxonomy
2.2. Market Definition / Scope / Limitations
2.3. Inclusion and Exclusions
3. Key Market Trends
3.1. Key Trends Impacting the Market
3.1.1. High Yield Feed Ingredients Demand
3.1.2. Feed Milling & Processing Trends
3.1.3. High Demand for Meat, Dairy and Egg Products
3.2. Product Innovation / Development Trends
4. Key Success Factors
4.1. Product Adoption / Usage Analysis
4.2. Strategic Promotional Strategies
5. Global Livestock Cake Market Demand (In Volume Units) Analysis 2016–2020 and Forecast, 2021–2031
5.1. Historical Market (Volume) Analysis, 2016–2020
5.2. Current and Future Market (Volume) Projections, 2021–2031
6. Global Livestock Cake Market - Pricing Analysis
6.1. Regional Pricing Analysis
6.2. Global Average Pricing Analysis Benchmark
7. Global Livestock Cake Market Demand Value (US$ Mn) Analysis 2016–2020 and Forecast, 2021–2031
7.1. Historical Market Value (US$ Mn) Analysis, 2016–2020
7.2. Current and Future Market Value (US$ Mn) Projections, 2021–2031
7.2.1. Y-o-Y Growth Trend Analysis
7.2.2. Absolute $ Opportunity Analysis
8. Market Background
8.1. Macro-Economic Factors
8.1.1. Global GDP Growth Outlook
8.1.2. Global Industry Value Added
8.1.3. Global Urbanization Growth Outlook
8.1.4. Global Food Security Index
8.1.5. Global Rank – Ease of Doing Business
8.1.6. Global Rank – Trading Across Borders
8.2. Covid-19 Impact on Animal Feed Industry
8.2.1. Manufacturers/ Processors
8.2.2. Supply Chain and Logistics
8.2.3. Wholesalers/ Traders
8.2.4. Retailers
8.3. Animal Feed Manufacturing Industry Outlook
8.4. Impact of COVID-19 on Livestock cake Production
8.4.1. Manufacturer/processors
8.4.2. Supply chain and logistics
8.4.3. Wholesaler/Traders
8.4.4. Retailers
8.5. Industry Value Chain Analysis
8.5.1. Profit Margin Analysis at each point of sales
8.5.1.1. Livestock cake Market Processors
8.5.1.2. Distributors/Suppliers/Wholesalers
8.5.1.3. Traders/Retailers
8.5.1.4. End-Users
8.6. COVID-19 Risk Assessment/Impact
8.7. Label Claims
8.8. Key Regulations
8.9. Market Dynamics
8.9.1. Drivers
8.9.2. Restraints
8.9.3. Opportunity Analysis
8.10. Forecast Factors - Relevance & Impact
9. Global Livestock Cake Market Analysis 2016–2020 and Forecast 2021–2031, By Source
9.1. Introduction / Key Findings
9.2. Historical Livestock Cake Market (US$ Mn) Analysis By Source, 2016–2020
9.3. Current and Future Livestock Cake Market (US$ Mn) Analysis and Forecast By Source, 2021–2031
9.3.1. Palm
9.3.2. Soybean
9.3.3. Sunflower
9.3.4. Rapeseed
9.3.5. Peanut
9.3.6. Cottonseed
9.3.7. Others
9.4. Specialty Market Attractiveness Analysis By Source
10. Global Livestock Cake Market Analysis 2016–2020 and Forecast 2021–2031, by Livestock
10.1. Introduction
10.2. Historical Livestock Cake Market (US$ Mn) Analysis By Livestock, 2016 - 2020
10.3. Current Livestock Cake Market (US$ Mn) Analysis and Forecast By Livestock, 2021 - 2031
10.3.1. Poultry
10.3.2. Cattle
10.3.2.1. Cow
10.3.2.2. Buffalo
10.3.2.3. Camel
10.3.3. Sheep
10.3.4. Goat
10.3.5. Horse
10.4. Market Attractiveness Analysis By Livestock
11. Global Livestock Cake Market Analysis 2016–2020 and Forecast 2021–2031, by Region
11.1. Introduction
11.2. Historical Livestock Cake Market (US$ Mn) Analysis By Region, 2016 - 2020
11.3. Current Livestock Cake Market (US$ Mn) Analysis and Forecast By Region, 2021 - 2031
11.3.1. North America
11.3.2. Latin America
11.3.3. Europe
11.3.4. East Asia
11.3.5. South Asia
11.3.6. Oceania
11.3.7. Middle East and Africa (MEA)
11.4. Market Attractiveness Analysis By Region
12. North America Livestock Cake Market Analysis 2016–2020 and Forecast 2021–2031
12.1. Introduction
12.2. Historical Market Value (US$ Mn) Trend Analysis By Market Taxonomy, 2016–2020
12.3. Market Value (US$ Mn) Forecast By Market Taxonomy, 2021–2031
12.3.1. By Country
12.3.1.1. U.S.
12.3.1.2. Canada
12.3.2. By Source
12.3.3. By Livestock
12.4. Market Attractiveness Analysis
13. Latin America Livestock Cake Market Analysis 2016–2020 and Forecast 2021–2031
13.1. Introduction
13.2. Historical Market Value (US$ Mn) Trend Analysis By Market Taxonomy, 2016 - 2020
13.3. Market Value (US$ Mn) Forecast By Market Taxonomy, 2021–2031
13.3.1. By Country
13.3.1.1. Brazil
13.3.1.2. Mexico
13.3.1.3. Rest of Latin America
13.3.2. By Source
13.3.3. By Livestock
13.4. Market Attractiveness Analysis
14. Europe Livestock Cake Market Analysis 2016–2020 and Forecast 2021–2031
14.1. Introduction
14.2. Historical Market Value (US$ Mn) Trend Analysis By Market Taxonomy, 2016–2020
14.3. Market Value (US$ Mn) Forecast By Market Taxonomy2021–2031
14.3.1. By Country
14.3.1.1. Germany
14.3.1.2. Italy
14.3.1.3. France
14.3.1.4. U.K.
14.3.1.5. Spain
14.3.1.6. Benelux
14.3.1.7. Nordic
14.3.1.8. Russia
14.3.1.9. Poland
14.3.1.10. Rest of Europe
14.3.2. By Source
14.3.3. By Livestock
14.4. Market Attractiveness Analysis
15. South Asia Livestock Cake Market Analysis 2016–2020 and Forecast 2021–2031
15.1. Introduction
15.2. Historical Market Value (US$ Mn) Trend Analysis By Market Taxonomy, 2016–2020
15.3. Market Value (US$ Mn) Forecast By Market Taxonomy2021–2031
15.3.1. By Country
15.3.1.1. India
15.3.1.2. Thailand
15.3.1.3. Indonesia
15.3.1.4. Malaysia
15.3.1.5. Rest of South Asia
15.3.2. By Source
15.3.3. By Livestock
15.4. Market Attractiveness Analysis
16. East Asia Livestock Cake Market Analysis 2016–2020 and Forecast 2021–2031
16.1. Introduction
16.2. Historical Market Value (US$ Mn) Trend Analysis By Market Taxonomy, 2016–2020
16.3. Market Value (US$ Mn) Forecast By Market Taxonomy, 2021–2031
16.3.1. By Country
16.3.1.1. China
16.3.1.2. Japan
16.3.1.3. South Korea
16.3.2. By Source
16.3.3. By Livestock
16.4. Market Attractiveness Analysis
17. Oceania Livestock Cake Market Analysis 2016–2020 and Forecast 2021–2031
17.1. Introduction
17.2. Historical Market Value (US$ Mn) Trend Analysis By Market Taxonomy, 2016–2020
17.3. Market Value (US$ Mn) Forecast By Market Taxonomy, 2021–2031
17.3.1. By Country
17.3.1.1. Australia
17.3.1.2. New Zealand
17.3.2. By Source
17.3.3. By Livestock
17.4. Market Attractiveness Analysis
18. Middle East and Africa Livestock Cake Market Analysis 2016–2020 and Forecast 2021–2031
18.1. Introduction
18.2. Historical Market Value (US$ Mn) Trend Analysis By Value Taxonomy, 2016–2020
18.3. Market Material (US$ Mn) Forecast By Market Taxonomy, 2021–2031
18.3.1. By Country
18.3.1.1. GCC Countries
18.3.1.2. South Africa
18.3.1.3. Rest of Middle East and Africa
18.3.2. By Source
18.3.3. By Livestock
18.4. Market Attractiveness Analysis
19. Market Structure Analysis
19.1. Market Analysis by Tier of Companies
19.2. Market Concentration
19.3. Market Share Analysis of Top Players
19.4. Market Presence Analysis
20. Competition Analysis
20.1. Competition Dashboard
20.2. Competition Benchmarking
20.3. Competition Deep Dive
20.3.1. Archer Daniels Midland Company
20.3.1.1. Overview
20.3.1.2. Product Portfolio
20.3.1.3. Sales Footprint
20.3.1.4. Key Developments
20.3.1.5. Strategy Overview
20.3.2. Ruchi Soya Industries Ltd.
20.3.2.1. Overview
20.3.2.2. Product Portfolio
20.3.2.3. Sales Footprint
20.3.2.4. Key Developments
20.3.2.5. Strategy Overview
20.3.3. Louis Dreyfus Company
20.3.3.1. Overview
20.3.3.2. Product Portfolio
20.3.3.3. Sales Footprint
20.3.3.4. Key Developments
20.3.3.5. Strategy Overview
20.3.4. Tirumalla Oil Cake
20.3.4.1. Overview
20.3.4.2. Product Portfolio
20.3.4.3. Sales Footprint
20.3.4.4. Key Developments
20.3.4.5. Strategy Overview
20.3.5. DHN International
20.3.5.1. Overview
20.3.5.2. Product Portfolio
20.3.5.3. Sales Footprint
20.3.5.4. Key Developments
20.3.5.5. Strategy Overview
20.3.6. Bunge Limited
20.3.6.1. Overview
20.3.6.2. Product Portfolio
20.3.6.3. Sales Footprint
20.3.6.4. Key Developments
20.3.6.5. Strategy Overview
20.3.7. Indian Hydrocolloids
20.3.7.1. Overview
20.3.7.2. Product Portfolio
20.3.7.3. Sales Footprint
20.3.7.4. Key Developments
20.3.7.5. Strategy Overview
20.3.8. Dhofar Cattle Feed Co.
20.3.8.1. Overview
20.3.8.2. Product Portfolio
20.3.8.3. Sales Footprint
20.3.8.4. Key Developments
20.3.8.5. Strategy Overview
20.3.9. ALSAYER Holding
20.3.9.1. Overview
20.3.9.2. Product Portfolio
20.3.9.3. Sales Footprint
20.3.9.4. Key Developments
20.3.9.5. Strategy Overview
20.3.10. Al Ghurair Investment LLC.
20.3.10.1. Overview
20.3.10.2. Product Portfolio
20.3.10.3. Sales Footprint
20.3.10.4. Key Developments
20.3.10.5. Strategy Overview
20.3.11. Others.
21. Assumptions and Acronyms Used
22. Research Methodology
List of Tables
Table 01: Global Livestock Cake Market Value (US$ Mn) Analysis and Forecast by Source, 2016-2031
Table 02: Global Livestock Cake Market Volume (Tons) Analysis and Forecast by Source, 2016-2031
Table 03: Global Livestock Cake Market Value (US$ Mn) Analysis and Forecast by Livestock, 2016-2031
Table 04: Global Livestock Cake Market Volume (Tons) Analysis and Forecast by Livestock, 2016-2031
Table 05: Global Livestock Cake Market Value (US$ Mn) Analysis and Forecast by Livestock, 2016-2031
Table 06: Global Livestock Cake Market Volume (Tons) Analysis and Forecast by Livestock, 2016-2031
Table 07: Livestock Cake Market Value (US$ Mn) Analysis and Forecast by Region, 2016-2031
Table 08: Global Livestock Cake Market Volume (Tons) Analysis and Forecast by Region, 2016-2031
Table 09: North America Livestock Cake Market Value (US$ Mn) Analysis and Forecast by Source, 2016-2031
Table 10: North America Livestock Cake Market Volume (Tons) Analysis and Forecast by Source, 2016-2031
Table 11: North America Livestock Cake Market Value (US$ Mn) Analysis and Forecast by Livestock, 2016-2031
Table 12: North America Livestock Cake Market Volume (Tons) Analysis and Forecast by Livestock, 2016-2031
Table 13: North America Livestock Cake Market Value (US$ Mn) Analysis and Forecast by Livestock, 2016-2031
Table 14: North America Livestock Cake Market Volume (Tons) Analysis and Forecast by Livestock, 2016-2031
Table 15: North America Livestock Cake & Herbs Market Value (US$ Mn) Analysis and Forecast by Country, 2016–2031
Table 16: North America Livestock Cake & Herbs Market Volume (Tons) Analysis and Forecast by Country, 2016–2031
Table 17: Latin America Livestock Cake Market Value (US$ Mn) Analysis and Forecast by Source, 2016-2031
Table 18: Latin America Livestock Cake Market Volume (Tons) Analysis and Forecast by Source, 2016-2031
Table 19: Latin America Livestock Cake Market Value (US$ Mn) Analysis and Forecast by Livestock, 2016-2031
Table 20: Latin America Livestock Cake Market Volume (Tons) Analysis and Forecast by Livestock, 2016-2031
Table 21: Latin America Livestock Cake Market Value (US$ Mn) Analysis and Forecast by Livestock, 2016-2031
Table 22: Latin America Livestock Cake Market Volume (Tons) Analysis and Forecast by Livestock, 2016-2031
Table 23: Latin America Livestock Cake Market Value (US$ Mn) Analysis and Forecast by Country, 2015–2030
Table 24: Latin America Livestock Cake Market Volume (Tons) Analysis and Forecast by Country, 2016–2031
Table 25: Europe Livestock Cake Market Value (US$ Mn) Analysis and Forecast by Source, 2016-2031
Table 26: Europe Livestock Cake Market Volume (Tons) Analysis and Forecast by Source, 2016-2031
Table 27: Europe Livestock Cake Market Value (US$ Mn) Analysis and Forecast by Livestock, 2016-2031
Table 28: Europe Livestock Cake Market Volume (Tons) Analysis and Forecast by Livestock, 2016-2031
Table 29: Europe Livestock Cake Market Value (US$ Mn) Analysis and Forecast by Livestock, 2016-2031
Table 30: Europe Livestock Cake Market Volume (Tons) Analysis and Forecast by Livestock, 2016-2031
Table 31: Europe Spice Market Value (US$ Mn) Analysis and Forecast by Country, 2016-2031
Table 32: Europe Spice Market Volume (Tons) Analysis and Forecast by Country, 2016-2031
Table 33: South Asia Livestock Cake Market Value (US$ Mn) Analysis and Forecast by Source, 2016-2031
Table 34: South Asia Livestock Cake Market Volume (Tons) Analysis and Forecast by Source, 2016-2031
Table 35: South Asia Livestock Cake Market Value (US$ Mn) Analysis and Forecast by Livestock, 2016-2031
Table 36: South Asia Livestock Cake Market Volume (Tons) Analysis and Forecast by Livestock, 2016-2031
Table 37: South Asia Livestock Cake Market Value (US$ Mn) Analysis and Forecast by Livestock, 2016-2031
Table 38: South Asia Livestock Cake Market Volume (Tons) Analysis and Forecast by Livestock, 2016-2031
Table 39: South Asia Spice Market Value (US$ Mn) Analysis and Forecast by Country, 2016–2031
Table 40: South Asia Spice Market Volume (Tons) Analysis and Forecast by Country, 2016–2031
Table 41: East Asia Livestock Cake Market Value (US$ Mn) Analysis and Forecast by Source, 2016-2031
Table 42: East Asia Livestock Cake Market Volume (Tons) Analysis and Forecast by Source, 2016-2031
Table 43: East Asia Livestock Cake Market Value (US$ Mn) Analysis and Forecast by Livestock, 2016-2031
Table 44: East Asia Livestock Cake Market Volume (Tons) Analysis and Forecast by Livestock, 2016-2031
Table 45: East Asia Livestock Cake Market Value (US$ Mn) Analysis and Forecast by Livestock, 2016-2031
Table 46: East Asia Livestock Cake Market Volume (Tons) Analysis and Forecast by Livestock, 2016-2031
Table 47: East Asia Livestock Cake Market Value (US$ Mn) Analysis and Forecast by Country, 2016–2031
Table 48: East Asia Livestock Cake Market Volume (Tons) Analysis and Forecast by Country, 2016–2031
Table 49: Oceania Livestock Cake Market Value (US$ Mn) Analysis and Forecast by Source, 2016-2031
Table 50: Oceania Livestock Cake Market Volume (Tons) Analysis and Forecast by Source, 2016-2031
Table 51: Oceania Livestock Cake Market Value (US$ Mn) Analysis and Forecast by Livestock, 2016-2031
Table 52: Oceania Livestock Cake Market Volume (Tons) Analysis and Forecast by Livestock, 2016-2031
Table 53: Oceania Livestock Cake Market Value (US$ Mn) Analysis and Forecast by Livestock, 2016-2031
Table 54: Oceania Livestock Cake Market Volume (Tons) Analysis and Forecast by Livestock, 2016-2031
Table 55: Oceania Livestock Cake Market Value (US$ Mn) Analysis and Forecast by Country, 2016–2031
Table 56: Oceania Livestock Cake Market Volume (Tons) Analysis and Forecast by Country, 2016–2031
Table 57: Middle East & Africa Livestock Cake Market Value (US$ Mn) Analysis and Forecast by Source, 2016-2031
Table 58: Middle East & Africa Livestock Cake Market Volume (Tons) Analysis and Forecast by Source, 2016-2031
Table 59: Middle East & Africa Livestock Cake Market Value (US$ Mn) Analysis and Forecast by Livestock, 2016-2031
Table 60: Middle East & Africa Livestock Cake Market Volume (Tons) Analysis and Forecast by Livestock, 2016-2031
Table 61: Middle East & Africa Livestock Cake Market Value (US$ Mn) Analysis and Forecast by Livestock, 2016-2031
Table 62: Middle East & Africa Livestock Cake Market Volume (Tons) Analysis and Forecast by Livestock, 2016-2031
Table 63: Middle East & Africa Livestock Cake Market Value (US$ Mn) Analysis and Forecast by Country, 2016–2031
Table 64: Middle East & Africa Livestock Cake Market Volume (Tons) Analysis and Forecast by Country, 2016–2031
List of figures
Figure 01: Global Livestock Cake Market Value (US$ Mn) Forecast, 2021–2031
Figure 02: Global Livestock Cake Market Volume (Tons) Forecast, 2021–2031
Figure 03: Global Livestock Cake Market Value Share Analysis by Source, 2021 E
Figure 04: Global Livestock Cake Market Y-o-Y Growth Rate by Source, 2021-2031
Figure 05: Global Livestock Cake Market Value (US$ Mn) Analysis & Forecast by Source, 2021–2031
Figure 06: Global Livestock Cake Market Volume (Tons) Analysis & Forecast by Source, 2021–2031
Figure 07: Global Livestock Cake Market Value Share Analysis by Livestock, 2021 E
Figure 08: Global Livestock Cake Market Y-o-Y Growth Rate by Livestock, 2021-2031
Figure 09: Global Livestock Cake Market Value (US$ Mn) Analysis & Forecast by Livestock, 2021–2031
Figure 10: Global Livestock Cake Market Volume (Tons) Analysis & Forecast by Livestock, 2021–2031
Figure 11: Global Livestock Cake Market Value Share Analysis by Region, 2021 E
Figure 12: Global Livestock Cake Market Y-o-Y Growth Rate by Region, 2021-2031
Figure 13: Global Livestock Cake Market Value (US$ Mn) Analysis & Forecast by Region, 2021–2031
Figure 14: Global Livestock Cake Market Volume (Tons) Analysis & Forecast by Region, 2021–2031
Figure 15: Global Livestock Cake Market Attractiveness Analysis by Region, 2021-2031
Figure 16: Global Livestock Cake Market Attractiveness Analysis by Source, 2021-2031
Figure 17: Global Livestock Cake Market Attractiveness Analysis by Livestock, 20201-2031
Figure 18: North America Livestock Cake Market Value (US$ Mn) Analysis & Forecast by Source, 2021–2031
Figure 19: North America Livestock Cake Market Volume (Tons) Analysis & Forecast by Source, 2021–2031
Figure 20: North America Livestock Cake Market Value (US$ Mn) Analysis & Forecast by Livestock, 2021–2031
Figure 21: North America Livestock Cake Market Volume (Tons) Analysis & Forecast by Livestock, 2021–2031
Figure 22: North America Livestock Cake Market Value (US$ Mn) Analysis & Forecast by Country, 2021–2031
Figure 23: North America Livestock Cake Market Volume (Tons) Analysis & Forecast by Country, 2021–2031
Figure 24: North America Livestock Cake Market Attractiveness Analysis by Country, 2021-2031
Figure 25: North America Livestock Cake Market Attractiveness Analysis by Source, 2021-2031
Figure 26: North America Livestock Cake Market Attractiveness Analysis by Livestock, 2021-2031
Figure 27: Latin America Livestock Cake Market Value (US$ Mn) Analysis & Forecast by Source, 2021–2031
Figure 28: Latin America Livestock Cake Market Volume (Tons) Analysis & Forecast by Source, 2021–2031
Figure 29: Latin America Livestock Cake Market Value (US$ Mn) Analysis & Forecast by Livestock, 2021–2031
Figure 30: Latin America Livestock Cake Market Volume (Tons) Analysis & Forecast by Livestock, 2021–2031
Figure 31: Latin America Livestock Cake Market Value (US$ Mn) Analysis & Forecast by Country, 2021–2031
Figure 32: Latin America Livestock Cake Market Volume (Tons) Analysis & Forecast by Country, 2021–2031
Figure 33: Latin America Livestock Cake Market Attractiveness Analysis by Country, 2021-2031
Figure 34: Latin America Livestock Cake Market Attractiveness Analysis by Source, 2021-2031
Figure 35: Latin America Livestock Cake Market Attractiveness Analysis by Livestock, 2021-2031
Figure 36: Europe Livestock Cake Market Value (US$ Mn) Analysis & Forecast by Source, 2021–2031
Figure 37: Europe Livestock Cake Market Volume (Tons) Analysis & Forecast by Source, 2021–2031
Figure 38: Europe Livestock Cake Market Value (US$ Mn) Analysis & Forecast by Livestock, 2021–2031
Figure 39: Europe Livestock Cake Market Volume (Tons) Analysis & Forecast by Livestock, 2021–2031
Figure 40: Europe Livestock Cake Market Value (US$ Mn) Analysis & Forecast by Country, 2021-2031
Figure 41: Europe Livestock Cake Market Volume (Tons) Analysis & Forecast by Country, 2021-2031
Figure 42: Europe Livestock Cake Market Attractiveness Analysis by Country, 2021-2031
Figure 43: Europe Livestock Cake Market Attractiveness Analysis by Source, 2021-2031
Figure 44: Europe Livestock Cake Market Attractiveness Analysis by Livestock, 2021-2031
Figure 45: South Asia Livestock Cake Market Value (US$ Mn) Analysis & Forecast by Source, 2021–2031
Figure 46: South Asia Livestock Cake Market Volume (Tons) Analysis & Forecast by Source, 2021–2031
Figure 47: South Asia Livestock Cake Market Value (US$ Mn) Analysis & Forecast by Livestock, 2021–2031
Figure 48: South Asia Livestock Cake Market Volume (Tons) Analysis & Forecast by Livestock, 2021–2031
Figure 49: South Asia Livestock Cake Market Value (US$ Mn) Analysis & Forecast by Country, 2021-2031
Figure 50: South Asia Livestock Cake Market Volume (Tons) Analysis & Forecast by Country, 2021-2031
Figure 51: South Asia Livestock Cake Market Attractiveness Analysis by Country, 2021-2031
Figure 52: South Asia Livestock Cake Market Attractiveness Analysis by Source, 2021-2031
Figure 53: South Asia Livestock Cake Market Attractiveness Analysis by Livestock, 2021-2031
Figure 54: East Asia Livestock Cake Market Value (US$ Mn) Analysis & Forecast by Source, 2021–2031
Figure 55: East Asia Livestock Cake Market Volume (Tons) Analysis & Forecast by Source, 2021–2031
Figure 56: East Asia Livestock Cake Market Value (US$ Mn) Analysis & Forecast by Livestock, 2021–2031
Figure 57: East Asia Livestock Cake Market Volume (Tons) Analysis & Forecast by Livestock, 2021–2031
Figure 58: East Asia Cake Market Value (US$ Mn) Analysis & Forecast by Country, 2021-2031
Figure 59: East Asia Cake Market Volume (Tons) Analysis & Forecast by Country, 2021-2031
Figure 60: East Asia Livestock Cake Market Attractiveness Analysis by Country, 2021-2031
Figure 61: East Asia Livestock Cake Market Attractiveness Analysis by Source, 2021-2031
Figure 62: East Asia Livestock Cake Market Attractiveness Analysis by Livestock, 2021-2031
Figure 63: Oceania Livestock Cake Market Value (US$ Mn) Analysis & Forecast by Source, 2021–2031
Figure 64: Oceania Livestock Cake Market Volume (Tons) Analysis & Forecast by Source, 2021–2031
Figure 65: Oceania Livestock Cake Market Value (US$ Mn) Analysis & Forecast by Livestock, 2021–2031
Figure 66: Oceania Livestock Cake Market Volume (Tons) Analysis & Forecast by Livestock, 2021–2031
Figure 67: Oceania Livestock Cake Market Value (US$ Mn) Analysis & Forecast by Country, 2021–2031
Figure 68: Oceania Livestock Cake Market Volume (Tons) Analysis & Forecast by Country, 2021–2031
Figure 69: Oceania Livestock Cake Market Attractiveness Analysis by Country, 2021-2031
Figure 70: Oceania Livestock Cake Market Attractiveness Analysis by Source, 2021-2031
Figure 71: Oceania Livestock Cake Market Attractiveness Analysis by Livestock, 2021-2031
Figure 72: Middle East & Africa Livestock Cake Market Value (US$ Mn) Analysis & Forecast by Source, 2021–2031
Figure 73: Middle East & Africa Livestock Cake Market Volume (Tons) Analysis & Forecast by Source, 2021–2031
Figure 74: Middle East & Africa Livestock Cake Market Value (US$ Mn) Analysis & Forecast by Livestock, 2021–2031
Figure 75: Middle East & Africa Livestock Cake Market Volume (Tons) Analysis & Forecast by Livestock, 2021–2031
Figure 76: Middle East & Africa Livestock Cake Market Value (US$ Mn) Analysis & Forecast by Country, 2021–2031
Figure 77: Middle East & Africa Livestock Cake Market Volume (Tons) Analysis & Forecast by Country, 2021–2031
Figure 78: Middle East & Africa Livestock Cake Market Attractiveness Analysis by Country, 2021-2031
Figure 79: Middle East & Africa Livestock Cake Market Attractiveness Analysis by Source, 2021-2031
Figure 80: Middle East & Africa Livestock Cake Market Attractiveness Analysis by Livestock, 2021-2031
Copyright © Transparency Market Research, Inc. All Rights reserved
Trust Online

Livestock Cake Market