
Reports
Reports
Global Soybean Market: Snapshot
The market for soybean has been steadily rising and this has led to companies expending money into research and development of new and better products to satisfy the customer demand for different food products.
Majorly fuelling demand in the global soybean market is the rising awareness among people about its health benefits. Their increasing applications in various end-use segments such as animal feed is also serving to boost demand. Serving to hamper demand in the global soybean market, on the other hand, is the dairy protein ingredients that have the first mover advantage and greater consumer acceptance.
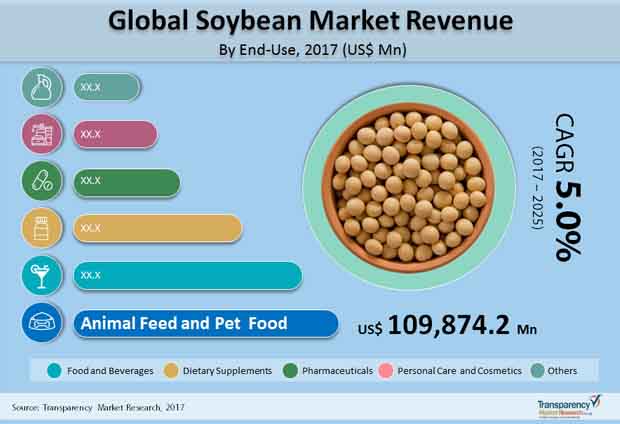
A report by Transparency Market Research forecasts the global soybean market to rise at a CAGR of 5.0% during the period between 2017 and 2025 to become worth US$215.746 bn by 2025 from US$146.23 bn in 2017.
Organic Soybean to Grow at Greater Pace due to Discerning Consumers
The two main sources of soybean can be classified into conventional and organic. Of the two, the organic segment is more popular because of the increasing preference of consumers for organic stuff sans chemicals and artificial additives that are usually bad for health. In the years ahead, the segment will likely expand at a greater CAGR of 8.1% to become worth US$1.38 bn. The conventional segment is expected to rise at a CAGR of 5.0% to attain a value of US$214.366 bn.
Depending upon end use again, the soybean market can be segmented into food and beverages, personal care, dietary supplements, pharmaceuticals, animal feed, etc. Among them, the segment of animal feed accounts for maximum share in revenue at present. The report by TMR estimates the share to be around 75.1% currently. In the years ahead too, the animal feed sector is predicted expand at a healthy clip. The soy meal segment accounts for the largest share and is followed by the soy oil segment.
Some of the main end products in the global soybean market are whole, protein, oil, meal, and others namely tofu, soybean milk, fiber. The protein segment of the soybean market can be further sub-segmented into soy protein concentrates, isolates, and hydrolysates. Amongt these segments, the soybean meal segment occupies leading share in the market – about 72.9%.
Asia Pacific with Substantial Population Emerges as Major Contributor to Demand
Geographically, some of the key segments in the global soybean market are North America, Latin America, Europe, Asia Pacific, and the Middle East and Africa. Of them, Asia Pacific is expected to account for the leading share vis-à-vis demand in the years to come due to its massive population, developing economies wherein more and more people are opting for healthy food, and rising awareness about the high protein content of soybean. The animal feed industry and nutraceuticals are also stoking growth in the market in the region. Asia Pacific will most likely be trailed by Latin America and North America. Together, Asia Pacific and Latin-America are likely to account for approximately 78.1% share by the end of 2025. The demand for soybeans in the three key markets is being primarily driven by the increasing consumption of soybean as a natural alternative to meat and dairy proteins and utilization as an ingredient in sports nutrition and in clean-labelled products.
Some of the prominent companies operating in the global soybean market are Kerry Inc., Fuji Oil Group, House Foods Group Inc, The WhiteWave Foods Company, E.I. du Pont de Nemours & Co., CHS Inc., Cargill Inc, The Scoular Company, Archer-Daniels Midland Co.
High Nutrition Value of Soybean to Spell Growth for the Global Soybean Market
Over the last few years, the demand for soybean by-products such as oil cakes, soybean meal, and other similar items has increased. The high nutritional value of products has increased their popularity amongst consumers. Consumers in developed countries now have increased disposable disposable income, and augmented productivity of soybean has improved in these countries, resulting in higher demand for soybean by-products. Soybean meal comes with a special amino acid profile that makes it a good substitute for cereal proteins. As a result, soybean meal is utilized as a feed for both human beings and animals. The medical benefits of protein-enriched foods, as well as the rising number of ruminants, cattle, and livestock, and other animals are likely to support growth of the global soybean market in the years to come.
Increasing Popularity of Vegan Lifestyle to Create Plethora of Opportunities for the Market
Plant-based proteins such as soybean are likely to be in high demand across the globe as several people are steadily moving toward a vegan lifestyle. In addition to that, the world is becoming healthier and fitter, necessitating higher protein content on our plates. Soybean is a great source of protein that also happens to have a lot of health benefits. It aids in the maintenance of our digestive health and can be moulded into various shapes for use in daily dishes. Soy consumption on a daily basis has been linked to better hair and skin health. Soybean is high in amino acids and is especially advantageous to people who have lactose intolerance. These factors are likely to propel growth of the global soybean market in near future.
Soybean is considered a near-perfect dairy substitute, that's why it has become increasingly popular amongst lactose-intolerant people. Soy curd, tempeh, tofu, and soy milk are just a few of the products available in the global soybean market. These products are capable of fully substituting milk and its various products in our daily lives. As a result, in the near future, soybean dairy-like products are likely to disrupt the market and determine its course of direction.
1. Global Soybean Market - Executive Summary
2. Market Introduction
2.1. Market Definition
2.2. Market Taxonomy
3. Global Soybean Market Analysis Scenario
3.1. Market Size and Forecast
3.1.1. Market Size and Y-o-Y Growth
3.1.2. Absolute $ Opportunity
3.2. Soybean Market Supply Chain Analysis
3.3. Global Organic Market Outlook
3.4. Organic Soybean Industry-Outlook
3.5. Soybean- Trade Scenario
3.6. Pricing Analysis
4. Market Dynamics
4.1. Macro-economic Factors
4.2. Drivers
4.3. Restraints
4.4. Opportunity
4.5. Market Trends
4.6. Forecast Factors – Relevance and Impact
5. Global Soybean Market Analysis and Forecast, By Region
5.1. Introduction
5.1.1. Basis Point Share (BPS) Analysis By Region
5.1.2. Y-o-Y Growth Projections By Region
5.2. Soybean Market Size (US$ Mn) and Volume (MT) Forecast By Region
5.2.1. North America
5.2.2. Europe
5.2.3. APAC
5.2.4. Latin America
5.2.5. Middle East and Africa
6. Global Soybean Market Analysis By Source
6.1. Introduction
6.1.1. Y-o-Y Growth Comparison By Source
6.1.2. Basis Point Share (BPS) Analysis By Source
6.2. Soybean Market Size (US$ Mn) and Volume (MT) Forecast By Source
6.2.1. Conventional (GMO and Non-GMO)
6.2.2. Organic
7. Global Soybean Market Analysis By End–use
7.1. Introduction
7.1.1. Y-o-Y Growth Comparison By End–use
7.1.2. Basis Point Share (BPS) Analysis By End–use
7.2. Soybean Market Size (US$ Mn) and Volume (MT) Forecast By End–use
7.2.1. Food & Beverage
7.2.2. Personal Care and Cosmetics
7.2.3. Dietary Supplements
7.2.4. Pharmaceutical
7.2.5. Animal Feed and Pet Food
7.2.6. Others
8. Global Soybean Market Analysis By End-product
8.1. Introduction
8.1.1. Y-o-Y Growth Comparison By End-product
8.1.2. Basis Point Share (BPS) Analysis By End-product
8.2. Soybean Market Size (US$ Mn) and Volume (MT) Forecast By End-product
8.2.1. Whole
8.2.2. Protein
8.2.2.1. Soy Protein Concentrate
8.2.2.2. Soy Protein Isolate
8.2.2.3. Soy Protein Hydrolysate
8.2.3. Oil
8.2.4. Meal
8.2.5. Others (Milk, Fiber and Tofu)
9. Global Market Attractiveness
9.1. Market Attractiveness Analysis By Region
9.2. Market Attractiveness Analysis By Source
9.3. Market Attractiveness Analysis By End–use
9.4. Market Attractiveness Analysis By End-product
10. North America Soybean Market Analysis and Forecast
10.1. Introduction
10.1.1. Basis Point Share (BPS) Analysis By Country
10.1.2. Y-o-Y Growth Projections By Country
10.2. Soybean Market Size (Value (US$) and Volume (MT) Forecast By Country
10.2.1. U.S.
10.2.2. Canada
10.3. Soybean Market Size (US$ Mn) and Volume (MT) Forecast By Source
10.3.1. Conventional (GMO and Non-GMO)
10.3.2. Organic
10.4. Soybean Market Size (US$ Mn) and Volume (MT) Forecast By End–use
10.4.1. Food & Beverage
10.4.2. Personal Care and Cosmetics
10.4.3. Dietary Supplements
10.4.4. Pharmaceutical
10.4.5. Animal Feed and Pet Food
10.4.6. Others
10.5. Soybean Market Size (US$ Mn) and Volume (MT) Forecast By End-product
10.5.1. Whole
10.5.2. Protein
10.5.2.1. Soy Protein Concentrate
10.5.2.2. Soy Protein Isolate
10.5.2.3. Soy Protein Hydrolysate
10.5.3. Oil
10.5.4. Meal
10.5.5. Others (Milk, Fiber and Tofu)
10.6. Market Attractiveness Analysis
10.6.1. By Country
10.6.2. By Source
10.6.3. By End–use
10.6.4. By End-product
11. Latin America Soybean Market Analysis and Forecast
11.1. Introduction
11.1.1. Basis Point Share (BPS) Analysis By Country
11.1.2. Y-o-Y Growth Projections By Country
11.2. Soybean Market Size (US$ Mn) and Volume (MT) Forecast By Country
11.2.1. Brazil
11.2.2. Mexico
11.2.3. Argentina
11.2.4. Rest of Latin America
11.3. Soybean Market Size (US$ Mn) and Volume (MT) Forecast By Source
11.3.1. Conventional (GMO and Non-GMO)
11.3.2. Organic
11.4. Soybean Market Size (US$ Mn) and Volume (MT) Forecast By End–use
11.4.1. Food & Beverage
11.4.2. Personal Care and Cosmetics
11.4.3. Dietary Supplements
11.4.4. Pharmaceutical
11.4.5. Animal Feed and Pet Food
11.4.6. Others
11.5. Soybean Market Size (US$ Mn) and Volume (MT) Forecast By End-product
11.5.1. Whole
11.5.2. Protein
11.5.2.1. Soy Protein Concentrate
11.5.2.2. Soy Protein Isolate
11.5.2.3. Soy Protein Hydrolysate
11.5.3. Oil
11.5.4. Meal
11.5.5. Others (Milk, Fiber and Tofu)
11.6. Market Attractiveness Analysis
11.6.1. By Country
11.6.2. By Source
11.6.3. By End–use
11.6.4. By End-product
12. Europe Soybean Market Analysis and Forecast
12.1. Introduction
12.1.1. Basis Point Share (BPS) Analysis By Country
12.1.2. Y-o-Y Growth Projections By Country
12.2. Soybean Market Size (Value (US$) and Volume (MT) Forecast By Country
12.2.1. EU5
12.2.2. Nordic
12.2.3. Russia
12.2.4. Poland
12.2.5. Rest of Europe
12.3. Soybean Market Size (US$ Mn) and Volume (MT) Forecast By Source
12.3.1. Conventional (GMO and Non-GMO)
12.3.2. Organic
12.4. Soybean Market Size (US$ Mn) and Volume (MT) Forecast By End–use
12.4.1. Food & Beverage
12.4.2. Personal Care and Cosmetics
12.4.3. Dietary Supplements
12.4.4. Pharmaceutical
12.4.5. Animal Feed and Pet Food
12.4.6. Others
12.5. Soybean Market Size (US$ Mn) and Volume (MT) Forecast By End-product
12.5.1. Whole
12.5.2. Protein
12.5.2.1. Soy Protein Concentrate
12.5.2.2. Soy Protein Isolate
12.5.2.3. Soy Protein Hydrolysate
12.5.3. Oil
12.5.4. Meal
12.5.5. Others (Milk, Fiber and Tofu)
12.6. Market Attractiveness Analysis
12.6.1. By Country
12.6.2. By Source
12.6.3. By End–use
12.6.4. By End-product
13. APAC Soybean Market Analysis and Forecast
13.1. Introduction
13.1.1. Basis Point Share (BPS) Analysis By Country
13.1.2. Y-o-Y Growth Projections By Country
13.2. Soybean Market Size (Value (US$) and Volume (MT) Forecast By Country
13.2.1. China
13.2.2. India
13.2.3. Japan
13.2.4. ASEAN
13.2.5. Australia and New Zealand
13.2.6. Rest of APAC
13.3. Soybean Market Size (US$ Mn) and Volume (MT) Forecast By Source
13.3.1. Conventional (GMO and Non-GMO)
13.3.2. Organic
13.4. Soybean Market Size (US$ Mn) and Volume (MT) Forecast By End–use
13.4.1. Food & Beverage
13.4.2. Personal Care and Cosmetics
13.4.3. Dietary Supplements
13.4.4. Pharmaceutical
13.4.5. Animal Feed and Pet Food
13.4.6. Others
13.5. Soybean Market Size (US$ Mn) and Volume (MT) Forecast By End-product
13.5.1. Whole
13.5.2. Protein
13.5.2.1. Soy Protein Concentrate
13.5.2.2. Soy Protein Isolate
13.5.2.3. Soy Protein Hydrolysate
13.5.3. Oil
13.5.4. Meal
13.5.5. Others (Milk, Fiber and Tofu)
13.6. Market Attractiveness Analysis
13.6.1. By Country
13.6.2. By Source
13.6.3. By End–use
13.6.4. By End-product
14. Middle East and Africa (MEA) Soybean Market Analysis and Forecast
14.1. Introduction
14.1.1. Basis Point Share (BPS) Analysis By Country
14.1.2. Y-o-Y Growth Projections By Country
14.2. Soybean Market Size (Value (US$) and Volume (MT) Forecast By Country
14.2.1. GCC Countries
14.2.2. South Africa
14.2.3. North Africa
14.2.4. Rest of MEA
14.3. Soybean Market Size (US$ Mn) and Volume (MT) Forecast By Source
14.3.1. Conventional (GMO and Non-GMO)
14.3.2. Organic
14.4. Soybean Market Size (US$ Mn) and Volume (MT) Forecast By End–use
14.4.1. Food & Beverage
14.4.2. Personal Care and Cosmetics
14.4.3. Dietary Supplements
14.4.4. Pharmaceutical
14.4.5. Animal Feed and Pet Food
14.4.6. Others
14.5. Soybean Market Size (US$ Mn) and Volume (MT) Forecast By End-product
14.5.1. Whole
14.5.2. Protein
14.5.2.1. Soy Protein Concentrate
14.5.2.2. Soy Protein Isolate
14.5.2.3. Soy Protein Hydrolysate
14.5.3. Oil
14.5.4. Meal
14.5.5. Others (Milk, Fiber and Tofu)
14.6. Market Attractiveness Analysis
14.6.1. By Country
14.6.2. By Source
14.6.3. By End–use
14.6.4. By End-product
15. Competition Landscape
15.1. Competition Dashboard
15.2. Market Structure
15.3. Company Profiles (Details–Overview, Financials, Products, Strategy, Recent Developments) (Tentative list)
15.3.1. Kerry Inc.
15.3.1.1. Overview and Regional Presence
15.3.1.2. Key development and strategy
15.3.1.3. Financials
15.3.2. Fuji Oil Group
15.3.2.1. Overview and Regional Presence
15.3.2.2. Key development and strategy
15.3.2.3. Financials
15.3.3. House Foods Group Inc
15.3.3.1. Overview and Regional Presence
15.3.3.2. Key development and strategy
15.3.3.3. Financials
15.3.4. The WhiteWave Foods Company
15.3.4.1. Overview and Regional Presence
15.3.4.2. Key development and strategy
15.3.4.3. Financials
15.3.5. SunOpta Inc.
15.3.5.1. Overview and Regional Presence
15.3.5.2. Key development and strategy
15.3.5.3. Financials
15.3.6. Pulmuone Co. Ltd.
15.3.6.1. Overview and Regional Presence
15.3.6.2. Key development and strategy
15.3.6.3. Financials
15.3.7. Morinaga Nutritional Foods, Inc.
15.3.7.1. Overview and Regional Presence
15.3.7.2. Key development and strategy
15.3.8. Aceitera General Deheza
15.3.8.1. Overview and Regional Presence
15.3.8.2. Key development and strategy
15.3.9. Granol Indústria Comércio E Exportação S/A.
15.3.9.1. Overview and Regional Presence
15.3.10. The Hain Celestial Group Inc.
15.3.10.1. Overview and Regional Presence
15.3.10.2. Key development and strategy
15.3.10.3. Financials
15.3.11. Crown Soya Protein Group
15.3.11.1. Overview and Regional Presence
15.3.11.2. Key development and strategy
15.3.12. Archer-Daniels Midland Co.
15.3.12.1. Overview and Regional Presence
15.3.12.2. Key development and strategy
15.3.12.3. Financials
15.3.13. E.I. du Pont de Nemours & Co.
15.3.13.1. Overview and Regional Presence
15.3.13.2. Key development and strategy
15.3.13.3. Financials
15.3.14. CHS Inc.
15.3.14.1. Overview and Regional Presence
15.3.14.2. Key development and strategy
15.3.14.3. Financials
15.3.15. Cargill Inc.
15.3.15.1. Overview and Regional Presence
15.3.15.2. Key development and strategy
15.3.15.3. Financials
15.3.16. The Scoular Company
15.3.16.1. Overview and Regional Presence
15.3.16.2. Key development and strategy
15.3.17. Wilmar International Ltd.
15.3.17.1. Overview and Regional Presence
15.3.17.2. Key development and strategy
15.3.17.3. Financials
15.3.18. Ag Processing Inc.
15.3.18.1. Overview and Regional Presence
15.3.18.2. Key development and strategy
15.3.19. Batory Foods
15.3.19.1. Overview and Regional Presence
15.3.20. Shandong Yuwang Ecological Food Industry Co., Ltd.
15.3.20.1. Overview and Regional Presence
16. Assumptions & Acronyms Used
17. Research Methodology
List of Table
Table 01: Global Soybean Market Size (US$ Mn) and Volume ('000 MT) Forecast, by Region, 2016–2025
Table 02: Global Soybean Market Size (US$ Mn) and Volume ('000 MT) Forecast, by Source, 2016–2025
Table 03: Global Soybean Market Size (US$ Mn) and Volume ('000 MT) Forecast, by End-use, 2016–2025
Table 04: Global Soybean Market Size (US$ Mn) and Volume ('000 MT) Forecast, by End-product, 2016–2025
Table 05: Global Soybean Market Size (US$ Mn) and Volume ('000 MT) Forecast, by Protein Segment, 2016–2025
Table 06: North America Soybean Market Size (US$ Mn) and Volume ('000 MT) Forecast, by Country, 2016–2025
Table 07: North America Soybean Market Size (US$ Mn) and Volume ('000 MT) Forecast, by Source, 2016–2025
Table 08: North America Soybean Market Size (US$ Mn) and Volume ('000 MT) Forecast, by End-use, 2016–2025
Table 09: North America Soybean Market Size (US$ Mn) and Volume ('000 MT) Forecast, by End-product, 2016–2025
Table 10: North America Soybean Market Size (US$ Mn) and Volume ('000 MT) Forecast, by Protein Segment, 2016–2025
Table 11: Latin America Soybean Market Size (US$ Mn) and Volume ('000 MT) Forecast, by Country, 2016–2025
Table 12: Latin America Soybean Market Size (US$ Mn) and Volume ('000 MT) Forecast, by Source, 2016–2025
Table 13: Latin America Soybean Market Size (US$ Mn) and Volume ('000 MT) Forecast, by End-use, 2016–2025
Table 14: Latin America Soybean Market Size (US$ Mn) and Volume ('000 MT) Forecast, by End-product, 2016–2025
Table 15: Latin America Soybean Market Size (US$ Mn) and Volume ('000 MT) Forecast, by Protein Segment, 2016–2025
Table 16: Europe Soybean Market Size (US$ Mn) and Volume ('000 MT) Forecast, by Country, 2016–2025
Table 17: Europe Soybean Market Size (US$ Mn) and Volume ('000 MT) Forecast, by Source, 2016–2025
Table 18: Europe Soybean Market Size (US$ Mn) and Volume ('000 MT) Forecast, by End-use, 2016–2025
Table 19: Europe Soybean Market Size (US$ Mn) and Volume ('000 MT) Forecast, by End-product, 2016–2025
Table 20: Europe Soybean Market Size (US$ Mn) and Volume ('000 MT) Forecast, by Protein Segment, 2016–2025
Table 21: Asia Pacific Soybean Market Size (US$ Mn) and Volume ('000 MT) Forecast, by Country, 2016–2025
Table 22: Asia Pacific Soybean Market Size (US$ Mn) and Volume ('000 MT) Forecast, by Source, 2016–2025
Table 23: Asia Pacific Soybean Market Size (US$ Mn) and Volume ('000 MT) Forecast, by End-use, 2016–2025
Table 24: Asia Pacific Soybean Market Size (US$ Mn) and Volume ('000 MT) Forecast, by End-product, 2016–2025
Table 25: Asia Pacific Soybean Market Size (US$ Mn) and Volume ('000 MT) Forecast, by Protein Segment, 2016–2025
Table 26: MEA Soybean Market Size (US$ Mn) and Volume ('000 MT) Forecast, by Country, 2016–2025
Table 27: MEA Soybean Market Size (US$ Mn) and Volume ('000 MT) Forecast, by Source, 2016–2025
Table 28: MEA Soybean Market Size (US$ Mn) and Volume ('000 MT) Forecast, by End-use, 2016–2025
Table 29: MEA Soybean Market Size (US$ Mn) and Volume ('000 MT) Forecast, by End-product, 2016–2025
Table 30: MEA Soybean Market Size (US$ Mn) and Volume ('000 MT) Forecast, by Protein Segment, 2016–2025
List of Figure
Figure 01: Global Soybean Market Value (US$ Mn) and Volume ('000 MT) Forecast, 2016–2025
Figure 02: Global Soybean Market Absolute $ Opportunity (US$ Mn), 2016?2025
Figure 03: Global Soybean Market Share (%) & BPS Analysis, by Region, 2017 & 2025
Figure 04: Global Soybean Market Y-o-Y Growth Rate, by Region, 2016–2025
Figure 05: North America Soybean Market Absolute $ Opportunity (US$ Mn), 2017–2025
Figure 06: Latin America Soybean Market Absolute $ Opportunity (US$ Mn), 2017–2025
Figure 07: Europe Soybean Market Absolute $ Opportunity (US$ Mn), 2017–2025
Figure 08: APAC Soybean Market Absolute $ Opportunity (US$ Mn), 2017–2025
Figure 09: MEA Soybean Market Absolute $ Opportunity (US$ Mn), 2017–2025
Figure 10: Global Soybean Market Share (%) & BPS Analysis, By Source, 2017 & 2025
Figure 11: Global Soybean Market Y-o-Y Growth Rate, By Source, 2016–2025
Figure 12: Global Soybean Market Absolute $ Opportunity (US$ Mn), By Conventional Segment, 2017–2025
Figure 13: Global Soybean Market Absolute $ Opportunity (US$ Mn), By Organic Segment, 2017–2025
Figure 14: Global Soybean Market Share (%) & BPS Analysis, by End-use, 2017 & 2025
Figure 15: Global Soybean Market Y-o-Y Growth Rate, By End-use, 2016–2025
Figure 16: Global Soybean Market Absolute $ Opportunity (US$ Mn), By Food & Beverages Segment, 2017–2025
Figure 17: Global Soybean Market Absolute $ Opportunity (US$ Mn), By Personal Care & Cosmetics Segment, 2017–2025
Figure 18: Global Soybean Market Absolute $ Opportunity (US$ Mn), By Dietary Supplements Segment, 2017–2025
Figure 19: Global Soybean Market Absolute $ Opportunity (US$ Mn), By Pharmaceutical Segment, 2017–2025
Figure 20: Global Soybean Market Absolute $ Opportunity (US$ Mn),By Animal Feed & Pet Food Segment 2017–2025
Figure 21: Global Soybean Market Absolute $ Opportunity (US$ Mn),Others Segment 2017–2025
Figure 22: Global Soybean Market Share (%) & BPS Analysis, by End-product, 2017 & 2025
Figure 23: Global Soybean Market Y-o-Y Growth Rate, By End-product, 2017–2025
Figure 24: Global Soybean Market Absolute $ Opportunity (US$ Mn), By Whole Segment 2017–2025
Figure 25: Global Soybean Market Absolute $ Opportunity (US$ Mn),By Protein Segment 2017–2025
Figure 26: Global Soybean Market Absolute $ Opportunity (US$ Mn),By Oil Segment 2017–2025
Figure 27: Global Soybean Market Absolute $ Opportunity (US$ Mn),By Meal Segment 2017–2025
Figure 28: Global Soybean Market Absolute $ Opportunity (US$ Mn),By Others Segment 2017–2025
Figure 29: Global Soybean Market Attractiveness Analysis, by Region, 2017 & 2025
Figure 30: Global Soybean Market Attractiveness Analysis, by Source, 2017 & 2025
Figure 31: Global Soybean Market Attractiveness Analysis, by End-use, 2017 & 2025
Figure 32: Global Soybean Market Attractiveness Analysis, by End-Product, 2017 & 2025
Figure 33: North America Soybean Market Value (US$ Mn) and Volume ('000 MT) Forecast, 2016–2025
Figure 34: North America Soybean Market Absolute $ Opportunity (US$ Mn), 2016?2025
Figure 35: North America Soybean Market Share (%) & BPS Analysis, By Country, 2017 & 2025
Figure 36: North America Soybean Market Y-o-Y Growth Rate, By Country, 2016–2025
Figure 37: U.S. Soybean Market Absolute $ Opportunity (US$ Mn), 2017–2025
Figure 38: Canada Soybean Market Absolute $ Opportunity (US$ Mn), 2017–2025
Figure 39: North America Soybean Market Share (%) & BPS Analysis, By Source, 2017 & 2025
Figure 40: North America Soybean Market Y-o-Y Growth Rate, By Source, 2016–2025
Figure 41: North America Soybean Market Absolute $ Opportunity (US$ Mn), By Conventional Segment, 2017–2025
Figure 42: North America Soybean Market Absolute $ Opportunity (US$ Mn), By Organic Segment, 2017–2025
Figure 43: North America Soybean Market Share (%) & BPS Analysis, by End-use, 2017 & 2025
Figure 44: North America Soybean Market Y-o-Y Growth Rate, By End-use, 2016–2025
Figure 45: North America Soybean Market Absolute $ Opportunity (US$ Mn), By Food & Beverages Segment, 2017–2025"
Figure 46: North America Soybean Market Absolute $ Opportunity (US$ Mn), By Dietary Supplements Segment, 2017–2025
Figure 47: North America Soybean Market Absolute $ Opportunity (US$ Mn), By Personal Care & Cosmetics Segment, 2017–2025
Figure 48: North America Soybean Market Absolute $ Opportunity (US$ Mn), By Pharmaceuticals Segment, 2017–2025
Figure 49: North America Soybean Market Absolute $ Opportunity (US$ Mn),By Animal Feed & Pet Food 2017–2025
Figure 50: North America Soybean Market Absolute $ Opportunity (US$ Mn),By Others Segment 2017–2025
Figure 51: North America Soybean Market Share (%) & BPS Analysis, by End-product, 2017 & 2025
Figure 52: North America Soybean Market Y-o-Y Growth Rate, By End-product, 2016–2025
Figure 53: North America Soybean Market Absolute $ Opportunity (US$ Mn), By Whole Segment, 2017–2025
Figure 54: North America Soybean Market Absolute $ Opportunity (US$ Mn),By Protein Segment 2017–2025
Figure 55: North America Soybean Market Absolute $ Opportunity (US$ Mn),By Oil Segment 2017–2025
Figure 56: North America Soybean Market Absolute $ Opportunity (US$ Mn),By Meal Segment 2017–2025
Figure 57: North America Soybean Market Absolute $ Opportunity (US$ Mn),By Others Segment 2017–2025
Figure 58: North America Soybean Market Attractiveness Analysis, by Country, 2017 & 2025
Figure 59: North America Soybean Market Attractiveness Analysis, by Source, 2017 & 2025
Figure 60: North America Soybean Market Attractiveness Analysis, by End-use, 2017 & 2025
Figure 61: North America Soybean Market Attractiveness Analysis, by End-product, 2017 & 2025
Figure 62: Latin America Soybean Market Value (US$ Mn) and Volume ('000 MT) Forecast, 2016–2025
Figure 63: Latin America Soybean Market Absolute $ Opportunity (US$ Mn), 2016?2025
Figure 64: Latin America Soybean Market Share (%) & BPS Analysis, By Country, 2017 & 2025
Figure 65: Latin America Soybean Market Y-o-Y Growth Rate, By Country, 2016–2025
Figure 66: Brazil Soybean Market Absolute $ Opportunity (US$ Mn), 2017–2025
Figure 67: Mexico Soybean Market Absolute $ Opportunity (US$ Mn), 2017–2025
Figure 68: Argentina Soybean Market Absolute $ Opportunity (US$ Mn), 2017–2025
Figure 69: Rest of Latin America Soybean Market Absolute $ Opportunity (US$ Mn), 2017–2025
Figure 70: Latin America Soybean Market Share (%) & BPS Analysis, By Source, 2017 & 2025
Figure 71: Latin America Soybean Market Y-o-Y Growth Rate, By Source, 2016–2025
Figure 72: Latin America Soybean Market Absolute $ Opportunity (US$ Mn), By Conventional Segment, 2017–2025
Figure 73: Latin America Soybean Market Absolute $ Opportunity (US$ Mn), By Organic Segment, 2017–2025
Figure 74: Latin America Soybean Market Share (%) & BPS Analysis, by End-use, 2017 & 2025
Figure 75: Latin America Soybean Market Y-o-Y Growth Rate, By End-use, 2016–2025
Figure 76: Latin America Soybean Market Absolute $ Opportunity (US$ Mn), By Food & Beverages Segment, 2017–2025"
Figure 77: Latin America Soybean Market Absolute $ Opportunity (US$ Mn), By Dietary Supplements Segment, 2017–2025
Figure 78: Latin America Soybean Market Absolute $ Opportunity (US$ Mn), By Personal Care & Cosmetics Segment, 2017–2025
Figure 79: Latin America Soybean Market Absolute $ Opportunity (US$ Mn), By Pharmaceuticals Segment, 2017–2025
Figure 80: Latin America Soybean Market Absolute $ Opportunity (US$ Mn),By Animal Feed & Pet Food 2017–2025
Figure 81: Latin America Soybean Market Absolute $ Opportunity (US$ Mn),By Others Segment 2017–2025
Figure 82: Latin America Soybean Market Share (%) & BPS Analysis, by End-product, 2017 & 2025
Figure 83: Latin America Soybean Market Y-o-Y Growth Rate, By End-product, 2016–2025
Figure 84: Latin America Soybean Market Absolute $ Opportunity (US$ Mn), By Whole Segment, 2017–2025
Figure 85: Latin America Soybean Market Absolute $ Opportunity (US$ Mn),By Protein Segment 2017–2025
Figure 86: Latin America Soybean Market Absolute $ Opportunity (US$ Mn),By Oil Segment 2017–2025
Figure 87: Latin America Soybean Market Absolute $ Opportunity (US$ Mn),By Meal Segment 2017–2025
Figure 88: Latin America Soybean Market Absolute $ Opportunity (US$ Mn),By Others Segment 2017–2025
Figure 89: Latin America Soybean Market Attractiveness Analysis, by Country, 2017 & 2025
Figure 90: Latin America Soybean Market Attractiveness Analysis, by Source, 2017 & 2025
Figure 91: Latin America Soybean Market Attractiveness Analysis, by End-use, 2017 & 2025
Figure 92: Latin America Soybean Market Attractiveness Analysis, by End-product, 2017 & 2025
Figure 93: Europe Soybean Market Value (US$ Mn) and Volume ('000 MT) Forecast, 2016–2025
Figure 94: Europe Soybean Market Absolute $ Opportunity (US$ Mn), 2016?2025
Figure 95: Europe Soybean Market Share (%) & BPS Analysis, By Country, 2017 & 2025
Figure 96: Europe Soybean Market Y-o-Y Growth Rate, By Country, 2016–2025
Figure 97: EU5 Soybean Market Absolute $ Opportunity (US$ Mn), 2017–2025
Figure 98: Nordic Soybean Market Absolute $ Opportunity (US$ Mn), 2017–2025
Figure 99: Russia Soybean Market Absolute $ Opportunity (US$ Mn), 2017–2025
Figure 100: Rest of Europe Soybean Market Absolute $ Opportunity (US$ Mn), 2017–2025
Figure 101: Europe Soybean Market Share (%) & BPS Analysis, By Source, 2017 & 2025
Figure 102: Europe Soybean Market Y-o-Y Growth Rate, By Source, 2016–2025
Figure 103: Europe Soybean Market Absolute $ Opportunity (US$ Mn), By Conventional Segment, 2017–2025
Figure 104: Europe Soybean Market Absolute $ Opportunity (US$ Mn), By Organic Segment, 2017–2025
Figure 105: Europe Soybean Market Share (%) & BPS Analysis, by End-use, 2017 & 2025
Figure 106: Europe Soybean Market Y-o-Y Growth Rate, By End-use, 2016–2025
Figure 107: Europe Soybean Market Absolute $ Opportunity (US$ Mn), By Food & Beverages Segment, 2017–2025"
Figure 108: Europe Soybean Market Absolute $ Opportunity (US$ Mn), By Dietary Supplements Segment, 2017–2025
Figure 109: Europe Soybean Market Absolute $ Opportunity (US$ Mn), By Personal Care & Cosmetics Segment, 2017–2025
Figure 110: Europe Soybean Market Absolute $ Opportunity (US$ Mn), By Pharmaceuticals Segment, 2017–2025
Figure 111: Europe Soybean Market Absolute $ Opportunity (US$ Mn),By Animal Feed & Pet Food 2017–2025
Figure 112: Europe Soybean Market Absolute $ Opportunity (US$ Mn),By Others Segment 2017–2025
Figure 113: Europe Soybean Market Share (%) & BPS Analysis, by End-product, 2017 & 2025
Figure 114: Europe Soybean Market Y-o-Y Growth Rate, By End-product, 2016–2025
Figure 115: Europe Soybean Market Absolute $ Opportunity (US$ Mn), By Whole Segment, 2017–2025
Figure 116: Europe Soybean Market Absolute $ Opportunity (US$ Mn),By Protein Segment 2017–2025
Figure 117: Europe Soybean Market Absolute $ Opportunity (US$ Mn),By Oil Segment 2017–2025
Figure 118: Europe Soybean Market Absolute $ Opportunity (US$ Mn),By Meal Segment 2017–2025
Figure 119: Europe Soybean Market Absolute $ Opportunity (US$ Mn),By Others Segment 2017–2025
Figure 120: Europe Soybean Market Attractiveness Analysis, by Country, 2017 & 2025
Figure 121: Europe Soybean Market Attractiveness Analysis, by Source, 2017 & 2025
Figure 122: Europe Soybean Market Attractiveness Analysis, by End-use, 2017 & 2025
Figure 123: Europe Soybean Market Attractiveness Analysis, by End-product, 2017 & 2025
Figure 124: Asia Pacific Soybean Market Value (US$ Mn) and Volume ('000 MT) Forecast, 2016–2025
Figure 125: Asia Pacific Soybean Market Absolute $ Opportunity (US$ Mn), 2016?2025
Figure 126: Asia Pacific Soybean Market Share (%) & BPS Analysis, By Country, 2017 & 2025
Figure 127: Asia Pacific Soybean Market Y-o-Y Growth Rate, By Country, 2016–2025
Figure 128: China Soybean Market Absolute $ Opportunity (US$ Mn), 2017–2025
Figure 129: India Soybean Market Absolute $ Opportunity (US$ Mn), 2017–2025
Figure 130: Japan Soybean Market Absolute $ Opportunity (US$ Mn), 2017–2025
Figure 131: ASEAN Soybean Market Absolute $ Opportunity (US$ Mn), 2017–2025
Figure 132: Australia and New Zealand Soybean Market Absolute $ Opportunity (US$ Mn), 2017–2025
Figure 133: Rest Of APAC Soybean Market Absolute $ Opportunity (US$ Mn), 2017–2025
Figure 134: Asia Pacific Soybean Market Share (%) & BPS Analysis, By Source, 2017 & 2025
Figure 135: Asia Pacific Soybean Market Y-o-Y Growth Rate, By Source, 2016–2025
Figure 136: Asia Pacific Soybean Market Absolute $ Opportunity (US$ Mn), By Conventional Segment, 2017–2025
Figure 137: Asia Pacific Soybean Market Absolute $ Opportunity (US$ Mn), By Organic Segment, 2017–2025
Figure 138: Asia Pacific Soybean Market Share (%) & BPS Analysis, by End-use, 2017 & 2025
Figure 139: Asia Pacific Soybean Market Y-o-Y Growth Rate, By End-use, 2016–2025
Figure 140: Asia Pacific Soybean Market Absolute $ Opportunity (US$ Mn), By Food & Beverages Segment, 2017–2025"
Figure 141: Asia Pacific Soybean Market Absolute $ Opportunity (US$ Mn), By Dietary Supplements Segment, 2017–2025
Figure 142: Asia Pacific Soybean Market Absolute $ Opportunity (US$ Mn), By Personal Care & Cosmetics Segment, 2017–2025
Figure 143: Asia Pacific Soybean Market Absolute $ Opportunity (US$ Mn), By Pharmaceuticals Segment, 2017–2025
Figure 144: Asia Pacific Soybean Market Absolute $ Opportunity (US$ Mn),By Animal Feed & Pet Food 2017–2025
Figure 145: Asia Pacific Soybean Market Absolute $ Opportunity (US$ Mn),By Others Segment 2017–2025
Figure 146: Asia Pacific Soybean Market Share (%) & BPS Analysis, by End-product, 2017 & 2025
Figure 147: Asia Pacific Soybean Market Y-o-Y Growth Rate, By End-product, 2016–2025
Figure 148: Asia Pacific Soybean Market Absolute $ Opportunity (US$ Mn), By Whole Segment, 2017–2025
Figure 149: Asia Pacific Soybean Market Absolute $ Opportunity (US$ Mn),By Protein Segment 2017–2025
Figure 150: Asia Pacific Soybean Market Absolute $ Opportunity (US$ Mn),By Oil Segment 2017–2025
Figure 151: Asia Pacific Soybean Market Absolute $ Opportunity (US$ Mn),By Meal Segment 2017–2025
Figure 152: Asia Pacific Soybean Market Absolute $ Opportunity (US$ Mn),By Others Segment 2017–2025
Figure 153: Asia Pacific Soybean Market Attractiveness Analysis, by Country, 2017 & 2025
Figure 154: Asia Pacific Soybean Market Attractiveness Analysis, by Source, 2017 & 2025
Figure 155: Asia Pacific Soybean Market Attractiveness Analysis, by End-use, 2017 & 2025
Figure 156: Asia Pacific Soybean Market Attractiveness Analysis, by End-product, 2017 & 2025
Figure 157: MEA Soybean Market Value (US$ Mn) and Volume ('000 MT) Forecast, 2016–2025
Figure 158: MEA Soybean Market Absolute $ Opportunity (US$ Mn), 2016?2025
Figure 159: MEA Soybean Market Share (%) & BPS Analysis, By Country, 2017 & 2025
Figure 160: MEA Soybean Market Y-o-Y Growth Rate, By Country, 2016–2025
Figure 161: GCC Countries Soybean Market Absolute $ Opportunity (US$ Mn), 2017–2025
Figure 162: South Africa Soybean Market Absolute $ Opportunity (US$ Mn), 2017–2025
Figure 163: North Africa Soybean Market Absolute $ Opportunity (US$ Mn), 2017–2025
Figure 164: Rest of MEA Soybean Market Absolute $ Opportunity (US$ Mn), 2017–2025
Figure 165: MEA Soybean Market Share (%) & BPS Analysis, By Source, 2017 & 2025
Figure 166: MEA Soybean Market Y-o-Y Growth Rate, By Source, 2016–2025
Figure 167: MEA Soybean Market Absolute $ Opportunity (US$ Mn), By Conventional Segment, 2017–2025
Figure 168: MEA Soybean Market Absolute $ Opportunity (US$ Mn), By Organic Segment, 2017–2025
Figure 169: MEA Soybean Market Share (%) & BPS Analysis, by End-use, 2017 & 2025
Figure 170: MEA Soybean Market Y-o-Y Growth Rate, By End-use, 2016–2025
Figure 171: MEA Soybean Market Absolute $ Opportunity (US$ Mn), By Food & Beverages Segment, 2017–2025"
Figure 172: MEA Soybean Market Absolute $ Opportunity (US$ Mn), By Dietary Supplements Segment, 2017–2025
Figure 173: MEA Soybean Market Absolute $ Opportunity (US$ Mn), By Personal Care & Cosmetics Segment, 2017–2025
Figure 174: MEA Soybean Market Absolute $ Opportunity (US$ Mn), By Pharmaceuticals Segment, 2017–2025
Figure 175: MEA Soybean Market Absolute $ Opportunity (US$ Mn),By Animal Feed & Pet Food 2017–2025
Figure 176: MEA Soybean Market Absolute $ Opportunity (US$ Mn),By Others Segment 2017–2025
Figure 177: MEA Soybean Market Share (%) & BPS Analysis, by End-product, 2017 & 2025
Figure 178: MEA Soybean Market Y-o-Y Growth Rate, By End-product, 2016–2025
Figure 179: MEA Soybean Market Absolute $ Opportunity (US$ Mn), By Whole Segment, 2017–2025
Figure 180: MEA Soybean Market Absolute $ Opportunity (US$ Mn),By Protein Segment 2017–2025
Figure 181: MEA Soybean Market Absolute $ Opportunity (US$ Mn),By Oil Segment 2017–2025
Figure 182: MEA Soybean Market Absolute $ Opportunity (US$ Mn),By Meal Segment 2017–2025
Figure 183: MEA Soybean Market Absolute $ Opportunity (US$ Mn),By Others Segment 2017–2025
Figure 184: MEA Soybean Market Attractiveness Analysis, by Country, 2017 & 2025
Figure 185: MEA Soybean Market Attractiveness Analysis, by Source, 2017 & 2025
Figure 186: MEA Soybean Market Attractiveness Analysis, by End-use, 2017 & 2025
Figure 187: MEA Soybean Market Attractiveness Analysis, by End-product, 2017 & 2025
Copyright © Transparency Market Research, Inc. All Rights reserved
Trust Online

Soybean Market