
Reports
Reports
Advancements in the field of diagnostics have come a long way in enabling medical professionals to enhance the lives of chronically-ill patients. Increasing incidence of diabetes around the world has spiked the use of diagnostic methods such as glycated hemoglobin tests. Manufacturers of medical devices are actively focusing on creating new products that serve the critical purpose of glycated hemoglobin testing in the diagnosis of diabetes. An exclusive research report by Transparency Market Research reveals that the growing incidence of diabetes will continue to drive the growth of the global glycated hemoglobin testing market in the foreseeable future.
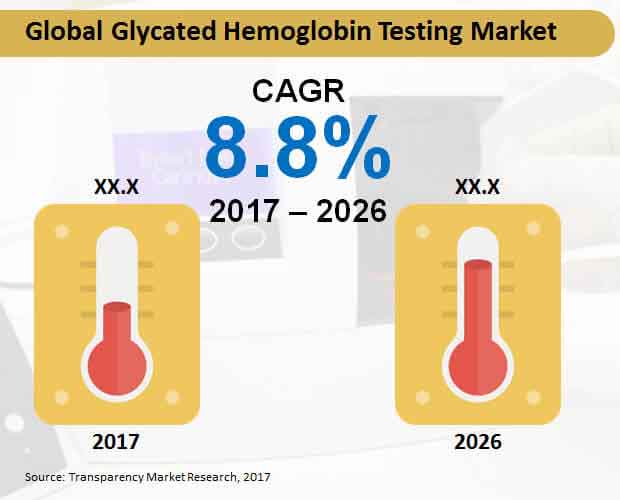
According to the study, the global market for glycated hemoglobin testing will be worth US$ 705 million by the end of 2026. The report projects that improvements in the techniques and increasing preference of diabetics towards early diagnosis will drive the adoption of glycated hemoglobin testing in the near future. During the forecast period, 2017-2026, the global glycated hemoglobin testing market is anticipated to expand robustly at a CAGR of 8.8%.
North America to Register Highest Adoption of Glycated Hemoglobin Tests
Key findings from the research study reveal that the demand for glycated hemoglobin testing services is the highest in the US and Canada. Consumers in North America are highly prone to diabetes as their proactive lifestyles and hectic professions lead them towards unhealthy diets. In 2017, North America glycated hemoglobin testing market is anticipated to be worth US$ 113 million. During the forecast period, the demand for glycated hemoglobin testing in Europe and the Asia-Pacific excluding Japan region is also expected to gain considerable traction.
Increasing Uptake for Laboratory Based Tests
Patients seeking glycated hemoglobin testing are growing more inclined towards laboratory based tests. While point-of-care glycated hemoglobin testing is more convenient option, the results and diagnostic outcomes of laboratories continue to spearhead their dominance in the global market. By the end of 2026, nearly US$ 500 million worth of glycated hemoglobin tests will be performed in laboratories. However, during the forecast period, point-of-care tests are anticipated to record fastest revenue growth at a CAGR of 10.6%.
Higher End-use in Hospitals; Equal Preference to Immunoassay and Chromatography Techniques
The report further reveals that hospitals will be the largest end-users of glycated hemoglobin testing in the global market. Through 2026, over one-third share of revenues procured in the global glycated hemoglobin testing market will be accounted by their end-use in hospitals. Diagnostic centers will also be leading end-users of glycated hemoglobin testing, while academic institutes will exhibit moderate traction in terms of adoption. On the basis of techniques, the global market for glycated hemoglobin testing will witness near-equal revenue share from chromatography and immunoassay techniques. With respect to identifying the average concentration of plasma glucose in blood, these techniques are equally effective and affordable. By 2026, revenues accounted by chromatography and immunoassays will individually bring in more than US$ 315 million to the global market value.
Competition Tracking
Several manufacturers of medical devices across the globe have deeply invested in the expansion of the global glycated hemoglobin testing market. In the view of growing contribution of diabetes to revenues of pharmaceutical companies and medical device manufacturers, the overall glycated hemoglobin testing market is likely to remain lucrative in the healthcare sector. Companies namely, Arkray, Bayer, Bio-Rad Laboratories, Ceragem Medisys, Chek Diagnostics, Daiichi Biotech, DiaSys Diagnostic Systems, Diazyme Laboratories, EKF Diagnostics, Erba Mannheim, Human Diagnostics, Lite-On Technology, Menarini, Mindray Medical, Randox Laboratories, Sebia, Siemens Healthcare, TaiDoc Technology, Tosoh Bioscience, and Trinity Biotech are observed as key market participants in the global glycated hemoglobin testing market. Their presence in the expansion of the global market for glycated hemoglobin testing during the forecast period is expected to be active and aggressive.
Global Glycated Haemoglobin Testing Market to Expand with Advancements in Diabetes Treatment
The demand within the global glycated haemoglobin testing market is slated to increase in the times to follow. It is worthwhile to note that the incidence of blood-related disorders and diseases has increased by a formidable chase. It is also safe to project that the use of glycated haemoglobin testing would increase alongside advancements in diagnosis and treatments lines pertaining to the domain of cardiology and nephrology. Over the course of the next decade, the use of glycated haemoglobin testing for precautionary pre-treatment tests is also expected to increase. In light of these trends and factors pertaining to the healthcare industry, the global glycated haemoglobin testing market is foreseen to cause disruptions for the market vendors.
The rising incidence of diabetes and arbitrary insulin spiking across several population groups is a matter of concern for the masses. Besides, the direct association of diabetes with several other diseases has further elevated the concerns of the masses. In addition to this, diabetes can also be a cause of trigger for several other diseases. Henceforth, the global glycated haemoglobin testing market is predicted to capture fresh revenues in the times to follow. The next decade is foreseen be a phase of revenue generation across the glycated haemoglobin testing market.
The aforementioned projections can be attributed to the outbreak of the novel coronavirus. After completing a year of the pandemic experience, the medical industry has found out several key inferences and conclusions related to the virus. The occurrence of the coronavirus in people suffering from diabetes can be a cause of severity for the suffering individuals. Over the course of the next decade, the glycated haemoglobin testing market is projected to attract fresh pathways for growth. The presence of several important research entities is also changing the dynamics of growth across the glycated haemoglobin testing market.
Glycated hemoglobin testing market will be worth US$ 705 million by the end of 2026
Glycated hemoglobin testing market is anticipated to expand robustly at a CAGR of 8.8% from 2017 - 2026
Glycated hemoglobin testing market is driven by increasing preference of diabetics towards early diagnosis
The end-use segments in glycated hemoglobin testing market are hospitals
Key player in the glycated hemoglobin testing market include Arkray, Bayer, Bio-Rad Laboratories, Ceragem Medisys, Chek Diagnostics, Daiichi Biotech, DiaSys Diagnostic Systems
Chapter 1 Global Economic Outlook
1.1 Global Healthcare Sector Outlook
Chapter 2 Global Glycated Hemoglobin Testing Market - Executive Summary
Chapter 3 Global Glycated Hemoglobin Testing Market Overview
3.1 Introduction
3.1.1 Global Glycated Hemoglobin Testing Market Taxonomy
3.1.2 Global Glycated Hemoglobin Testing Market Definition
3.2 Global Glycated Hemoglobin Testing Market Size (US$ Mn) and Forecast, 2012-2026
3.2.1 Global Glycated Hemoglobin Testing Market Y-o-Y Growth
3.3 Global Glycated Hemoglobin Testing Market Dynamics
3.4 Supply Chain
3.5 Cost Structure
3.6 Patents
3.7 Distribution of analyzers by time taken for analysis
3.8 Mapping of Opportunity Size
3.8.1 Percentage of all-cause deaths attributed to high blood glucose, by age and country income group in Men
3.8.2 Percentage of all-cause deaths attributed to high blood glucose, by age and country income group in Women
3.8.3 High blood glucose age-standardized mortality rates per 100000, age 20+
3.8.4 Estimated prevalence and number of people with diabetes (adults 18+ years)
3.9 Key Regulations
3.10 PESTL Analysis
3.11 Product Lifecycle
3.12 Service Provider List
3.13 Key Participants Market Presence (Intensity Map) By Region
Chapter 4 Global Glycated Hemoglobin Testing Market Analysis and Forecast 2012-2026
4.1 Global Glycated Hemoglobin Testing Market Size and Forecast by Test Type, 2012-2026
4.1.1 Laboratory Based Test Market Size and Forecast, 2012-2026
4.1.1.1 Revenue (US$ Mn) Comparison, By Region
4.1.1.2 Market Share Comparison, By Region
4.1.1.3 Y-o-Y growth Comparison, By Region
4.1.2 Point of Care Test Market Size and Forecast, 2012-2026
4.1.2.1 Revenue (US$ Mn) Comparison, By Region
4.1.2.2 Market Share Comparison, By Region
4.1.2.3 Y-o-Y growth Comparison, By Region
4.2 Global Glycated Hemoglobin Testing Market Size and Forecast by End User, 2012-2026
4.2.1 Hospitals Market Size and Forecast, 2012-2026
4.2.1.1 Revenue (US$ Mn) Comparison, By Region
4.2.1.2 Market Share Comparison, By Region
4.2.1.3 Y-o-Y growth Comparison, By Region
4.2.2 Diagnostic Centers Market Size and Forecast, 2012-2026
4.2.2.1 Revenue (US$ Mn) Comparison, By Region
4.2.2.2 Market Share Comparison, By Region
4.2.2.3 Y-o-Y growth Comparison, By Region
4.2.3 Academic and Research Institutes Market Size and Forecast, 2012-2026
4.2.3.1 Revenue (US$ Mn) Comparison, By Region
4.2.3.2 Market Share Comparison, By Region
4.2.3.3 Y-o-Y growth Comparison, By Region
4.2.4 Other End Users Market Size and Forecast, 2012-2026
4.2.4.1 Revenue (US$ Mn) Comparison, By Region
4.2.4.2 Market Share Comparison, By Region
4.2.4.3 Y-o-Y growth Comparison, By Region
4.3 Global Glycated Hemoglobin Testing Market Size and Forecast by Technique, 2012-2026
4.3.1 Chromatography Market Size and Forecast, 2012-2026
4.3.1.1 Revenue (US$ Mn) Comparison, By Region
4.3.1.2 Market Share Comparison, By Region
4.3.1.3 Y-o-Y growth Comparison, By Region
4.3.2 Immunoassay Market Size and Forecast, 2012-2026
4.3.2.1 Revenue (US$ Mn) Comparison, By Region
4.3.2.2 Market Share Comparison, By Region
4.3.2.3 Y-o-Y growth Comparison, By Region
4.3.3 Other Market Size and Forecast, 2012-2026
4.3.3.1 Revenue (US$ Mn) Comparison, By Region
4.3.3.2 Market Share Comparison, By Region
4.3.3.3 Y-o-Y growth Comparison, By Region
Chapter 5 North America Glycated Hemoglobin Testing Market Size and Forecast, 2012-2026
5.1 North America Market Outlook
5.1.1 Political Outlook
5.1.2 Economic Outlook
5.1.3 Business Environment Outlook
5.1.4 North America Healthcare Sector Outlook: Will the Obama care Senate Repeal Bill Thrash Federal Medicaid Healthcare Funding?
5.1.5 North America Glycated Hemoglobin Testing Market Overlook:
5.2 Revenue (US$ Mn) Comparison, By Country
5.3 Revenue (US$ Mn) Comparison, By Test Type
5.4 Revenue (US$ Mn) Comparison, By End User
5.5 Revenue (US$ Mn) Comparison, By Technique
Chapter 6 Latin America Glycated Hemoglobin Testing Market Size and Forecast, 2012-2026
6.1 Latin America Market Outlook
6.1.1 Political Outlook
6.1.2 Economic Outlook
6.1.3 Business Environment Outlook
6.1.4 Latin America Healthcare Sector Outlook: Growing Public-Private Partnerships are augmenting the Provision of Basic Healthcare Services
6.1.5 Latin America Glycated Hemoglobin Testing Market Outlook:
6.2 Revenue (US$ Mn) Comparison, By Country
6.3 Revenue (US$ Mn) Comparison, By Test Type
6.4 Revenue (US$ Mn) Comparison, By End User
6.5 Revenue (US$ Mn) Comparison, By Technique
Chapter 7 Europe Glycated Hemoglobin Testing Market Size and Forecast, 2012-2026
7.1 Europe Market Outlook
7.1.1 Political Outlook
7.1.2 Economic Outlook
7.1.3 Business Environment Outlook
7.1.4 Europe Healthcare Sector Outlook: Will Brexit Strip Britons of Basic Access to Free Health Insurance?
7.1.5 Europe Glycated Hemoglobin Testing Market Outlook:
7.2 Revenue (US$ Mn) Comparison, By Country
7.3 Revenue (US$ Mn) Comparison, By Test Type
7.4 Revenue (US$ Mn) Comparison, By End User
7.5 Revenue (US$ Mn) Comparison, By Technique
Chapter 8 Japan Glycated Hemoglobin Testing Market Size and Forecast, 2012-2026
8.1 Japan Market Outlook
8.1.1 Political Outlook
8.1.2 Economic Outlook
8.1.3 Business Environment Outlook
8.1.4 Japan Healthcare Sector Outlook: Generics Will Continue to Create New Opportunities, While the Overall Environment Remains Conducive for Innovation in Clinical Trials and Biotech
8.1.5 Japan Glycated Hemoglobin Testing Market Outlook:
8.2 Revenue (US$ Mn) Comparison, By Country
8.3 Revenue (US$ Mn) Comparison, By Test Type
8.4 Revenue (US$ Mn) Comparison, By End User
8.5 Revenue (US$ Mn) Comparison, By Technique
Chapter 9 APEJ Glycated Hemoglobin Testing Market Size and Forecast, 2012-2026
9.1 APEJ Market Outlook
9.1.1 Political Outlook
9.1.2 Economic Outlook
9.1.3 Business Environment Outlook
9.1.4 Asia Pacific Excluding Japan (APEJ) Healthcare Sector Outlook: Adoption of 3D Printing Will Put the Healthcare Sector on a Robust Growth Path
9.1.5 Asia Pacific Excluding Japan (APEJ) Glycated Hemoglobin Testing Market Outlook:
9.2 Revenue (US$ Mn) Comparison, By Country
9.3 Revenue (US$ Mn) Comparison, By Test Type
9.4 Revenue (US$ Mn) Comparison, By End User
9.5 Revenue (US$ Mn) Comparison, By Technique
Chapter 10 MEA Glycated Hemoglobin Testing Market Size and Forecast, 2012-2026
10.1 MEA Market Outlook
10.1.1 Political Outlook
10.1.2 Economic Outlook
10.1.3 Business Environment Outlook
10.1.4 Middle East & Africa (MEA) Healthcare Sector Outlook: Medical Tourism Will Continue to Shape the Healthcare and Pharmaceutical Sector
10.1.5 Middle East & Africa (MEA) Glycated Hemoglobin Testing Market Outlook:
10.2 Revenue (US$ Mn) Comparison, By Country
10.3 Revenue (US$ Mn) Comparison, By Test Type
10.4 Revenue (US$ Mn) Comparison, By End User
10.5 Revenue (US$ Mn) Comparison, By Technique
Chapter 11 Global Glycated Hemoglobin Market – Competitive Landscape and Company Profiles
11.1 Global Glycated Hemoglobin Market – Company Share Analysis
11.2 Global Glycated Hemoglobin Market – Competitive Landscape
11.3 Global Glycated Hemoglobin Market – Company Profiles
11.3.1 Abbott Laboratories Inc.
11.3.1.1 Company Overview
11.3.1.2 Product Overview
11.3.1.3 Key Financials
11.3.1.4 Key Developments
11.3.1.5 SWOT Analysis
11.3.2 Roche Holdings AG
11.3.2.1 Company Overview
11.3.2.2 Product Overview
11.3.2.3 Key Financials
11.3.2.4 Key Developments
11.3.2.5 SWOT Analysis
11.3.3 Bio-Rad Laboratories, Inc.
11.3.3.1 Company Overview
11.3.3.2 Product Overview
11.3.3.3 Key Financials
11.3.3.4 Key Developments
11.3.3.5 SWOT Analysis
11.3.4 Danaher Corporation
11.3.4.1 Company Overview
11.3.4.2 Product Overview
11.3.4.3 Key Financials
11.3.4.4 SWOT Analysis
11.3.5 Randox Laboratories Ltd.
11.3.5.1 Company Overview
11.3.5.2 Product Overview
11.3.6 Tosoh Bioscience, Inc.
11.3.6.1 Company Overview
11.3.6.2 Product Overview
11.3.7 Arkray, Inc.
11.3.7.1 Company Overview
11.3.7.2 Product Overview
11.3.8 DiaSys Diagnostic Systems
11.3.8.1 Company Overview
11.3.8.2 Product Overview
11.3.9 Siemens AG
11.3.9.1 Company Overview
11.3.9.2 Product Overview
11.3.9.3 Key Financials
11.3.9.4 Key Developments
11.3.9.5 SWOT Analysis
11.3.10 A. Menarini Diagnostics Ltd.
11.3.10.1 Company Overview
11.3.10.2 Product Overview
11.3.11 Trinity Biotech Inc
11.3.11.1 Company Overview
11.3.11.2 Product Overview
11.3.11.3 Key Financials
11.3.12 Sebia SA
11.3.12.1 Company Overview
11.3.12.2 Product Overview
11.4 Key Takeaways
Chapter 12 TMR Research Methodology
Chapter 13 Disclaimer and Contact information
List of Tables
TABLE 1 Global Glycated Hemoglobin Testing Market Value (US$ Mn), 2012-2017
TABLE 2 Global Glycated Hemoglobin Testing Market Value (US$ Mn), 2018-2026
TABLE 3 Global Glycated Hemoglobin Testing Market Value (US$ Mn) and Y-o-Y, 2017-2026
TABLE 4 Global Laboratory Based Test Segment Value (US$ Mn), By Region 2012-2017
TABLE 5 Global Laboratory Based Test Segment Value (US$ Mn), By Region 2018-2026
TABLE 6 Global Laboratory Based Test Segment Market Share, By Region 2012-2017
TABLE 7 Global Laboratory Based Test Segment Market Share, By Region 2018-2026
TABLE 8 Global Laboratory Based Test Segment Y-o-Y, By Region 2017-2026
TABLE 9 Global Point of Care Test Segment Value (US$ Mn), By Region 2012-2017
TABLE 10 Global Point of Care Test Segment Value (US$ Mn), By Region 2018-2026
TABLE 11 Global Point of Care Test Segment Market Share, By Region 2012-2017
TABLE 12 Global Point of Care Test Segment Market Share, By Region 2018-2026
TABLE 13 Global Point of Care Test Segment Y-o-Y, By Region 2017-2026
TABLE 14 Global Hospitals Segment Value (US$ Mn), By Region 2012-2017
TABLE 15 Global Hospitals Segment Value (US$ Mn), By Region 2018-2026
TABLE 16 Global Hospitals Segment Market Share, By Region 2012-2017
TABLE 17 Global Hospitals Segment Market Share, By Region 2018-2026
TABLE 18 Global Hospitals Segment Y-o-Y, By Region 2017-2026
TABLE 19 Global Diagnostic Centers Segment Value (US$ Mn), By Region 2012-2017
TABLE 20 Global Diagnostic Centers Segment Value (US$ Mn), By Region 2018-2026
TABLE 21 Global Diagnostic Centers Segment Market Share, By Region 2012-2017
TABLE 22 Global Diagnostic Centers Segment Market Share, By Region 2018-2026
TABLE 23 Global Diagnostic Centers Segment Y-o-Y, By Region 2017-2026
TABLE 24 Global Academic and Research Institutes Segment Value (US$ Mn), By Region 2012-2017
TABLE 25 Global Academic and Research Institutes Segment Value (US$ Mn), By Region 2018-2026
TABLE 26 Global Academic and Research Institutes Segment Market Share, By Region 2012-2017
TABLE 27 Global Academic and Research Institutes Segment Market Share, By Region 2018-2026
TABLE 28 Global Academic and Research Institutes Segment Y-o-Y, By Region 2017-2026
TABLE 29 Global Other End Users Segment Value (US$ Mn), By Region 2012-2017
TABLE 30 Global Other End Users Segment Value (US$ Mn), By Region 2018-2026
TABLE 31 Global Other End Users Segment Market Share, By Region 2012-2017
TABLE 32 Global Other End Users Segment Market Share, By Region 2018-2026
TABLE 33 Global Other End Users Segment Y-o-Y, By Region 2017-2026
TABLE 34 Global Chromatography Segment Value (US$ Mn), By Region 2012-2017
TABLE 35 Global Chromatography Segment Value (US$ Mn), By Region 2018-2026
TABLE 36 Global Chromatography Segment Market Share, By Region 2012-2017
TABLE 37 Global Chromatography Segment Market Share, By Region 2018-2026
TABLE 38 Global Chromatography Segment Y-o-Y, By Region 2017-2026
TABLE 39 Global Immunoassay Segment Value (US$ Mn), By Region 2012-2017
TABLE 40 Global Immunoassay Segment Value (US$ Mn), By Region 2018-2026
TABLE 41 Global Immunoassay Segment Market Share, By Region 2012-2017
TABLE 42 Global Immunoassay Segment Market Share, By Region 2018-2026
TABLE 43 Global Immunoassay Segment Y-o-Y, By Region 2017-2026
TABLE 44 Global Other Technology Segment Value (US$ Mn), By Region 2012-2017
TABLE 45 Global Other Technology Segment Value (US$ Mn), By Region 2018-2026
TABLE 46 Global Other Technology Segment Market Share, By Region 2012-2017
TABLE 47 Global Other Technology Segment Market Share, By Region 2018-2026
TABLE 48 Global Other Technology Segment Y-o-Y, By Region 2017-2026
TABLE 49 North America Current Expenditure on Health, (% of GDP), by Country, 2010 – 2016
TABLE 50 North America Per Capita Health Expenditure (US$ PPP), by Country, 2010 - 2016
TABLE 51 North America Per Capita Healthcare Expenditure Y-o-Y Growth (in Real terms %), by Country, 2010 - 2016
TABLE 52 North America Out-of-Pocket Healthcare Expenditure, % of Healthcare Expenditure, by Country, 2010 - 2016
TABLE 53 North America Per Capita Healthcare Expenditure (at Current Price, in US$), by Country, 2010 - 2016
TABLE 54 North America Glycated Hemoglobin Testing Market Value (US$ Mn), By Country 2012-2017
TABLE 55 North America Glycated Hemoglobin Testing Market Value (US$ Mn), By Country 2018-2026
TABLE 56 North America Glycated Hemoglobin Testing Market Value (US$ Mn), By Test Type 2012-2017
TABLE 57 North America Glycated Hemoglobin Testing Market Value (US$ Mn), By Test Type 2018-2026
TABLE 58 North America Glycated Hemoglobin Testing Market Value (US$ Mn), By End User 2012-2017
TABLE 59 North America Glycated Hemoglobin Testing Market Value (US$ Mn), By End User 2018-2026
TABLE 60 North America Glycated Hemoglobin Testing Market Value (US$ Mn), By Technique 2012-2017
TABLE 61 North America Glycated Hemoglobin Testing Market Value (US$ Mn), By Technique 2018-2026
TABLE 62 Latin America Current Expenditure on Health, (% of GDP), by Country, 2010 – 2016
TABLE 63 Latin America Per Capita Health Expenditure (US$ PPP), by Country, 2010 - 2016
TABLE 64 Latin America Per Capita Healthcare Expenditure Y-o-Y Growth (in Real terms %), by Country, 2010 - 2016
TABLE 65 Latin America Out-of-Pocket Healthcare Expenditure, % of Healthcare Expenditure, by Country, 2010 - 2016
TABLE 66 Latin America Per Capita Healthcare Expenditure (at Current Price, in US$), by Country, 2010 - 2016
TABLE 67 Latin America Glycated Hemoglobin Testing Market Value (US$ Mn), By Country 2012-2017
TABLE 68 Latin America Glycated Hemoglobin Testing Market Value (US$ Mn), By Country 2018-2026
TABLE 69 Latin America Glycated Hemoglobin Testing Market Value (US$ Mn), By Test Type 2012-2017
TABLE 70 Latin America Glycated Hemoglobin Testing Market Value (US$ Mn), By Test Type 2018-2026
TABLE 71 Latin America Glycated Hemoglobin Testing Market Value (US$ Mn), By End User 2012-2017
TABLE 72 Latin America Glycated Hemoglobin Testing Market Value (US$ Mn), By End User 2018-2026
TABLE 73 Latin America Glycated Hemoglobin Testing Market Value (US$ Mn), By Technique 2012-2017
TABLE 74 Latin America Glycated Hemoglobin Testing Market Value (US$ Mn), By Technique 2018-2026
TABLE 75 Europe Current Expenditure on Health, (% of GDP), by Country, 2010 – 2016
TABLE 76 Europe Per Capita Health Expenditure (US$ PPP), by Country, 2010 - 2016
TABLE 77 Europe Per Capita Healthcare Expenditure Y-o-Y Growth (in Real terms %), by Country, 2010 - 2016
TABLE 78 Europe Out-of-Pocket Healthcare Expenditure, % of Healthcare Expenditure, by Country, 2010 - 2016
TABLE 79 Europe Per Capita Healthcare Expenditure (at Current Price, in US$), by Country, 2010 - 2016
TABLE 80 Europe Glycated Hemoglobin Testing Market Value (US$ Mn), By Country 2012-2017
TABLE 81 Europe Glycated Hemoglobin Testing Market Value (US$ Mn), By Country 2018-2026
TABLE 82 Europe Glycated Hemoglobin Testing Market Value (US$ Mn), By Test Type 2012-2017
TABLE 83 Europe Glycated Hemoglobin Testing Market Value (US$ Mn), By Test Type 2018-2026
TABLE 84 Europe Glycated Hemoglobin Testing Market Value (US$ Mn), By End User 2012-2017
TABLE 85 Europe Glycated Hemoglobin Testing Market Value (US$ Mn), By End User 2018-2026
TABLE 86 Europe Glycated Hemoglobin Testing Market Value (US$ Mn), By Technique 2012-2017
TABLE 87 Europe Glycated Hemoglobin Testing Market Value (US$ Mn), By Technique 2018-2026
TABLE 88 Japan Current Expenditure on Health, (% of GDP), by Country, 2010 – 2016
TABLE 89 Japan Per Capita Health Expenditure (US$ PPP), by Country, 2010 - 2016
TABLE 90 Japan Per Capita Healthcare Expenditure Y-o-Y Growth (in Real terms %), by Country, 2010 - 2016
TABLE 91 Japan Out-of-Pocket Healthcare Expenditure, % of Healthcare Expenditure, by Country, 2010 - 2016
TABLE 92 Japan Per Capita Healthcare Expenditure (at Current Price, in US$), by Country, 2010 - 2016
TABLE 93 Japan Glycated Hemoglobin Testing Market Value (US$ Mn), By Country 2012-2017
TABLE 94 Japan Glycated Hemoglobin Testing Market Value (US$ Mn), By Country 2018-2026
TABLE 95 Japan Glycated Hemoglobin Testing Market Value (US$ Mn), By Test Type 2012-2017
TABLE 96 Japan Glycated Hemoglobin Testing Market Value (US$ Mn), By Test Type 2018-2026
TABLE 97 Japan Glycated Hemoglobin Testing Market Value (US$ Mn), By End User 2012-2017
TABLE 98 Japan Glycated Hemoglobin Testing Market Value (US$ Mn), By End User 2018-2026
TABLE 99 Japan Glycated Hemoglobin Testing Market Value (US$ Mn), By Technique 2012-2017
TABLE 100 Japan Glycated Hemoglobin Testing Market Value (US$ Mn), By Technique 2018-2026
TABLE 101 APEJ Current Expenditure on Health, (% of GDP), by Country, 2010 – 2016
TABLE 102 APEJ Per Capita Health Expenditure (US$ PPP), by Country, 2010 - 2016
TABLE 103 APEJ Per Capita Healthcare Expenditure Y-o-Y Growth (in Real terms %), by Country, 2010 - 2016
TABLE 104 APEJ Out-of-Pocket Healthcare Expenditure, % of Healthcare Expenditure, by Country, 2010 - 2016
TABLE 105 APEJ Per Capita Healthcare Expenditure (at Current Price, in US$), by Country, 2010 - 2016
TABLE 106 APEJ Glycated Hemoglobin Testing Market Value (US$ Mn), By Country 2012-2017
TABLE 107 APEJ Glycated Hemoglobin Testing Market Value (US$ Mn), By Country 2018-2026
TABLE 108 APEJ Glycated Hemoglobin Testing Market Value (US$ Mn), By Test Type 2012-2017
TABLE 109 APEJ Glycated Hemoglobin Testing Market Value (US$ Mn), By Test Type 2018-2026
TABLE 110 APEJ Glycated Hemoglobin Testing Market Value (US$ Mn), By End User 2012-2017
TABLE 111 APEJ Glycated Hemoglobin Testing Market Value (US$ Mn), By End User 2018-2026
TABLE 112 APEJ Glycated Hemoglobin Testing Market Value (US$ Mn), By Technique 2012-2017
TABLE 113 APEJ Glycated Hemoglobin Testing Market Value (US$ Mn), By Technique 2018-2026
TABLE 114 MEA Current Expenditure on Health, (% of GDP), by Country, 2010 – 2016
TABLE 115 MEA Per Capita Health Expenditure (US$ PPP), by Country, 2010 - 2016
TABLE 116 MEA Per Capita Healthcare Expenditure Y-o-Y Growth (in Real terms %), by Country, 2010 - 2016
TABLE 117 MEA Out-of-Pocket Healthcare Expenditure, % of Healthcare Expenditure, by Country, 2010 - 2016
TABLE 118 MEA Per Capita Healthcare Expenditure (at Current Price, in US$), by Country, 2010 - 2016
TABLE 119 MEA Glycated Hemoglobin Testing Market Value (US$ Mn), By Country 2012-2017
TABLE 120 MEA Glycated Hemoglobin Testing Market Value (US$ Mn), By Country 2018-2026
TABLE 121 MEA Glycated Hemoglobin Testing Market Value (US$ Mn), By Test Type 2012-2017
TABLE 122 MEA Glycated Hemoglobin Testing Market Value (US$ Mn), By Test Type 2018-2026
TABLE 123 MEA Glycated Hemoglobin Testing Market Value (US$ Mn), By End User 2012-2017
TABLE 124 MEA Glycated Hemoglobin Testing Market Value (US$ Mn), By End User 2018-2026
TABLE 125 MEA Glycated Hemoglobin Testing Market Value (US$ Mn), By Technique 2012-2017
TABLE 126 MEA Glycated Hemoglobin Testing Market Value (US$ Mn), By Technique 2018-2026
List of Figures
FIG. 1 Global Glycated Hemoglobin Testing Market Value (US$ Mn), 2012-2017
FIG. 2 Global Glycated Hemoglobin Testing Market Value (US$ Mn) Forecast, 2018-2026
FIG. 3 Global Glycated Hemoglobin Testing Market Value (US$ Mn) and Y-o-Y, 2017-2026
FIG. 4 Global Laboratory Based Test Segment Market Value (US$ Mn) By Region, 2012-2017
FIG. 5 Global Laboratory Based Test Segment Market Value (US$ Mn) By Region, 2018-2026
FIG. 6 Global Laboratory Based Test Segment Y-o-Y Growth Rate, By Region, 2017-2026
FIG. 7 Global Point of Care Test Segment Market Value (US$ Mn) By Region, 2012-2017
FIG. 8 Global Point of Care Test Segment Market Value (US$ Mn) By Region, 2018-2026
FIG. 9 Global Point of Care Test Segment Y-o-Y Growth Rate, By Region, 2017-2026
FIG. 10 Global Hospitals Segment Market Value (US$ Mn) By Region, 2012-2017
FIG. 11 Global Hospitals Segment Market Value (US$ Mn) By Region, 2018-2026
FIG. 12 Global Hospitals Segment Y-o-Y Growth Rate, By Region, 2017-2026
FIG. 13 Global Diagnostic Centers Segment Market Value (US$ Mn) By Region, 2012-2017
FIG. 14 Global Diagnostic Centers Segment Market Value (US$ Mn) By Region, 2018-2026
FIG. 15 Global Diagnostic Centers Segment Y-o-Y Growth Rate, By Region, 2017-2026
FIG. 16 Global Academic and Research Institutes Segment Market Value (US$ Mn) By Region, 2012-2017
FIG. 17 Global Academic and Research Institutes Segment Market Value (US$ Mn) By Region, 2018-2026
FIG. 18 Global Academic and Research Institutes Segment Y-o-Y Growth Rate, By Region, 2017-2026
FIG. 19 Global Other End Users Segment Market Value (US$ Mn) By Region, 2012-2017
FIG. 20 Global Other End Users Segment Market Value (US$ Mn) By Region, 2018-2026
FIG. 21 Global Other End Users Segment Y-o-Y Growth Rate, By Region, 2017-2026
FIG. 22 Global Chromatography Segment Market Value (US$ Mn) By Region, 2012-2017
FIG. 23 Global Chromatography Segment Market Value (US$ Mn) By Region, 2018-2026
FIG. 24 Global Chromatography Segment Y-o-Y Growth Rate, By Region, 2017-2026
FIG. 25 Global Immunoassay Segment Market Value (US$ Mn) By Region, 2012-2017
FIG. 26 Global Immunoassay Segment Market Value (US$ Mn) By Region, 2018-2026
FIG. 27 Global Immunoassay Segment Y-o-Y Growth Rate, By Region, 2017-2026
FIG. 28 Global Other Technology Segment Market Value (US$ Mn) By Region, 2012-2017
FIG. 29 Global Other Technology Segment Market Value (US$ Mn) By Region, 2018-2026
FIG. 30 Global Other Technology Segment Y-o-Y Growth Rate, By Region, 2017-2026
FIG. 31 North America Glycated Hemoglobin Testing Market Value (US$ Mn), By Country 2012-2017
FIG. 32 North America Glycated Hemoglobin Testing Market Value (US$ Mn), By Country 2018-2026
FIG. 33 North America Glycated Hemoglobin Testing Market Value (US$ Mn), By Test Type 2012-2017
FIG. 34 North America Glycated Hemoglobin Testing Market Value (US$ Mn), By Test Type 2018-2026
FIG. 35 North America Glycated Hemoglobin Testing Market Value (US$ Mn), By End User 2012-2017
FIG. 36 North America Glycated Hemoglobin Testing Market Value (US$ Mn), By End User 2018-2026
FIG. 37 North America Glycated Hemoglobin Testing Market Value (US$ Mn), By Technique 2012-2017
FIG. 38 North America Glycated Hemoglobin Testing Market Value (US$ Mn), By Technique 2018-2026
FIG. 39 Latin America Glycated Hemoglobin Testing Market Value (US$ Mn), By Country 2012-2017
FIG. 40 Latin America Glycated Hemoglobin Testing Market Value (US$ Mn), By Country 2018-2026
FIG. 41 Latin America Glycated Hemoglobin Testing Market Value (US$ Mn), By Test Type 2012-2017
FIG. 42 Latin America Glycated Hemoglobin Testing Market Value (US$ Mn), By Test Type 2018-2026
FIG. 43 Latin America Glycated Hemoglobin Testing Market Value (US$ Mn), By End User 2012-2017
FIG. 44 Latin America Glycated Hemoglobin Testing Market Value (US$ Mn), By End User 2018-2026
FIG. 45 Latin America Glycated Hemoglobin Testing Market Value (US$ Mn), By Technique 2012-2017
FIG. 46 Latin America Glycated Hemoglobin Testing Market Value (US$ Mn), By Technique 2018-2026
FIG. 47 Europe Glycated Hemoglobin Testing Market Value (US$ Mn), By Country 2012-2017
FIG. 48 Europe Glycated Hemoglobin Testing Market Value (US$ Mn), By Country 2018-2026
FIG. 49 Europe Glycated Hemoglobin Testing Market Value (US$ Mn), By Test Type 2012-2017
FIG. 50 Europe Glycated Hemoglobin Testing Market Value (US$ Mn), By Test Type 2018-2026
FIG. 51 Europe Glycated Hemoglobin Testing Market Value (US$ Mn), By End User 2012-2017
FIG. 52 Europe Glycated Hemoglobin Testing Market Value (US$ Mn), By End User 2018-2026
FIG. 53 Europe Glycated Hemoglobin Testing Market Value (US$ Mn), By Technique 2012-2017
FIG. 54 Europe Glycated Hemoglobin Testing Market Value (US$ Mn), By Technique 2018-2026
FIG. 55 Japan Glycated Hemoglobin Testing Market Value (US$ Mn), By Country 2012-2017
FIG. 56 Japan Glycated Hemoglobin Testing Market Value (US$ Mn), By Country 2018-2026
FIG. 57 Japan Glycated Hemoglobin Testing Market Value (US$ Mn), By Test Type 2012-2017
FIG. 58 Japan Glycated Hemoglobin Testing Market Value (US$ Mn), By Test Type 2018-2026
FIG. 59 Japan Glycated Hemoglobin Testing Market Value (US$ Mn), By Technique 2012-2017
FIG. 60 Japan Glycated Hemoglobin Testing Market Value (US$ Mn), By End User 2018-2026
FIG. 61 Japan Glycated Hemoglobin Testing Market Value (US$ Mn), By Technique 2012-2017
FIG. 62 Japan Glycated Hemoglobin Testing Market Value (US$ Mn), By Technique 2018-2026
FIG. 63 APEJ Glycated Hemoglobin Testing Market Value (US$ Mn), By Country 2012-2017
FIG. 64 APEJ Glycated Hemoglobin Testing Market Value (US$ Mn), By Country 2018-2026
FIG. 65 APEJ Glycated Hemoglobin Testing Market Value (US$ Mn), By Test Type 2012-2017
FIG. 66 APEJ Glycated Hemoglobin Testing Market Value (US$ Mn), By Test Type 2018-2026
FIG. 67 APEJ Glycated Hemoglobin Testing Market Value (US$ Mn), By End User 2012-2017
FIG. 68 APEJ Glycated Hemoglobin Testing Market Value (US$ Mn), By End User 2018-2026
FIG. 69 APEJ Glycated Hemoglobin Testing Market Value (US$ Mn), By Technique 2012-2017
FIG. 70 APEJ Glycated Hemoglobin Testing Market Value (US$ Mn), By Technique 2018-2026
FIG. 71 MEA Glycated Hemoglobin Testing Market Value (US$ Mn), By Country 2012-2017
FIG. 72 MEA Glycated Hemoglobin Testing Market Value (US$ Mn), By Country 2018-2026
FIG. 73 MEA Glycated Hemoglobin Testing Market Value (US$ Mn), By Test Type 2012-2017
FIG. 74 MEA Glycated Hemoglobin Testing Market Value (US$ Mn), By Test Type 2018-2026
FIG. 75 MEA Glycated Hemoglobin Testing Market Value (US$ Mn), By End User 2012-2017
FIG. 76 MEA Glycated Hemoglobin Testing Market Value (US$ Mn), By End User 2018-2026
FIG. 77 MEA Glycated Hemoglobin Testing Market Value (US$ Mn), By Technique 2012-2017
FIG. 78 MEA Glycated Hemoglobin Testing Market Value (US$ Mn), By Technique 2018-2026
Copyright © Transparency Market Research, Inc. All Rights reserved
Trust Online

Glycated Hemoglobin Testing Market