
Reports
Reports
The immense potential of GaN on silicon technology necessitated a detailed analysis, and Transparency Market Research (TMR), in its recent report, offers a 360 degree view of this expanding landscape. The insights presented in this report will arm decision-makers with strategic insights and up-to-date information that can induce a better appreciation and understanding of this market.
Gallium nitride has huge potential over silicon, as it is capable of delivering 70% power efficiency along with higher scalability at high frequencies. Gallium nitride is likely to take over silicon technology due to its wider band gap that is capable of sustaining higher voltage.
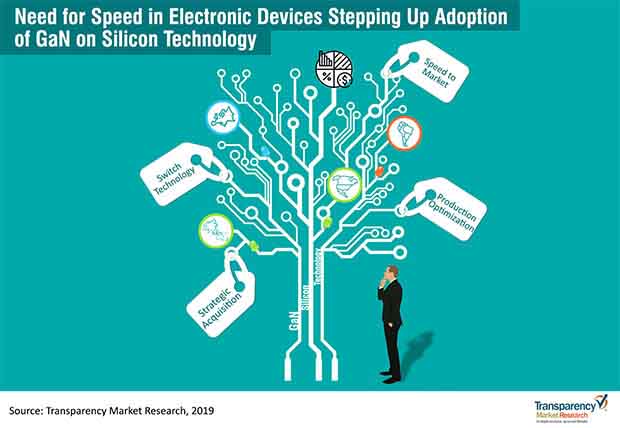
For decades, silicon has remained integral to the technology industry. It has been a key component in the development of electronic devices, including transistors, semiconductors, integrated circuits, and printed circuit boards. However, over the years, lack of innovation has meant that demand has remained limited to a handful of industries. GaN has emerged as a feasible solution, offering end-users higher energy-efficiency and greater temperature resistance.
With such changes and developments, the adoption of GaN on silicon technology is expected to augment at a significant rate. According to our analysis, the global GaN on silicon technology market is likely to grow at 19% CAGR through 2027.
Automotive industry will continue to be at the forefront of adoption, however, it will be the growing penetration in aerospace & defense, and military that will create new avenues of growth. This growth is attributed to the increasing application of GaN on silicon technology in various end-use industries. This is not to say that the importance of automotive industry in this market will be relegated—as the industry goes through a transformation of its own with innovation in electric vehicles and connected cars creating opportunities and challenges—the GaN on silicon technology vendors will do themselves a lot of good by keeping up the pace of innovation. With global revenues set to reach nearly US$ 20 Mn by the end of 2019, the stakeholders in the GaN on silicon technology market will be looking to diversify into new sectors to leverage the emerging opportunities.
GaN on Silicon Technology Landscape: The Impact of Internet-Of-Things (IoT)
The market continues to witness innovation and evolution at every level. Vendors are focusing on improving their existing product portfolios in order to meet the needs of an evolving consumer base. Manufacturers are now focusing on the 200 mm wafer size to expand applications in power conversion applications. Sensing the evolving opportunities, especially in power cobersion applications, companies have started to focus on gaining first-mover advantage: Leti and STMicroelectronics are engaged in advancing power GaN-on-Si diode and transistor architecture. Depending upon the results obtained through the IRT Nanoelec program, working will be transferred to Leti’s 200 mm research and development line, and it is expected to be operational by 2020.
Plessey, another prominent player in the market, has optimized the production of LEDs based on GaN on silicon technology. The company is focusing on offering better thermal performance that helps in providing a high voltage option through the multi on-chip junction. Plessey is also working on leveraging its unique light emission in LEDs. Additionally, they are focusing on a light emitting surface that requires a simple and low-cost optical system.
Apart from these company-level innovations, ongoing trends are also influencing the growth of the global GaN on silicon technology market. Significant rise in the demand for tablets, smart watches, smartphones, and other electronic devices has augmented adoption of this technology.
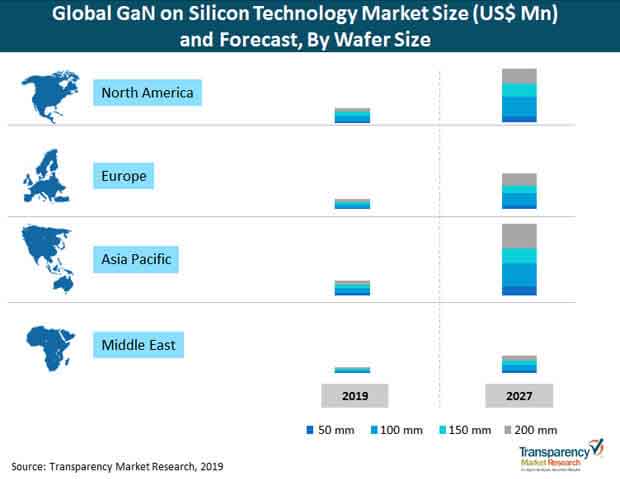
Developing regions are likely to offer high growth opportunity for stakeholders in the GaN-on-silicon technology market. In many cost-sensitive developing countries, operational efficiency continues to be a key influencer—as GaN-based power devices offer enhanced performance, adoption has seen a surge in the recent years. Growth has been especially noticeable in Asia Pacific, where a broader push for increasing manufacturing output necessitated adoption of efficient technologies and products. However, it is pertinent to note that in terms of total revenue generation, it is the developed economies in North America and Europe that hold sway over the market.
Europe, on the other hand, is likely to experience relatively slower growth in the GaN on silicon technology market. Companies such as STMicroelectronics and IBM are investing extensively in the semiconductor industry in Europe. This has resulted in the increased use of silicon wafers, which will trigger competition in industries using GaN on silicon technology.
It is interesting to know that, the GaN silicon technology market shows varied levels of consolidation and fragmentation. The top five leading players in the market hold nearly 50% share. These players hold significant sway in the GaN on silicon technology market, and are usually at the forefront of driving innovation and implementation.
Players in this market are focusing on consolidating their position in regions where skilled labor is available at affordable costs. The intention of producing good quality products at low costs is inducing outsourcing of manufacturing capabilities to developing countries. According to the report’s analysis, prominent players are focusing on innovation and improvement to establish themselves for a long-term in the market.
The authors of the report maintain a bullish outlook on the GaN on silicon technology market. Considering the diversifying applications of GaN on silicon technology, it is highly likely that its adoption will witness a steady increase over the course of the forecast period. Companies that are proactive, rather than reactive, and have a higher risk-appetite, can gain first-mover advantage, especially in industries and regions, where this technology is yet to be fully explored. Although developing countries do offer potential growth opportunities, it will be strategically unsound to completely rely on these markets in lieu of established markets of the US and EU5. The authors of the report opine that considering the market is likely to grow at nearly 19% CAGR through 2027, significant opportunities are likely to emerge, even for small-scale players. Considering the fact that the market is an amalgam of both technology and manufacturing, a symbiotic balance between cost and innovation needs to be maintained.
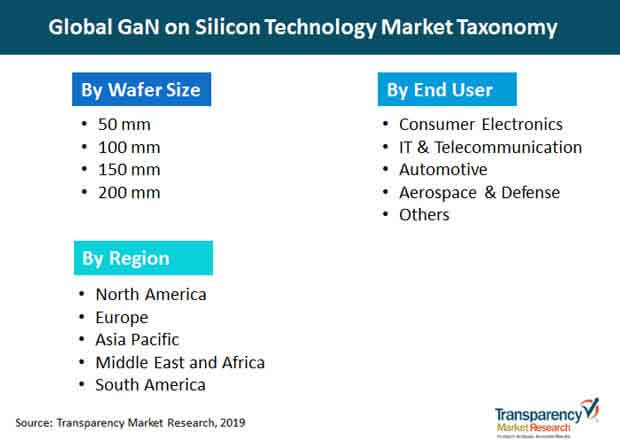
The global GaN on silicon technology market has been segmented based on wafer size, end user, and region.
1. Preface
1.1. Market Definition and Scope
1.2. Market Segmentation
1.3. Key Research Objectives
1.4. Research Highlights
2. Assumptions and Research Methodology
3. Executive Summary: Global GaN on Silicon Technology Market
4. Market Overview
4.1. Introduction
4.2. Market Dynamics
4.2.1. Drivers
4.2.2. Restraints
4.2.3. Opportunities
4.3. Technological Regional Trends
4.4. Global GaN on Silicon Technology Market Analysis and Forecast, 2017–2027
4.4.1. Market Revenue Projection (US$ Mn)
4.5. Porter’s Five Forces Analysis
4.6. Value Chain Analysis
4.7. Global GaN on Silicon Technology Market Outlook
5. Global GaN on Silicon Technology Market Analysis and Forecast, by Wafer Size
5.1. Overview & Definitions
5.2. Global GaN on Silicon Technology Market Revenue (US$ Mn) Forecast, by Wafer Size, 2017–2027
5.2.1. 50 mm
5.2.2. 100 mm
5.2.3. 150 mm
5.2.4. 200 mm
5.3. Wafer Size Comparison Matrix
5.4. Global GaN on Silicon Technology Market Attractiveness, by Wafer Size
6. Global GaN on Silicon Technology Market Analysis and Forecast, by End-use Industry
6.1. Overview & Definitions
6.2. Global GaN on Silicon Technology Market Revenue (US$ Mn) Forecast, by End-use Industry, 2017–2027
6.2.1. Consumer Electronics
6.2.2. IT & Telecommunication
6.2.3. Automotive
6.2.4. Aerospace & Defense
6.2.5. Others
6.3. End-use Industry Comparison Matrix
6.4. Global GaN on Silicon Technology Market Attractiveness, by End-use Industry
7. Global GaN on Silicon Technology Market Analysis and Forecast, by Region
7.1. Overview
7.2. Global GaN on Silicon Technology Market Revenue (US$ Mn) Forecast, by Region, 2017–2027
7.2.1. North America
7.2.2. Europe
7.2.3. Asia Pacific
7.2.4. Middle East & Africa
7.2.5. South America
7.3. Global GaN on Silicon Technology Market Attractiveness, by Region
8. North America GaN on Silicon Technology Market Analysis and Forecast
8.1. Key Findings
8.2. Key Trends
8.3. North America GaN on Silicon Technology Market Revenue (US$ Mn) Forecast, by Wafer Size, 2017–2027
8.3.1. 50 mm
8.3.2. 100 mm
8.3.3. 150 mm
8.3.4. 200 mm
8.4. North America GaN on Silicon Technology Market Revenue (US$ Mn) Forecast, by End-use Industry, 2017–2027
8.4.1. Consumer Electronics
8.4.2. IT & Telecommunication
8.4.3. Automotive
8.4.4. Aerospace & Defense
8.4.5. Others
8.5. North America GaN on Silicon Technology Market Revenue (US$ Mn) Forecast, by Country/Sub-region, 2017–2027
8.5.1. U.S.
8.5.2. Canada
8.5.3. Rest of North America
8.6. North America GaN on Silicon Technology Market Attractiveness Analysis
8.6.1. By Wafer Size
8.6.2. By End-use Industry
8.6.3. By Country/Sub-region
9. Europe GaN on Silicon Technology Market Analysis and Forecast
9.1. Key Findings
9.2. Key Trends
9.3. Europe GaN on Silicon Technology Market Revenue (US$ Mn) Forecast, by Wafer Size, 2017–2027
9.3.1. 50 mm
9.3.2. 100 mm
9.3.3. 150 mm
9.3.4. 200 mm
9.4. Europe GaN on Silicon Technology Market Revenue (US$ Mn) Forecast, by End-use Industry, 2017–2027
9.4.1. Consumer Electronics
9.4.2. IT & Telecommunication
9.4.3. Automotive
9.4.4. Aerospace & Defense
9.4.5. Others
9.5. Europe GaN on Silicon Technology Market Revenue (US$ Mn) Forecast, by Country/Sub-region, 2017–2027
9.5.1. U.K.
9.5.2. Germany
9.5.3. France
9.5.4. Rest of Europe
9.6. Europe GaN on Silicon Technology Market Attractiveness Analysis
9.6.1. By Wafer Size
9.6.2. By End-use Industry
9.6.3. By Country/Sub-region
10. Asia Pacific GaN on Silicon Technology Market Analysis and Forecast
10.1. Key Findings
10.2. Key Trends
10.3. Asia Pacific GaN on Silicon Technology Market Revenue (US$ Mn) Forecast, by Wafer Size, 2017–2027
10.3.1. 50 mm
10.3.2. 100 mm
10.3.3. 150 mm
10.3.4. 200 mm
10.4. Asia Pacific GaN on Silicon Technology Market Revenue (US$ Mn) Forecast, by End-use Industry, 2017–2027
10.4.1. Consumer Electronics
10.4.2. IT & Telecommunication
10.4.3. Automotive
10.4.4. Aerospace & Defense
10.4.5. Others
10.5. Asia Pacific GaN on Silicon Technology Market Revenue (US$ Mn) Forecast, by Country/Sub-region, 2017–2027
10.5.1. China
10.5.2. India
10.5.3. Japan
10.5.4. Rest of Asia Pacific
10.6. Asia Pacific GaN on Silicon Technology Market Attractiveness Analysis
10.6.1. By Wafer Size
10.6.2. By End-use Industry
10.6.3. By Country/Sub-region
11. Middle East & Africa GaN on Silicon Technology Market Analysis and Forecast
11.1. Key Findings
11.2. Key Trends
11.3. Middle East and & Africa GaN on Silicon Technology Market Revenue (US$ Mn) Forecast, by Wafer Size, 2017–2027
11.3.1. 50 mm
11.3.2. 100 mm
11.3.3. 150 mm
11.3.4. 200 mm
11.4. Middle East and & Africa GaN on Silicon Technology Market Revenue (US$ Mn) Forecast, by End-use Industry, 2017–2027
11.4.1. Consumer Electronics
11.4.2. IT & Telecommunication
11.4.3. Automotive
11.4.4. Aerospace & Defense
11.4.5. Others
11.5. Middle East and & Africa GaN on Silicon Technology Market Revenue (US$ Mn) Forecast, by Country/Sub-region, 2017–2027
11.5.1. GCC
11.5.2. South Africa
11.5.3. Rest of Middle East & Africa
11.6. Middle East & Africa GaN on Silicon Technology Market Attractiveness Analysis
11.6.1. By Wafer Size
11.6.2. BY End-use Industry
11.6.3. By Country/Sub-region
12. South America GaN on Silicon Technology Market Analysis and Forecast
12.1. Key Findings
12.2. Key Trends
12.3. South America GaN on Silicon Technology Market Revenue (US$ Mn) Forecast, by Wafer Size, 2017–2027
12.3.1. 50 mm
12.3.2. 100 mm
12.3.3. 150 mm
12.3.4. 200 mm
12.4. South America GaN on Silicon Technology Market Revenue (US$ Mn) Forecast, by End-use Industry, 2017–2027
12.4.1. Consumer Electronics
12.4.2. IT & Telecommunication
12.4.3. Automotive
12.4.4. Aerospace & Defense
12.4.5. Others
12.5. South America GaN on Silicon Technology Market Revenue (US$ Mn) Forecast, by Country/Sub-region, 2017–2027
12.5.1. Brazil
12.5.2. Rest of South America
12.6. South America GaN on Silicon Technology Market Attractiveness Analysis
12.6.1. By Wafer Size
12.6.2. By End-use Industry
12.6.3. By Country/Sub-region
13. Competition Landscape
13.1. Market Players – Competition Matrix
13.2. Global GaN on Silicon Technology Market Share Analysis (%), by Company, 2018
13.3. Company Profiles (Details – Basic Overview, Recent Developments, Geographical Presence, Key Competitors, Revenue, SWOT Analysis, Strategy)
13.3.1. NXP Semiconductor
13.3.2. GaN Systems
13.3.3. Panasonic Corporation
13.3.4. Fujitsu Semiconductor
13.3.5. Transphorm Inc.
13.3.6. Texas Instruments
13.3.7. Qorvo, Inc.
13.3.8. OSRAM Opto Semiconductors GmbH
13.3.9. Infineon Technologies AG
13.3.10. Cree, Inc.
List of Tables
Table 01: Global GaN on Silicon Technology Market Revenue (US$ Mn) Forecast, by Wafer Size, 2017–2027
Table 02: Global GaN on Silicon Technology Market Revenue (US$ Mn) Forecast, by End-use Industry, 2017–2027
Table 03: Global GaN on Silicon Technology Market Revenue (US$ Mn) Forecast, by Region, 2017–2027
Table 04: North America GaN on Silicon Technology Market Revenue (US$ Mn) Forecast, by Wafer Size, 2017–2027
Table 05: North America GaN on Silicon Technology Market Revenue (US$ Mn) Forecast, by End-use Industry, 2017–2027
Table 06: North America GaN on Silicon Technology Market Revenue (US$ Mn) Forecast, by Country/Sub-region, 2017–2027
Table 07: Europe GaN on Silicon Technology Market Revenue (US$ Mn) Forecast, by Wafer Size, 2017–2027
Table 08: Europe GaN on Silicon Technology Market Revenue (US$ Mn) Forecast, by End-use Industry, 2017–2027
Table 09: Europe GaN on Silicon Technology Market Revenue (US$ Mn) Forecast, by Country/Sub-region, 2017–2027
Table 10: Asia Pacific GaN on Silicon Technology Market Revenue (US$ Mn) Forecast, by Wafer Size, 2017–2027
Table 11: Asia Pacific GaN on Silicon Technology Market Revenue (US$ Mn) Forecast, by End-use Industry, 2017–2027
Table 12: Asia Pacific GaN on Silicon Technology Market Revenue (US$ Mn) Forecast, by Country/Sub-region, 2017–2027
Table 13: MEA GaN on Silicon Technology Market Revenue (US$ Mn) Forecast, by Wafer Size, 2017–2027
Table 14: MEA GaN on Silicon Technology Market Revenue (US$ Mn) Forecast, by End-use Industry, 2017–2027
Table 15: MEA GaN on Silicon Technology Market Revenue (US$ Mn) Forecast, by Country/Sub-region, 2017–2027
Table 16: South America GaN on Silicon Technology Market Revenue (US$ Mn) Forecast, by Wafer Size, 2017–2027
Table 17: South America GaN on Silicon Technology Market Revenue (US$ Mn) Forecast, by End-use Industry, 2017–2027
Table 18: South America GaN on Silicon Technology Market Revenue (US$ Mn) Forecast, by Country/Sub-region, 2017–2027
List of Figures
Figure 01: Global GaN on Silicon Technology Market Revenue (US$ Mn) Projection, 2017–2027
Figure 02: Global GaN on Silicon Technology Market Y-o-Y Growth (%) Forecast, 2017–2027
Figure 03: Porter’s Five Forces Analysis
Figure 04: Value Chain Analysis – Global GaN on Silicon Technology Market
Figure 05: Global GaN on Silicon Technology Market Value Share Analysis, by Wafer Size (2019)
Figure 06: Global GaN on Silicon Technology Market Value Share Analysis, by End-use Industry (2019)
Figure 07: Global GaN on Silicon Technology Market Value Share Analysis, by Region (2019)
Figure 08: Global GaN on Silicon Technology Market Value Share Analysis, by Wafer Size, 2019 and 2027
Figure 09: Global GaN on Silicon Technology Market, by Wafer Size, 50 mm
Figure 10: Global GaN on Silicon Technology Market, by Wafer Size, 100 mm
Figure 11: Global GaN on Silicon Technology Market, by Wafer Size, 150 mm
Figure 12: Global GaN on Silicon Technology Market, by Wafer Size, 200 mm
Figure 13: Global GaN on Silicon Technology Market Comparison Matrix, by Wafer Size
Figure 14: GaN on Silicon Technology Market Attractiveness Analysis, by Wafer Size
Figure 15: Global GaN on Silicon Technology Market Value Share Analysis, by End-use Industry, 2019 and 2027
Figure 16: Global GaN on Silicon Technology Market, by End-use Industry, Consumer Electronics
Figure 17: Global GaN on Silicon Technology Market, by End-use Industry, IT & Telecommunication
Figure 18: Global GaN on Silicon Technology Market, by End-use Industry, Automotive
Figure 19: Global GaN on Silicon Technology Market, by End-use Industry, Aerospace & Defense
Figure 20: Global GaN on Silicon Technology Market, by End-use Industry, Others
Figure 21: Global GaN on Silicon Technology Market Comparison Matrix, by End-use Industry
Figure 22: Global GaN on Silicon Technology Market Attractiveness Analysis, by End-use Industry
Figure 23: Global GaN on Silicon Technology Market Value Share Analysis, by Region, 2019 and 2027
Figure 24: Global GaN on Silicon Technology Market Comparison Matrix, by Region
Figure 25: Global GaN on Silicon Technology Market Attractiveness Analysis, by Region
Figure 26: North America GaN on Silicon Technology Market Value Share Analysis, by Wafer Size, 2019 and 2027
Figure 27: North America GaN on Silicon Technology Market, by Wafer Size, 50 mm
Figure 28: North America GaN on Silicon Technology Market, by Wafer Size, 100 mm
Figure 29: North America GaN on Silicon Technology Market, by Wafer Size, 150 mm
Figure 30: North America GaN on Silicon Technology Market, by Wafer Size, 200 mm
Figure 31: North America GaN on Silicon Technology Market Value Share Analysis, by End-use Industry, 2019 and 2027
Figure 32: North America GaN on Silicon Technology Market, by End-use Industry, Consumer Electronics
Figure 33: North America GaN on Silicon Technology Market, by End-use Industry, IT & Telecommunication
Figure 34: North America GaN on Silicon Technology Market, by End-use Industry, Automotive
Figure 35: North America GaN on Silicon Technology Market, by End-use Industry, Aerospace & Defense
Figure 36: North America GaN on Silicon Technology Market, by End-use Industry, Others
Figure 37: North America GaN on Silicon Technology Market Value Share Analysis, by Country/Sub-region, 2019 and 2027
Figure 38: North America GaN on Silicon Technology Market Attractiveness Analysis, by Wafer Size
Figure 39: North America GaN on Silicon Technology Market Attractiveness Analysis, by End-use Industry
Figure 40: North America GaN on Silicon Technology Market Attractiveness Analysis, by Country/Sub-region
Figure 41: Europe GaN on Silicon Technology Market Value Share Analysis, by Wafer Size, 2019 and 2027
Figure 42: Europe GaN on Silicon Technology Market, by Wafer Size, 50 mm
Figure 43: Europe GaN on Silicon Technology Market, by Wafer Size, 100 mm
Figure 44: Europe GaN on Silicon Technology Market, by Wafer Size, 150 mm
Figure 45: Europe GaN on Silicon Technology Market, by Wafer Size, 200 mm
Figure 46: Europe GaN on Silicon Technology Market Value Share Analysis, by End-use Industry, 2019 and 2027
Figure 47: Europe GaN on Silicon Technology Market, by End-use Industry, Consumer Electronics
Figure 48: Europe GaN on Silicon Technology Market, by End-use Industry, IT & Telecommunication
Figure 49: Europe GaN on Silicon Technology Market, by End-use Industry, Automotive
Figure 50: Europe GaN on Silicon Technology Market, by End-use Industry, Aerospace & Defense
Figure 51: Europe GaN on Silicon Technology Market, by End-use Industry, Others
Figure 52: Europe GaN on Silicon Technology Market Value Share Analysis, by Country/Sub-region, 2019 and 2027
Figure 53: Europe GaN on Silicon Technology Market Attractiveness Analysis, by Wafer Size
Figure 54: Europe GaN on Silicon Technology Market Attractiveness Analysis, by End-use Industry
Figure 55: Europe GaN on Silicon Technology Market Attractiveness Analysis, by Country/Sub-region
Figure 56: Asia Pacific GaN on Silicon Technology Market Value Share Analysis, by Wafer Size, 2019 and 2027
Figure 57: Asia Pacific GaN on Silicon Technology Market, by Wafer Size, 50 mm
Figure 58: Asia Pacific GaN on Silicon Technology Market, by Wafer Size, 100 mm
Figure 59: Asia Pacific GaN on Silicon Technology Market, by Wafer Size, 150 mm
Figure 60: Asia Pacific GaN on Silicon Technology Market, by Wafer Size, 200 mm
Figure 61: Asia Pacific GaN on Silicon Technology Market Value Share Analysis, by End-use Industry, 2019 and 2027
Figure 62: Asia Pacific GaN on Silicon Technology Market, by End-use Industry, Consumer Electronics
Figure 63: Asia Pacific GaN on Silicon Technology Market, by End-use Industry, IT & Telecommunication
Figure 64: Asia Pacific GaN on Silicon Technology Market, by End-use Industry, Automotive
Figure 65: Asia Pacific GaN on Silicon Technology Market, by End-use Industry, Aerospace & Defense
Figure 66: Asia Pacific GaN on Silicon Technology Market, by End-use Industry, Others
Figure 67: Asia Pacific GaN on Silicon Technology Market Value Share Analysis, by Country/Sub-region, 2019 and 2027
Figure 68: Asia Pacific GaN on Silicon Technology Market Attractiveness Analysis, by Wafer Size
Figure 69: Asia Pacific GaN on Silicon Technology Market Attractiveness Analysis, by End-use Industry
Figure 70: Asia Pacific GaN on Silicon Technology Market Attractiveness Analysis, by Country/Sub-region
Figure 71: MEA GaN on Silicon Technology Market Value Share Analysis, by Wafer Size, 2019 and 2027
Figure 72: MEA GaN on Silicon Technology Market, by Wafer Size, 50 mm
Figure 73: MEA GaN on Silicon Technology Market, by Wafer Size, 100 mm
Figure 74: MEA GaN on Silicon Technology Market, by Wafer Size, 150 mm
Figure 75: MEA GaN on Silicon Technology Market, by Wafer Size, 200 mm
Figure 76: MEA GaN on Silicon Technology Market Value Share Analysis, by End-use Industry, 2019 and 2027
Figure 77: MEA GaN on Silicon Technology Market, by End-use Industry, Consumer Electronics
Figure 78: MEA GaN on Silicon Technology Market, by End-use Industry, IT & Telecommunication
Figure 79: MEA GaN on Silicon Technology Market, by End-use Industry, Automotive
Figure 80: MEA GaN on Silicon Technology Market, by End-use Industry, Aerospace & Defense
Figure 81: MEA GaN on Silicon Technology Market, by End-use Industry, Others
Figure 82: MEA GaN on Silicon Technology Market Value Share Analysis, by Country/Sub-region, 2019 and 2027
Figure 83: MEA GaN on Silicon Technology Market Attractiveness Analysis, by Wafer Size
Figure 84: MEA GaN on Silicon Technology Market Attractiveness Analysis, by End-use Industry
Figure 85: MEA GaN on Silicon Technology Market Attractiveness Analysis, by Country/Sub-region
Figure 86: South America GaN on Silicon Technology Market Value Share Analysis, by Wafer Size, 2019 and 2027
Figure 87: South America GaN on Silicon Technology Market, by Wafer Size, 50 mm
Figure 88: South America GaN on Silicon Technology Market, by Wafer Size, 100 mm
Figure 89: South America GaN on Silicon Technology Market, by Wafer Size, 150 mm
Figure 90: South America GaN on Silicon Technology Market, by Wafer Size, 200 mm
Figure 91: South America GaN on Silicon Technology Market Value Share Analysis, by End-use Industry, 2019 and 2027
Figure 92: South America GaN on Silicon Technology Market, by End-use Industry, Consumer Electronics
Figure 93: South America GaN on Silicon Technology Market, by End-use Industry, IT & Telecommunication
Figure 94: South America GaN on Silicon Technology Market, by End-use Industry, Automotive
Figure 95: South America GaN on Silicon Technology Market, by End-use Industry, Aerospace & Defense
Figure 96: South America GaN on Silicon Technology Market, by End-use Industry, Others
Figure 97: South America GaN on Silicon Technology Market Value Share Analysis, by Country/Sub-region, 2019 and 2027
Figure 98: South America GaN on Silicon Technology Market Attractiveness Analysis, by Wafer Size
Figure 99: South America GaN on Silicon Technology Market Attractiveness Analysis, by End-use Industry
Figure 100: South America GaN on Silicon Technology Market Attractiveness Analysis, by Country/Sub-region
Figure 101: Global GaN on Silicon Technology Market Share Analysis, by Company (2018)
Copyright © Transparency Market Research, Inc. All Rights reserved
Trust Online

GaN on Silicon Technology Market