
Reports
Reports
In the current day and age, fast-paced urbanization, industrialization, and the flurry of new technologies have led to environmental issues, such as an imbalance in the ecological process of soil, global warming, undesired climate change, etc. The consistent deposition of xenobiotic recalcitrant compounds in the environment has had hazardous repercussions due to which, several disposing techniques and strategies have emerged in recent years. At present, one of the most popular disposing strategies that have gained considerable attention is bioremediation. At present, a broad spectrum of bioremediation technologies and services are increasingly being used in bio stimulation, bio augmentation, phytoremediation, fungal remediation, land-based remediation, and bioreactors.
Research and development activities continue to investigate the benefits and drawbacks of each of these bioremediation technologies and services. At present, biological bioremediation technologies and services, including bio stimulation and bio augmentation are increasingly being used to the higher efficacy levels and superior eco-friendliness quotient in comparison with the other existing alternatives. As the government bodies across the world continue to focus on environment protection, the bioremediation technology & services market is expected to witness noteworthy growth during the forecast period. Due to these factors, along with consistent research and development, the global bioremediation technology & services market is expected to attain a market value of ~US$ 20 Bn by the end of 2030.
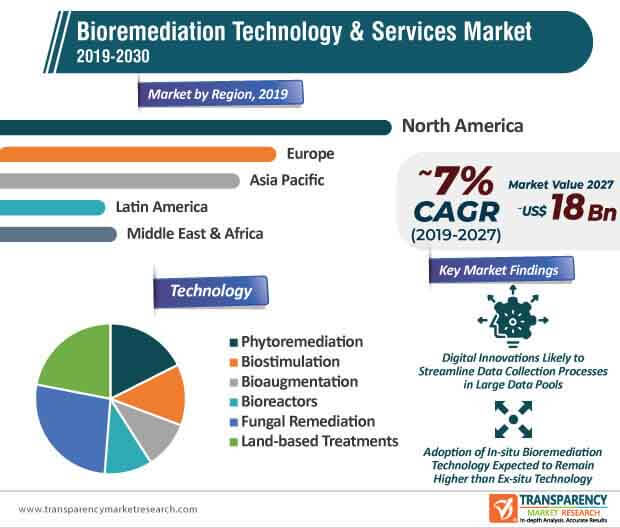
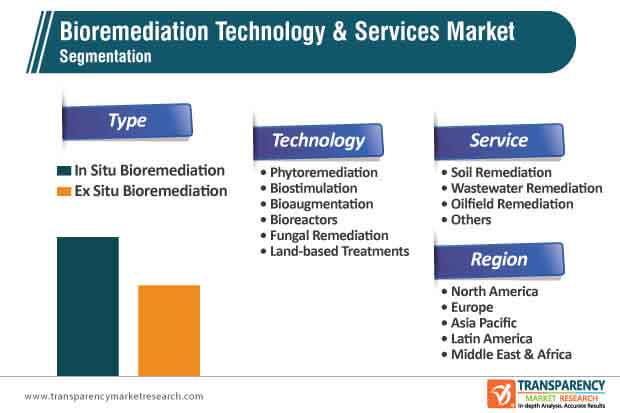
Over the past couple of decades, new techniques and concepts to treat contaminated soil have emerged. At present, the adoption of the in situ bioremediation technology & services is relatively higher than that of ex situ bioremediation technology & services due to economic benefits and the trend is likely to continue during the forecast period. Some of the most extensively deployed in situ bioremediation technologies & services include natural attenuation, bio slurping, composting, bio venting, and microbe-assisted phytoremediation.
The past couple of decades have witnessed consistent developments in the bioremediation techniques due to the mounting environmental concerns and emphasis on the development of a sustainable industrial and urban ecosystem. The adoption of biological remediation technologies & services is likely to be higher than that of the existing physical and chemical remediation techniques due to lower costs and environment-friendly features. Some of the most extensively deployed in situ bioremediation processes around the world include natural attenuation, bio augmentation, and bio stimulation. This is likely to drive the bioremediation technology & services market during the forecast period.
In the last decade, the bioremediation technology & services market has witnessed a considerable amount of activity as market participants continue to prioritize launching cutting-edge bioremediation solutions that primarily support stabilization, sequestration, recovery, and destruction of contaminants. Advancements in the global bioremediation technology & services market during the forecast period are likely to occur in two main areas, including innovations that aim to improve the resolution at which the overlay of contaminants and hydrogeology can be interpreted and digital innovations that are expected to streamline the data collection process across larger data pools.
Research and development activities, along with the growing number of government initiatives and investments to support these activities are expected to provide a considerable boost to the development of the global bioremediation technology & services market. For instance, the Environmental Biotechnology program, initiated by the Government of India largely focuses on assisting the research and development activities within the bioremediation sphere. While wastewater treatment and soil remediation are likely to remain the most prominent service types, the growing demand for degradation of dyes from the textile industrial affluent is expected to play a key role in accelerating the development of phytoremediation treatment processes.
As the COVID-19 infection spreads across the world, operations across an array of industrial sectors have been affected considerably. The COVID-19 pandemic is expected to have a short-term impact on the overall growth of the global bioremediation technology & services market. As governments across the world seek novel ways to contain the transmission of the COVID-19 virus, lockdowns, trade restrictions, and stringent transportation guidelines are expected to stall the development of new bioremediation technologies & services.
While the demand is likely to remain relatively low in 2020, the analysts at the Transparency Market Research predict that the adoption of bioremediation technology & services is projected to witness considerable growth in the upcoming months as operations across the value chain of the global bioremediation technology & services market resume gradually.
Analysts’ Viewpoint
The global bioremediation technology & services market is expected to grow at an impressive CAGR of ~7% during the forecast period. The mounting environmental concerns coupled with stringent environment protection guidelines, research and development, entry of innovative bioremediation technologies and services, and rise in the number of government initiatives and programs, which aim to support research and development in the current landscape will play an important role in boosting the overall growth of the bioremediation technology & services market during the assessment period.
Bioremediation technology & services market to reach valuation of ~US$ 20 Bn by 2030
Bioremediation technology & services market is expected to expand at a CAGR of ~7% during from 2020 to 2030
Bioremediation technology & services market is driven by rise in awareness about the scarcity of natural resources
North America accounted for a major share of the global bioremediation technology & services market
Key players in the global bioremediation technology & services market include REGENESIS, Xylem, Inc., Aquatech International LLC, Drylet LLC, Altogen Labs, InSitu Remediation Services Limited
1. Preface
1.1. Market Definition and Scope
1.2. Market Segmentation
1.3. Key Research Objectives
1.4. Research Highlights
2. Assumptions and Research Methodology
3. Executive Summary : Global Bioremediation Technology & Services Market
4. Market Overview
4.1. Introduction
4.1.1. Technology & Services Definition
4.1.2. Industry Evolution / Developments
4.2. Overview
4.3. Market Dynamics
4.3.1. Drivers
4.3.2. Restraints
4.3.3. Opportunities
4.4. Global Bioremediation Technology & Services Market Analysis and Forecast, 2018–2030
4.4.1. Market Revenue Projections (US$ Mn)
5. Key Insights
5.1. Bioremediation Service Offerings Comparative Assessment, by Company
5.2. Key Bioremediation Projects-Snapshot
5.3. Government Initiatives/Key Investments Assessment
6. Global Bioremediation Technology & Services Market Analysis and Forecast, by Type
6.1. Introduction & Definition
6.2. Key Findings / Developments
6.3. Market Value Forecast, by Type, 2018–2030
6.3.1. In Situ Bioremediation
6.3.2. Ex Situ Bioremediation
6.4. Market Attractiveness, by Type
7. Global Bioremediation Technology & Services Market Analysis and Forecast, by Technology
7.1. Introduction & Definition
7.2. Key Findings / Developments
7.3. Market Value Forecast, by Technology, 2018–2030
7.3.1. Phytoremediation
7.3.2. Biostimulation
7.3.3. Bioaugmentation
7.3.4. Bioreactors
7.3.5. Fungal Remediation
7.3.6. Land-based Treatments
7.4. Market Attractiveness, by Technology
8. Global Bioremediation Technology & Services Market Analysis and Forecast, by Services
8.1. Introduction & Definition
8.2. Key Findings / Developments
8.3. Market Value Forecast, by Services, 2018–2030
8.3.1. Soil Remediation
8.3.2. Wastewater Remediation
8.3.3. Oilfield Remediation
8.3.4. Others
8.4. Market Attractiveness, by Services
9. Global Bioremediation Technology & Services Market Analysis and Forecast, by Region
9.1. Key Findings
9.2. Market Value Forecast, by Region
9.2.1. North America
9.2.2. Europe
9.2.3. Asia Pacific
9.2.4. Latin America
9.2.5. Middle East & Africa
9.3. Market Attractiveness, by Region
10. North America Bioremediation Technology & Services Market Analysis and Forecast
10.1. Introduction
10.1.1. Key Findings
10.2. Market Value Forecast, by Type, 2018–2030
10.2.1. In Situ Bioremediation
10.2.2. Ex Situ Bioremediation
10.3. Market Value Forecast, by Technology, 2018–2030
10.3.1. Phytoremediation
10.3.2. Biostimulation
10.3.3. Bioaugmentation
10.3.4. Bioreactors
10.3.5. Fungal Remediation
10.3.6. Land-based Treatments
10.4. Market Value Forecast, by Services, 2018–2030
10.4.1. Soil Remediation
10.4.2. Wastewater Remediation
10.4.3. Oilfield Remediation
10.4.4. Others
10.5. Market Value Forecast, by Country, 2018–2030
10.5.1. U.S.
10.5.2. Canada
10.6. Market Attractiveness Analysis
10.6.1. By Type
10.6.2. By Technology
10.6.3. By Services
10.6.4. By Country
11. Europe Bioremediation Technology & Services Market Analysis and Forecast
11.1. Introduction
11.1.1. Key Findings
11.2. Market Value Forecast, by Type, 2018–2030
11.2.1. In Situ Bioremediation
11.2.2. Ex Situ Bioremediation
11.3. Market Value Forecast, by Technology, 2018–2030
11.3.1. Phytoremediation
11.3.2. Biostimulation
11.3.3. Bioaugmentation
11.3.4. Bioreactors
11.3.5. Fungal Remediation
11.3.6. Land-based Treatments
11.4. Market Value Forecast, by Services, 2018–2030
11.4.1. Soil Remediation
11.4.2. Wastewater Remediation
11.4.3. Oilfield Remediation
11.4.4. Others
11.5. Market Value Forecast, by Country/Sub-region, 2018–2030
11.5.1. Germany
11.5.2. U.K.
11.5.3. France
11.5.4. Spain
11.5.5. Italy
11.5.6. Rest of Europe
11.6. Market Attractiveness Analysis
11.6.1. By Type
11.6.2. By Technology
11.6.3. By Services
11.6.4. By Country/Sub-region
12. Asia Pacific Bioremediation Technology & Services Market Analysis and Forecast
12.1. Introduction
12.1.1. Key Findings
12.2. Market Value Forecast, by Type, 2018–2030
12.2.1. In Situ Bioremediation
12.2.2. Ex Situ Bioremediation
12.3. Market Value Forecast, by Technology, 2018–2030
12.3.1. Phytoremediation
12.3.2. Biostimulation
12.3.3. Bioaugmentation
12.3.4. Bioreactors
12.3.5. Fungal Remediation
12.3.6. Land-based Treatments
12.4. Market Value Forecast, by Services, 2018–2030
12.4.1. Soil Remediation
12.4.2. Wastewater Remediation
12.4.3. Oilfield Remediation
12.4.4. Others
12.5. Market Value Forecast, by Country/Sub-region, 2018–2030
12.5.1. China
12.5.2. Japan
12.5.3. India
12.5.4. Australia & New Zealand
12.5.5. Rest of Asia Pacific
12.6. Market Attractiveness Analysis
12.6.1. By Type
12.6.2. By Technology
12.6.3. By Services
12.6.4. By Country/Sub-region
13. Latin America Bioremediation Technology & Services Market Analysis and Forecast
13.1. Introduction
13.1.1. Key Findings
13.2. Market Value Forecast, by Type, 2018–2030
13.2.1. In Situ Bioremediation
13.2.2. Ex Situ Bioremediation
13.3. Market Value Forecast, by Technology, 2018–2030
13.3.1. Phytoremediation
13.3.2. Biostimulation
13.3.3. Bioaugmentation
13.3.4. Bioreactors
13.3.5. Fungal Remediation
13.3.6. Land-based Treatments
13.4. Market Value Forecast, by Services, 2018–2030
13.4.1. Soil Remediation
13.4.2. Wastewater Remediation
13.4.3. Oilfield Remediation
13.4.4. Others
13.5. Market Value Forecast, by Country/Sub-region, 2018–2030
13.5.1. Brazil
13.5.2. Mexico
13.5.3. Rest of Latin America
13.6. Market Attractiveness Analysis
13.6.1. By Type
13.6.2. By Technology
13.6.3. By Services
13.6.4. By Country/Sub-region
14. Middle East & Africa Bioremediation Technology & Services Market Analysis and Forecast
14.1. Introduction
14.1.1. Key Findings
14.2. Market Value Forecast, by Type, 2018–2030
14.2.1. In Situ Bioremediation
14.2.2. Ex Situ Bioremediation
14.3. Market Value Forecast, by Technology, 2018–2030
14.3.1. Phytoremediation
14.3.2. Biostimulation
14.3.3. Bioaugmentation
14.3.4. Bioreactors
14.3.5. Fungal Remediation
14.3.6. Land-based Treatments
14.4. Market Value Forecast, by Services, 2018–2030
14.4.1. Soil Remediation
14.4.2. Wastewater Remediation
14.4.3. Oilfield Remediation
14.4.4. Others
14.5. Market Value Forecast, by Country/Sub-region, 2018–2030
14.5.1. GCC Countries
14.5.2. South Africa
14.5.3. Rest of Middle East & Africa
14.6. Market Attractiveness Analysis
14.6.1. By Type
14.6.2. By Technology
14.6.3. By Services
14.6.4. By Country/Sub-region
15. Competition Landscape
15.1. Market Player – Competition Matrix (By Tier and Size of companies)
15.2. Competitive Positioning
15.3. Competitive Business Strategies
15.4. Company Profiles
15.4.1. REGENESIS
15.4.1.1. Company Overview (HQ, Business Segments, Employee Strength)
15.4.1.2. Company Financials
15.4.1.3. Growth Strategies
15.4.1.4. SWOT Analysis
15.4.2. Aquatech International LLC
15.4.2.1. Company Overview (HQ, Business Segments, Employee Strength)
15.4.2.2. Company Financials
15.4.2.3. Growth Strategies
15.4.2.4. SWOT Analysis
15.4.3. Xylem Inc.
15.4.3.1. Company Overview (HQ, Business Segments, Employee Strength)
15.4.3.2. Company Financials
15.4.3.3. Growth Strategies
15.4.3.4. SWOT Analysis
15.4.4. Drylet LLC
15.4.4.1. Company Overview (HQ, Business Segments, Employee Strength)
15.4.4.2. Company Financials
15.4.4.3. Growth Strategies
15.4.4.4. SWOT Analysis
15.4.5. Altogen Labs
15.4.5.1. Company Overview (HQ, Business Segments, Employee Strength)
15.4.5.2. Company Financials
15.4.5.3. Growth Strategies
15.4.5.4. SWOT Analysis
15.4.6. InSitu Remediation Services Limited
15.4.6.1. Company Overview (HQ, Business Segments, Employee Strength)
15.4.6.2. Company Financials
15.4.6.3. Growth Strategies
15.4.6.4. SWOT Analysis
15.4.7. PROBIOSPHERE
15.4.7.1. Company Overview (HQ, Business Segments, Employee Strength)
15.4.7.2. Company Financials
15.4.7.3. Growth Strategies
15.4.7.4. SWOT Analysis
15.4.8. Ivey International, Inc.
15.4.8.1. Company Overview (HQ, Business Segments, Employee Strength)
15.4.8.2. Company Financials
15.4.8.3. Growth Strategies
15.4.8.4. SWOT Analysis
15.4.9. Sumas Remediation Services, Inc.
15.4.9.1. Company Overview (HQ, Business Segments, Employee Strength)
15.4.9.2. Company Financials
15.4.9.3. Growth Strategies
15.4.9.4. SWOT Analysis
15.4.10. Sarva Bio Remed, LLC
15.4.10.1. Company Overview (HQ, Business Segments, Employee Strength)
15.4.10.2. Company Financials
15.4.10.3. Growth Strategies
15.4.10.4. SWOT Analysis
List of Tables
Table 01: Bioremediation Technology & Services Market Offerings, by Company
Table 02: Global Bioremediation Technology & Services Market Value (US$ Mn) Forecast, by Type, 2018–2030
Table 03: Global Bioremediation Technology & Services Market Value (US$ Mn) Forecast, by Technology, 2018–2030
Table 04: Global Bioremediation Technology & Services Market Value (US$ Mn) Forecast, by Services, 2018–2030
Table 05: Global Bioremediation Technology & Services Market Value (US$ Mn) Forecast, by Region, 2018–2030
Table 06: North America Bioremediation Technology & Services Market Value (US$ Mn) Forecast, by Country, 2018–2030
Table 07: North America Bioremediation Technology & Services Market Value (US$ Mn) Forecast, by Type, 2018–2030
Table 08: North America Bioremediation Technology & Services Market Value (US$ Mn) Forecast, by Technology, 2018–2030
Table 09: North America Bioremediation Technology & Services Market Value (US$ Mn) Forecast, by Services, 2018–2030
Table 10: Europe Bioremediation Technology & Services Market Value (US$ Mn) Forecast, by Country/Sub-region, 2018–2030
Table 11: Europe Bioremediation Technology & Services Market Value (US$ Mn) Forecast, by Type, 2018–2030
Table 12: Europe Bioremediation Technology & Services Market Value (US$ Mn) Forecast, by Technology, 2018–2030
Table 13: Europe Bioremediation Technology & Services Market Value (US$ Mn) Forecast, by Services, 2018–2030
Table 14: Asia Pacific Bioremediation Technology & Services Market Value (US$ Mn) Forecast, by Country/Sub-region, 2018–2030
Table 15: Asia Pacific Bioremediation Technology & Services Market Value (US$ Mn) Forecast, by Type, 2018–2030
Table 16: Asia Pacific Bioremediation Technology & Services Market Value (US$ Mn) Forecast, by Technology, 2018–2030
Table 17: Asia Pacific Bioremediation Technology & Services Market Value (US$ Mn) Forecast, by Services, 2018–2030
Table 18: Latin America Bioremediation Technology & Services Market Value (US$ Mn) Forecast, by Country/Sub-region, 2018–2030
Table 19: Latin America Bioremediation Technology & Services Market Value (US$ Mn) Forecast, by Type, 2018–2030
Table 20: Latin America Bioremediation Technology & Services Market Value (US$ Mn) Forecast, by Technology, 2018–2030
Table 21: Latin America Bioremediation Technology & Services Market Value (US$ Mn) Forecast, by Services, 2018–2030
Table 22: Middle East & Africa Bioremediation Technology & Services Market Value (US$ Mn) Forecast, by Country/Sub-region, 2018–2030
Table 23: Middle East & Africa Bioremediation Technology & Services Market Value (US$ Mn) Forecast, by Type, 2018–2030
Table 24: Middle East & Africa Bioremediation Technology & Services Market Value (US$ Mn) Forecast, by Technology, 2018–2030
Table 25: Middle East & Africa Bioremediation Technology & Services Market Value (US$ Mn) Forecast, by Services, 2018–2030
List of Figures
Figure 01: Global Bioremediation Technology & Services Market Value (US$ Mn) and Distribution, by Region, 2019 and 2030
Figure 02: Global Bioremediation Technology & Services Market Value (US$ Mn) Forecast, 2018–2030
Figure 03: Global Bioremediation Technology & Services Market Value Share, by Type, 2019
Figure 04: Global Bioremediation Technology & Services Market Value Share, by Technology, 2019
Figure 05: Global Bioremediation Technology & Services Market Value Share, by Services, 2019
Figure 06: Global Bioremediation Technology & Services Market Value Share, by Region, 2019
Figure 07: Global Bioremediation Technology & Services Market Value Share Analysis, by Type, 2019 and 2030
Figure 08: Global Bioremediation Technology & Services Market Revenue (US$ Mn) and Y-o-Y Growth (%), by In Situ Bioremediation, 2018-2030
Figure 09: Global Bioremediation Technology & Services Market Revenue (US$ Mn) and Y-o-Y Growth (%), by Ex Situ Bioremediation, 2018-2030
Figure 10: Global Bioremediation Technology & Services Market Attractiveness Analysis, by Type, 2020–2030
Figure 11: Global Bioremediation Technology & Services Market Value Share Analysis, by Technology, 2019 and 2030
Figure 12: Global Bioremediation Technology & Services Market Revenue (US$ Mn) and Y-o-Y Growth (%), by Phytoremediation, 2018-2030
Figure 13: Global Bioremediation Technology & Services Market Revenue (US$ Mn) and Y-o-Y Growth (%), by Biostimulation, 2018-2030
Figure 14: Global Bioremediation Technology & Services Market Revenue (US$ Mn) and Y-o-Y Growth (%), by Bioaugmentation, 2018-2030
Figure 15: Global Bioremediation Technology & Services Market Revenue (US$ Mn) and Y-o-Y Growth (%), by Bioreactors, 2018-2030
Figure 16: Global Bioremediation Technology & Services Market Revenue (US$ Mn) and Y-o-Y Growth (%), by Fungal Remediation, 2018-2030
Figure 17: Global Bioremediation Technology & Services Market Revenue (US$ Mn) and Y-o-Y Growth (%), by Land-based Treatments, 2018-2030
Figure 18: Global Bioremediation Technology & Services Market Attractiveness Analysis, by Technology 2020-2030
Figure 19: Global Bioremediation Technology & Services Market Value Share Analysis, by Services, 2019 and 2030
Figure 20: Global Bioremediation Technology & Services Market Revenue (US$ Mn) and Y-o-Y Growth (%), by Soil Remediation, 2018-2030
Figure 21: Global Bioremediation Technology & Services Market Revenue (US$ Mn) and Y-o-Y Growth (%), by Wastewater Remediation, 2018-2030
Figure 22: Global Bioremediation Technology & Services Market Revenue (US$ Mn) and Y-o-Y Growth (%), by Oilfield Remediation, 2018-2030
Figure 23: Global Bioremediation Technology & Services Market Revenue (US$ Mn) and Y-o-Y Growth (%), by Others, 2018-2030
Figure 24: Global Bioremediation Technology & Services Market Attractiveness Analysis, by Services, 2020-2030
Figure 25: Global Bioremediation Technology & Services Market Value Share, by Region, 2019 and 2030
Figure 26: Global Bioremediation Technology & Services Market Attractiveness, by Region, 2019–2027
Figure 27: North America Bioremediation Technology & Services Market Value (US$ Mn) Forecast and Y-o-Y Growth Projection (%), 2018–2030
Figure 28: North America Bioremediation Technology & Services Market Value Share, by Country, 2019 and 2030
Figure 29: North America Bioremediation Technology & Services Market Attractiveness, by Country, 2020–2030
Figure 30: North America Bioremediation Technology & Services Market Value Share, by Type, 2019 and 2030
Figure 31: North America Bioremediation Technology & Services Market Attractiveness, by Type, 2020–2030
Figure 32: North America Bioremediation Technology & Services Market Value Share, by Technology, 2019 and 2030
Figure 33: North America Bioremediation Technology & Services Market Attractiveness, by Technology, 2020–2030
Figure 34: North America Bioremediation Technology & Services Market Value Share, by Services, 2019 and 2030
Figure 35: North America Bioremediation Technology & Services Market Attractiveness, by Services, 2020–2030
Figure 36: Europe Bioremediation Technology & Services Market Value (US$ Mn) Forecast and Y-o-Y Growth Projection (%), 2018–2030
Figure 37: Europe Bioremediation Technology & Services Market Value Share Analysis, by Country/Sub-region, 2018 and 2027
Figure 38: Europe Bioremediation Technology & Services Market Attractiveness Analysis, by Country/Sub-region, 2020–2030
Figure 39: Europe Bioremediation Technology & Services Market Value Share Analysis, by Type, 2019 and 2030
Figure 40: Europe Bioremediation Technology & Services Market Attractiveness Analysis, by Type, 2020–2030
Figure 41: Europe Bioremediation Technology & Services Market Value Share, by Technology, 2019 and 2030
Figure 42: Europe Bioremediation Technology & Services Market Attractiveness, by Technology, 2020–2030
Figure 43: Europe Bioremediation Technology & Services Market Value Share Analysis, by Services, 2019 and 2030
Figure 44: Europe Bioremediation Technology & Services Market Attractiveness Analysis, by Services, 2020–2030
Figure 45: Asia Pacific Bioremediation Technology & Services Market Value (US$ Mn) Forecast and Y-o-Y Growth Projection (%), 2018–2030
Figure 46: Asia Pacific Bioremediation Technology & Services Market Value Share Analysis, by Country/Sub-region, 2019 and 2030
Figure 47: Asia Pacific Bioremediation Technology & Services Market Attractiveness Analysis, by Country/Sub-region
Figure 48: Asia Pacific Bioremediation Technology & Services Market Value Share Analysis, by Type, 2019 and 2030
Figure 49: Asia Pacific Bioremediation Technology & Services Market Attractiveness Analysis, by Type, 2020–2030
Figure 50: Asia Pacific Bioremediation Technology & Services Market Value Share Analysis, by Technology, 2019 and 2030
Figure 51: Asia Pacific Bioremediation Technology & Services Market Attractiveness Analysis, by Technology, 2020–2030
Figure 52: Asia Pacific Bioremediation Technology & Services Market Value Share Analysis, by Services, 2019 and 2030
Figure 53: Asia Pacific Bioremediation Technology & Services Market Attractiveness Analysis, by Services, 2020–2030
Figure 54: Latin America Bioremediation Technology & Services Market Value (US$ Mn) Forecast and Y-o-Y Growth Projection (%), 2018–2030
Figure 55: Latin America Bioremediation Technology & Services Market Value Share, by Country/Sub-region, 2019 and 2030
Figure 56: Latin America Bioremediation Technology & Services Market Attractiveness, by Country/sub-region, 2020–2030
Figure 57: Latin America Bioremediation Technology & Services Market Value Share, by Type, 2019 and 2030
Figure 58: Latin America Bioremediation Technology & Services Market Attractiveness, by Type, 2020–2030
Figure 59: Latin America Bioremediation Technology & Services Market Value Share, by Technology, 2019 and 2030
Figure 60: Latin America Bioremediation Technology & Services Market Attractiveness, by Technology, 2020–2030
Figure 61: Latin America Bioremediation Technology & Services Market Value Share, by Services, 2019 and 2030
Figure 62: Latin America Bioremediation Technology & Services Market Attractiveness, by Services, 2020–2030
Figure 63: Middle East & Africa Bioremediation Technology & Services Market Value (US$ Mn) Forecast and Y-o-Y Growth Projection (%), 2018–2030
Figure 64: Middle East & Africa Bioremediation Technology & Services Market Value Share, by Country/Sub-region, 2019 and 2030
Figure 65: Middle East & Africa Bioremediation Technology & Services Market Attractiveness, by Country/Sub-region, 2020–2030
Figure 66: Middle East & Africa Bioremediation Technology & Services Market Value Share, by Type, 2019 and 2030
Figure 67: Middle East & Africa Bioremediation Technology & Services Market Attractiveness, by Type, 2020–2030
Figure 68: Middle East & Africa Bioremediation Technology & Services Market Value Share, by Technology, 2019 and 2030
Figure 69: Middle East & Africa Bioremediation Technology & Services Market Attractiveness, by Technology, 2020–2030
Figure 70: Middle East & Africa Bioremediation Technology & Services Market Value Share, by Services, 2019 and 2030
Figure 71: Middle East & Africa Bioremediation Technology & Services Market Attractiveness, by Services, 2020–2030
Figure 72: Xylem Inc., Revenue (US$ Mn) and Y-o-Y Growth (%), 2017–2019
Figure 73: Xylem Inc., R&D Expenses (US$ Mn) and Y-o-Y Growth (%), 2017–2019
Figure 74: Xylem Inc., Breakdown of Net Sales, by Region, 2019
Figure 75: Xylem Inc., Breakdown of Net Sales, by Business Segment, 2019
Copyright © Transparency Market Research, Inc. All Rights reserved
Trust Online

Bioremediation Technology & Services Market