
Reports
Reports
The quest for stiff and lightweight packaging material has been, and will continue to lift the innovation bars of manufacturers, as exponentially growing e-Commerce channels depend upon reliable packaging and speedy transportation. With the convergence of antioxidants and plastic, this new formulation is found to have high thermal stability and resistance against oxidation, which has further led to the infiltration of plastic antioxidants in numerous industries - aerospace, automotive, packaging, construction, and electronics.
As industrialists seek materials with longer-shelf life for their products, plastic antioxidants are likely to grow in importance and value during the forecast period. Sensing the enormous business opportunities underlying in the plastic antioxidants market, Transparency Market Research (TMR), in its recent study, studies the undercurrents exerting their influence on market growth.
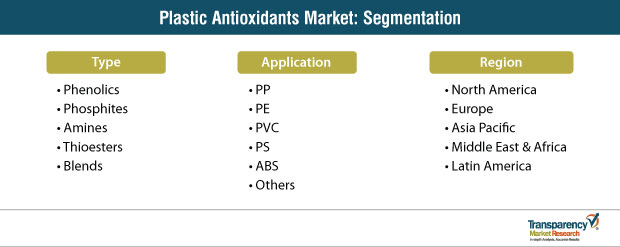
Plastic, as a material, is susceptible to temperature variations, which necessitated the addition of chemicals - phenolics, amines, blends, phosphites, and thioesters - to prevent it from turning hard at low temperatures and soft at high temperatures. Products manufactured using plastic antioxidants are shielded from the effects of time, which offers them longer shelf life. In 2018, plastic antioxidants recorded a volume sales of ~ 274 thousand tons, corresponding to a value of US$ 807 million, and this is likely to grow in terms of adoption at a CAGR of ~ 6% during 2019-2027.
In recent times, the plastic antioxidants market has been growing in parallel with the automotive industry, given the demand for lightweight plastic for enhancing the fuel efficiency of vehicles. The trend of adding antioxidants during the manufacturing of automotive components has been on a surge; this is intended to delay their degradation. As manufacturers intensify their investments in improving the properties of plastic antioxidants, new application areas are likely to surface, which will upkeep the steadily growing demand in the coming years.
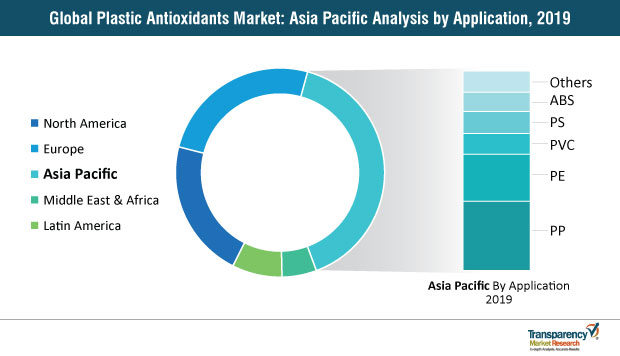
Stabilized polypropylene (PP) used for protecting products against thermo-oxidative degradation is likely to remain preferred for the development of packaging products. However, surging investments in the construction sector have been generating high demand for PVC for the development of pipes, sliders, and electric cables, and given the ascending demand for residential areas from the increasing populace, their adoption is likely to remain high during the forecast period.
Asia Pacific, on account of high growth in the construction sector, holds high revenue potential in the plastic antioxidants market. China’s dominance in the consumer goods sector will further reflect on the overall market size of Asia Pacific. In addition, growing investments in automotive, electronics, and consumer goods sectors will aid Asia Pacific in retaining its leading status in the market.
With rising concerns apropos of the severe health hazards - birth defects, infertility, delay in neurodevelopment, and hormone disruptions, among others - posed by plastic antioxidants in tandem with the ill-effects on the environment, end users seek materials other than plastic, such as bio-based antioxidants developed using plants, a factor that is likely to deter the steady growth of the market.
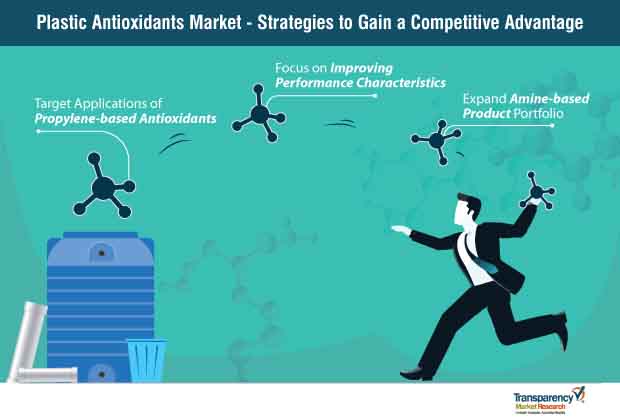
Plastic Antioxidants Market - Strategies to Gain Competitive Advantage
As propylene offers low density and high melting temperatures, it has been spectating a surge in demand for the development of restorable plastic products. In addition, packaging bags manufactured from these materials delay evaporation and dehydration, which aids in retaining the freshness and taste of food and beverages. Manufacturers can capitalize on this property to penetrate deeper into end-use industries by developing application-specific propylene-based antioxidants.
Since polymers tend to change with time when exposed to radiation, corrosive environment, and excessive heat, these changes exert influence on their service life and properties. With the introduction of plastic antioxidants, manufacturers are able to offer products with extended shelf life. As they seek a distinguished position in the market, focus on developing plastic antioxidants that resist the effects of temperature, pressure, and environmental dynamics can aid them in reaching the desired heights.
With the focus of the automotive industry on reducing the overall weight of components and vehicles, the demand for amine has been growing at a striking rate. Besides keeping check on the weight, amine polymers ensure excellent protection against temperature. Since electric vehicles and self-driving cars are a part of the immediate future of the automotive industry, manufacturers can shift their strategy gears towards broadening their amine-based product portfolios to leverage the underlying opportunity.
The plastic antioxidants market is a landscape, wherein, the existing potential of a single market player lacks the required momentum to move the entire industry at a significant pace. Collectively, frontrunners account for ~ 32% of the plastic antioxidants market share with robust distribution and sales channel across the globe, which gives them an upper hand over their regional competitors. These players include:
These leaders strive to target multiple end-use applications by expanding their manufacturing competency. For instance, BASF SE boasts of its expertise in the production of chemicals and their distribution in over 90 countries across the globe. BASF SE realized the potential of the Asia Pacific market, and in January 2019, it announced the launch of a new antioxidant production facility in Shanghai, China.
Regional players, in contrast, focus on extending the properties of plastic antioxidants and expand in terms of capability by entering into partnerships with players located in key geographies. For instance, Raschig GmbH offers high-performance antioxidants to safeguard products from the harsh effects of mechanical strain, heat, and light. High working capital coupled with the interrupted supply of raw materials in the moderately fragmented plastic antioxidants market is likely to narrow down the entry passage for new players.
Analysts’ Inference of the Plastic Antioxidants Market
Authors of the report anticipate a favorable growth scenario for the plastic antioxidants market over the course of the forecast period of 2019-2027. According to their analysis, the popularity of plastic antioxidants is likely to grow with constant improvements in their characteristics, which have been offering new growth tangents in numerous industries. The automotive industry is likely to remain a key contributor to the revenue share of the plastic antioxidants market, owing to the epochal scale of transformation happening in the landscape, which has necessitated the use of lightweight material for the manufacturing of automotive components. Manufacturers who focus on research and development activities are likely to gain an upper hand in the development of differentiated products.
Plastic Antioxidants Market Description
What are Key Growth Drivers of the Plastic Antioxidants Market?
What are the Key Growth Challenges for the Plastic Antioxidants Market?
Lucrative Opportunities in the Global Plastic Antioxidants Market
Asia Pacific a Prominent Plastic Antioxidants Market
Europe Offers Growth Opportunities
Leading Players in Plastic Antioxidants Market
Key players operating in the global plastic antioxidants market are
1. Preface
1.1. Report Scope & Market Segmentation
1.2. Research Highlights
2. Assumptions and Research Methodology
3. Executive Summary: Global Plastic Antioxidants Market, 2018–2027
4. Market Overview
4.1. Introduction
4.1.1. Product Overview
4.1.2. Key Market Developments
4.1.3. Key Market Indicators
4.2. Market Dynamics
4.2.1. Drivers
4.2.2. Restraints
4.2.3. Opportunities
4.3. Porter's Five Forces Analysis
4.4. Regulatory Landscape
4.5. Value Chain Analysis
5. Plastic Antioxidants Price Trend Analysis, 2018, by Region
6. Global Plastic Antioxidants Market Analysis and Forecast, by Type, 2018–2027
6.1. Key Trends
6.2. Definitions & Introduction
6.3. Global Plastic Antioxidants Market Volume (Tons) and Value (US$ Thousand) Analysis, by Type, 2018–2027
6.3.1. Phenolics
6.3.2. Phosphites
6.3.3. Amines
6.3.4. Thioesters
6.3.5. Blends
7. Global Plastic Antioxidants Market Analysis and Forecast, by Application, 2018–2027
7.1. Key Trends
7.2. Definitions & Introduction
7.3. Global Plastic Antioxidants Market Volume (Tons) and Value (US$ Thousand) Analysis, by Application, 2018–2027
7.3.1. PP
7.3.2. PE
7.3.3. PVC
7.3.4. PS
7.3.5. ABS
7.3.6. Others (including PU, Polyol, PET, Acrylic, Acrylonitrile Butadiene, Styrene, Fiberglass, and Nylon)
8. Global Plastic Antioxidants Market Analysis and Forecast, by Region, 2018–2027
8.1. Key Trends
8.2. Definitions & Introduction
8.3. Global Plastic Antioxidants Market Volume (Tons) and Value (US$ Thousand) Analysis, by Region, 2018–2027
8.3.1. North America
8.3.2. Europe
8.3.3. Asia Pacific
8.3.4. Middle East & Africa
8.3.5. Latin America
8.4. Global Plastic Antioxidants Market Attractiveness Analysis, by Type, Application, and Region
9. North America Plastic Antioxidants Market Analysis and Forecast, 2018–2027
9.1. Key Findings
9.2. North America Plastic Antioxidants Market Volume (Tons) and Value (US$ Thousand) Analysis, by Type, 2018–2027
9.2.1. Phenolics
9.2.2. Phosphites
9.2.3. Amines
9.2.4. Thioesters
9.2.5. Blends
9.3. North America Plastic Antioxidants Market Volume (Tons) and Value (US$ Thousand) Analysis, by Resin, 2018–2027
9.3.1. PP
9.3.2. PE
9.3.3. PVC
9.3.4. PS
9.3.5. ABS
9.3.6. Others (including PU, Polyol, PET, Acrylic, Acrylonitrile Butadiene, Styrene, Fiberglass, and Nylon)
9.4. U.S. Plastic Antioxidants Market Volume (Tons) and Value (US$ Thousand) Analysis, by Type, 2018–2027
9.4.1. Phenolics
9.4.2. Phosphites
9.4.3. Amines
9.4.4. Thioesters
9.4.5. Blends
9.5. U.S. Plastic Antioxidants Market Volume (Tons) and Value (US$ Thousand) Analysis, by Application, 2018–2027
9.5.1. PP
9.5.2. PE
9.5.3. PVC
9.5.4. PS
9.5.5. ABS
9.5.6. Others (including PU, Polyol, PET, Acrylic, Acrylonitrile Butadiene, Styrene, Fiberglass, and Nylon)
9.6. Canada Plastic Antioxidants Market Volume (Tons) and Value (US$ Thousand) Analysis, by Type, 2018–2027
9.6.1. Phenolics
9.6.2. Phosphites
9.6.3. Amines
9.6.4. Thioesters
9.6.5. Blends
9.7. Canada Plastic Antioxidants Market Volume (Tons) and Value (US$ Thousand) Analysis, by Application, 2018–2027
9.7.1. PP
9.7.2. PE
9.7.3. PVC
9.7.4. PS
9.7.5. ABS
9.7.6. Others (including PU, Polyol, PET, Acrylic, Acrylonitrile Butadiene, Styrene, Fiberglass, and Nylon)
9.8. North America Plastic Antioxidants Market Attractiveness Analysis, by Type and Application, 2018–2027
10. Europe Plastic Antioxidants Market Analysis and Forecast, 2018–2027
10.1. Key Findings
10.2. Europe Plastic Antioxidants Market Volume (Tons) and Value (US$ Thousand) Analysis, by Type, 2018–2027
10.2.1. Phenolics
10.2.2. Phosphites
10.2.3. Amines
10.2.4. Thioesters
10.2.5. Blends
10.3. Europe Plastic Antioxidants Market Volume (Tons) and Value (US$ Thousand) Analysis, by Application, 2018–2027
10.3.1. PP
10.3.2. PE
10.3.3. PVC
10.3.4. PS
10.3.5. ABS
10.3.6. Others (including PU, Polyol, PET, Acrylic, Acrylonitrile Butadiene, Styrene, Fiberglass, and Nylon)
10.4. Germany Plastic Antioxidants Market Volume (Tons) and Value (US$ Thousand) Analysis, by Type, 2018–2027
10.4.1. Phenolics
10.4.2. Phosphites
10.4.3. Amines
10.4.4. Thioesters
10.4.5. Blends
10.5. Germany Plastic Antioxidants Market Volume (Tons) and Value (US$ Thousand) Analysis, by Application, 2018–2027
10.5.1. PP
10.5.2. PE
10.5.3. PVC
10.5.4. PS
10.5.5. ABS
10.5.6. Others (including PU, Polyol, PET, Acrylic, Acrylonitrile Butadiene, Styrene, Fiberglass, and Nylon)
10.6. France Plastic Antioxidants Market Volume (Tons) and Value (US$ Thousand) Analysis, by Type, 2018–2027
10.6.1. Phenolics
10.6.2. Phosphites
10.6.3. Amines
10.6.4. Thioesters
10.6.5. Blends
10.7. France Plastic Antioxidants Market Volume (Tons) and Value (US$ Thousand) Analysis, by Application, 2018–2027
10.7.1. PP
10.7.2. PE
10.7.3. PVC
10.7.4. PS
10.7.5. ABS
10.7.6. Others (including PU, Polyol, PET, Acrylic, Acrylonitrile Butadiene, Styrene, Fiberglass, and Nylon)
10.8. U.K. Plastic Antioxidants Market Volume (Tons) and Value (US$ Thousand) Analysis, by Type, 2018–2027
10.8.1. Phenolics
10.8.2. Phosphites
10.8.3. Amines
10.8.4. Thioesters
10.8.5. Blends
10.9. U.K. Plastic Antioxidants Market Volume (Tons) and Value (US$ Thousand) Analysis, by Application, 2018–2027
10.9.1. PP
10.9.2. PE
10.9.3. PVC
10.9.4. PS
10.9.5. ABS
10.9.6. Others (including PU, Polyol, PET, Acrylic, Acrylonitrile Butadiene, Styrene, Fiberglass, and Nylon)
10.10. Spain Plastic Antioxidants Market Volume (Tons) and Value (US$ Thousand) Analysis, by Type, 2018–2027
10.10.1. Phenolics
10.10.2. Phosphites
10.10.3. Amines
10.10.4. Thioesters
10.10.5. Blends
10.11. Spain Plastic Antioxidants Market Volume (Tons) and Value (US$ Thousand) Analysis, by Application, 2018–2027
10.11.1. PP
10.11.2. PE
10.11.3. PVC
10.11.4. PS
10.11.5. ABS
10.11.6. Others (including PU, Polyol, PET, Acrylic, Acrylonitrile Butadiene, Styrene, Fiberglass, and Nylon)
10.12. Italy Plastic Antioxidants Market Volume (Tons) and Value (US$ Thousand) Analysis, by Type, 2018–2027
10.12.1. Phenolics
10.12.2. Phosphites
10.12.3. Amines
10.12.4. Thioesters
10.12.5. Blends
10.13. Italy Plastic Antioxidants Market Volume (Tons) and Value (US$ Thousand) Analysis, by Application, 2018–2027
10.13.1. PP
10.13.2. PE
10.13.3. PVC
10.13.4. PS
10.13.5. ABS
10.13.6. Others (including PU, Polyol, PET, Acrylic, Acrylonitrile Butadiene, Styrene, Fiberglass, and Nylon)
10.14. Russia & CIS Plastic Antioxidants Market Volume (Tons) and Value (US$ Thousand) Analysis, by Type, 2018–2027
10.14.1. Phenolics
10.14.2. Phosphites
10.14.3. Amines
10.14.4. Thioesters
10.14.5. Blends
10.15. Russia & CIS Plastic Antioxidants Market Volume (Tons) and Value (US$ Thousand) Analysis, by Application, 2018–2027
10.15.1. PP
10.15.2. PE
10.15.3. PVC
10.15.4. PS
10.15.5. ABS
10.15.6. Others (including PU, Polyol, PET, Acrylic, Acrylonitrile Butadiene, Styrene, Fiberglass, and Nylon)
10.16. Rest of Europe Plastic Antioxidants Market Volume (Tons) and Value (US$ Thousand) Analysis, by Type, 2018–2027
10.16.1. Phenolics
10.16.2. Phosphites
10.16.3. Amines
10.16.4. Thioesters
10.16.5. Blends
10.17. Rest of Europe Plastic Antioxidants Market Volume (Tons) and Value (US$ Thousand) Analysis, by Application, 2018–2027
10.17.1. PP
10.17.2. PE
10.17.3. PVC
10.17.4. PS
10.17.5. ABS
10.17.6. Others (including PU, Polyol, PET, Acrylic, Acrylonitrile Butadiene, Styrene, Fiberglass, and Nylon)
10.18. Europe Plastic Antioxidants Market Attractiveness Analysis, by Type and Application, 2018–2027
11. Asia Pacific Plastic Antioxidants Market Analysis & Forecast, 2018 – 2027
11.1. Key Findings
11.2. Asia Pacific Plastic Antioxidants Market Volume (Tons) and Value (US$ Thousand) Analysis, by Type, 2018–2027
11.2.1. Phenolics
11.2.2. Phosphites
11.2.3. Amines
11.2.4. Thioesters
11.2.5. Blends
11.3. Asia Pacific Plastic Antioxidants Market Volume (Tons) and Value (US$ Thousand) Analysis, by Application, 2018–2027
11.3.1. PP
11.3.2. PE
11.3.3. PVC
11.3.4. PS
11.3.5. ABS
11.3.6. Others (including PU, Polyol, PET, Acrylic, Acrylonitrile Butadiene, Styrene, Fiberglass, and Nylon)
11.4. China Plastic Antioxidants Market Volume (Tons) and Value (US$ Thousand) Analysis, by Type, 2018–2027
11.4.1. Phenolics
11.4.2. Phosphites
11.4.3. Amines
11.4.4. Thioesters
11.4.5. Blends
11.5. China Plastic Antioxidants Market Volume (Tons) and Value (US$ Thousand) Analysis, by Application, 2018–2027
11.5.1. PP
11.5.2. PE
11.5.3. PVC
11.5.4. PS
11.5.5. ABS
11.5.6. Others (including PU, Polyol, PET, Acrylic, Acrylonitrile Butadiene, Styrene, Fiberglass, and Nylon)
11.6. India Plastic Antioxidants Market Volume (Tons) and Value (US$ Thousand) Analysis, by Type, 2018–2027
11.6.1. Phenolics
11.6.2. Phosphites
11.6.3. Amines
11.6.4. Thioesters
11.6.5. Blends
11.7. India Plastic Antioxidants Market Volume (Tons) and Value (US$ Thousand) Analysis, by Application, 2018–2027
11.7.1. PP
11.7.2. PE
11.7.3. PVC
11.7.4. PS
11.7.5. ABS
11.7.6. Others (including PU, Polyol, PET, Acrylic, Acrylonitrile Butadiene, Styrene, Fiberglass, and Nylon)
11.8. Japan Plastic Antioxidants Market Volume (Tons) and Value (US$ Thousand) Analysis, by Type, 2018–2027
11.8.1. Phenolics
11.8.2. Phosphites
11.8.3. Amines
11.8.4. Thioesters
11.8.5. Blends
11.9. Japan Plastic Antioxidants Market Volume (Tons) and Value (US$ Thousand) Analysis, by Application, 2018–2027
11.9.1. PP
11.9.2. PE
11.9.3. PVC
11.9.4. PS
11.9.5. ABS
11.9.6. Others (including PU, Polyol, PET, Acrylic, Acrylonitrile Butadiene, Styrene, Fiberglass, and Nylon)
11.10. ASEAN Plastic Antioxidants Market Volume (Tons) and Value (US$ Thousand) Analysis, by Type, 2018–2027
11.10.1. Phenolics
11.10.2. Phosphites
11.10.3. Amines
11.10.4. Thioesters
11.10.5. Blends
11.11. ASEAN Plastic Antioxidants Market Volume (Tons) and Value (US$ Thousand) Analysis, by Application, 2018–2027
11.11.1. PP
11.11.2. PE
11.11.3. PVC
11.11.4. PS
11.11.5. ABS
11.11.6. Others (including PU, Polyol, PET, Acrylic, Acrylonitrile Butadiene, Styrene, Fiberglass, and Nylon)
11.12. Rest of Asia Pacific Plastic Antioxidants Market Volume (Tons) and Value (US$ Thousand) Analysis, by Type, 2018–2027
11.12.1. Phenolics
11.12.2. Phosphites
11.12.3. Amines
11.12.4. Thioesters
11.12.5. Blends
11.13. Rest of Asia Pacific Plastic Antioxidants Market Volume (Tons) and Value (US$ Thousand) Analysis, by Application, 2018–2027
11.13.1. PP
11.13.2. PE
11.13.3. PVC
11.13.4. PS
11.13.5. ABS
11.13.6. Others (including PU, Polyol, PET, Acrylic, Acrylonitrile Butadiene, Styrene, Fiberglass, and Nylon)
11.14. Asia Pacific Plastic Antioxidants Market Attractiveness Analysis, by Type and Application, 2018–2027
12. Middle East & Africa Plastic Antioxidants Market Analysis and Forecast, 2018–2027
12.1. Key Findings
12.2. Middle East & Africa Plastic Antioxidants Market Volume (Tons) and Value (US$ Thousand) Analysis, by Type, 2018–2027
12.2.1. Phenolics
12.2.2. Phosphites
12.2.3. Amines
12.2.4. Thioesters
12.2.5. Blends
12.3. Middle East & Africa Plastic Antioxidants Market Volume (Tons) and Value (US$ Thousand) Analysis, by Application, 2018–2027
12.3.1. PP
12.3.2. PE
12.3.3. PVC
12.3.4. PS
12.3.5. ABS
12.3.6. Others (including PU, Polyol, PET, Acrylic, Acrylonitrile Butadiene, Styrene, Fiberglass, and Nylon)
12.4. GCC Plastic Antioxidants Market Volume (Tons) and Value (US$ Thousand) Analysis, by Type, 2018–2027
12.4.1. Phenolics
12.4.2. Phosphites
12.4.3. Amines
12.4.4. Thioesters
12.4.5. Blends
12.5. GCC Plastic Antioxidants Market Volume (Tons) and Value (US$ Thousand) Analysis, by Application, 2018–2027
12.5.1. PP
12.5.2. PE
12.5.3. PVC
12.5.4. PS
12.5.5. ABS
12.5.6. Others (including PU, Polyol, PET, Acrylic, Acrylonitrile Butadiene, Styrene, Fiberglass, and Nylon)
12.5.7.
12.6. South Africa Plastic Antioxidants Market Volume (Tons) and Value (US$ Thousand) Analysis, by Type, 2018–2027
12.6.1. Phenolics
12.6.2. Phosphites
12.6.3. Amines
12.6.4. Thioesters
12.6.5. Blends
12.7. South Africa Plastic Antioxidants Market Volume (Tons) and Value (US$ Thousand) Analysis, by Application, 2018–2027
12.7.1. PP
12.7.2. PE
12.7.3. PVC
12.7.4. PS
12.7.5. ABS
12.7.6. Others (including PU, Polyol, PET, Acrylic, Acrylonitrile Butadiene, Styrene, Fiberglass, and Nylon)
12.8. Rest of Middle East & Africa Plastic Antioxidants Market Volume (Tons) and Value (US$ Thousand) Analysis, by Type, 2018–2027
12.8.1. Phenolics
12.8.2. Phosphites
12.8.3. Amines
12.8.4. Thioesters
12.8.5. Blends
12.9. Rest of Middle East & Africa Plastic Antioxidants Market Volume (Tons) and Value (US$ Thousand) Analysis, by Application, 2018–2027
12.9.1. PP
12.9.2. PE
12.9.3. PVC
12.9.4. PS
12.9.5. ABS
12.9.6. Others (including PU, Polyol, PET, Acrylic, Acrylonitrile Butadiene, Styrene, Fiberglass, and Nylon)
12.10. Middle East & Africa Plastic Antioxidants Market Attractiveness Analysis, by Type and Application, 2018–2027
13. Latin America Plastic Antioxidants Market Analysis & Forecast, 2018–2027
13.1. Key Findings
13.2. Latin America Plastic Antioxidants Market Volume (Tons) and Value (US$ Thousand) Analysis, by Type, 2018–2027
13.2.1. Phenolics
13.2.2. Phosphites
13.2.3. Amines
13.2.4. Thioesters
13.2.5. Blends
13.3. Latin America Plastic Antioxidants Market Volume (Tons) and Value (US$ Thousand) Analysis, by Application, 2018–2027
13.3.1. PP
13.3.2. PE
13.3.3. PVC
13.3.4. PS
13.3.5. ABS
13.3.6. Others (including PU, Polyol, PET, Acrylic, Acrylonitrile Butadiene, Styrene, Fiberglass, and Nylon)
13.4. Brazil Plastic Antioxidants Market Volume (Tons) and Value (US$ Thousand) Analysis, by Type, 2018–2027
13.4.1. Phenolics
13.4.2. Phosphites
13.4.3. Amines
13.4.4. Thioesters
13.4.5. Blends
13.5. Brazil Plastic Antioxidants Market Volume (Tons) and Value (US$ Thousand) Analysis, by Application, 2018–2027
13.5.1. PP
13.5.2. PE
13.5.3. PVC
13.5.4. PS
13.5.5. ABS
13.5.6. Others (including PU, Polyol, PET, Acrylic, Acrylonitrile Butadiene, Styrene, Fiberglass, and Nylon)
13.6. Mexico Plastic Antioxidants Market Volume (Tons) and Value (US$ Thousand) Analysis, by Type, 2018–2027
13.6.1. Phenolics
13.6.2. Phosphites
13.6.3. Amines
13.6.4. Thioesters
13.6.5. Blends
13.7. Mexico Plastic Antioxidants Market Volume (Tons) and Value (US$ Thousand) Analysis, by Application, 2018–2027
13.7.1. PP
13.7.2. PE
13.7.3. PVC
13.7.4. PS
13.7.5. ABS
13.7.6. Others (including PU, Polyol, PET, Acrylic, Acrylonitrile Butadiene, Styrene, Fiberglass, and Nylon)
13.8. Rest of Latin America Plastic Antioxidants Market Volume (Tons) and Value (US$ Thousand) Analysis, by Type, 2018–2027
13.8.1. Phenolics
13.8.2. Phosphites
13.8.3. Amines
13.8.4. Thioesters
13.8.5. Blends
13.9. Rest of Latin America Plastic Antioxidants Market Volume (Tons) and Value (US$ Thousand) Analysis, by Application, 2018–2027
13.9.1. PP
13.9.2. PE
13.9.3. PVC
13.9.4. PS
13.9.5. ABS
13.9.6. Others (including PU, Polyol, PET, Acrylic, Acrylonitrile Butadiene, Styrene, Fiberglass, and Nylon)
13.10. Latin America Plastic Antioxidants Market Attractiveness Analysis, by Type and Application, 2018–2027
14. Competition Landscape
14.1. Plastic Antioxidants Market Share Analysis, by Company (2018)
14.2. Competition Matrix
14.3. Company Profile
14.3.1. BASF SE
14.3.1.1. Headquarters, Year of Establishment, Revenue, Key Management, Number of Employees
14.3.1.2. Business Segments
14.3.1.3. Product Segments
14.3.1.4. Business Overview
14.3.1.5. Financial Overview
14.3.1.6. Key Developments
14.3.2. Solvay SA
14.3.2.1. Headquarters, Year of Establishment, Revenue, Key Management, Number of Employees
14.3.2.2. Business Segments
14.3.2.3. Product Segments
14.3.2.4. Business Overview
14.3.2.5. Financial Overview
14.3.2.6. Strategic Overview
14.3.3. Dover Chemical Corporation
14.3.3.1. Headquarters, Year of Establishment, Revenue, Key Management, Number of Employees
14.3.3.2. Business Segments
14.3.3.3. Brands
14.3.4. SI Group, Inc.
14.3.4.1. Headquarters, Year of Establishment, Revenue, Key Management, Number of Employees
14.3.4.2. Product Segments
14.3.4.3. Product Sub-segments
14.3.4.4. Product Line
14.3.5. SONGWON Industrial Group
14.3.5.1. Headquarters, Year of Establishment, Revenue, Key Management, Number of Employees
14.3.5.2. Business Segments
14.3.5.3. Product Segments
14.3.5.4. Business Overview
14.3.5.5. Financial Overview
14.3.5.6. Strategic Overview
14.3.5.7. Key Developments
14.3.6. ADEKA Corporation
14.3.6.1. Headquarters, Year of Establishment, Revenue, Key Management, Number of Employees
14.3.6.2. Business Segments
14.3.6.3. Product Segments
14.3.6.4. Product Line
14.3.6.5. Business Overview
14.3.6.6. Financial Overview
14.3.7. 3V Sigma USA Inc.
14.3.7.1. Headquarters, Year of Establishment, Revenue, Key Management, Number of Employees
14.3.7.2. Product Segments
14.3.7.3. Product Line
14.3.8. Everspring Chemical Co., Ltd.
14.3.8.1. Headquarters, Year of Establishment, Revenue, Key Management, Number of Employees
14.3.8.2. Product Segments
14.3.8.3. Product Line
14.3.9. OMNOVA Solutions Inc.
14.3.9.1. Headquarters, Year of Establishment, Revenue, Key Management, Number of Employees
14.3.9.2. Business Segments
14.3.9.3. Product Segments
14.3.9.4. Product Line
14.3.9.5. Business Overview
14.3.9.6. Financial Overview
14.3.9.7. Strategic Overview
14.3.10. Kawaguchi Chemical industry Co., Ltd.
14.3.10.1. Headquarters, Year of Establishment, Revenue, Key Management, Number of Employees
14.3.10.2. Product Segments
14.3.10.3. Product Line
14.3.10.4. Products
14.3.11. Raschig GmbH
14.3.11.1. Headquarters, Year of Establishment, Revenue, Key Management, Number of Employees
14.3.11.2. Product Segments
14.3.11.3. Product Line
14.3.11.4. Applications
15. Primary Insights
List of Tables
Table 01: Average Price Comparison of Plastic Antioxidants (US$/Ton), by Region, 2018
Table 02: Global Plastic Antioxidants Market Volume (Tons) Forecast, by Type, 2018–2027
Table 03: Global Plastic Antioxidants Market Value (US$ Thousand) Forecast, by Type, 2018–2027
Table 04: Global Plastic Antioxidants Market Volume (Tons) Forecast, by Application, 2018–2027
Table 05: Global Plastic Antioxidants Market Value (US$ Thousand) Forecast, by Application, 2018–2027
Table 06: Global Plastic Antioxidants Market Volume (Tons) Forecast, by Region, 2018–2027
Table 07: Global Plastic Antioxidants Market Value (US$ Thousand) Forecast, by Region, 2018–2027
Table 08: North America Plastic Antioxidants Market Volume (Tons) Forecast, by Type, 2018–2027
Table 09: North America Plastic Antioxidants Market Value (US$ Thousand) Forecast, by Type, 2018–2027
Table 10: North America Plastic Antioxidants Market Volume (Tons) Forecast, by Application, 2018–2027
Table 11: North America Plastic Antioxidants Market Value (US$ Thousand) Forecast, by Application, 2018–2027
Table 12: North America Plastic Antioxidants Market Volume (Tons) Forecast, by Country, 2018–2027
Table 13: North America Plastic Antioxidants Market Value (US$ Thousand) Forecast, by Country, 2018–2027
Table 14: U.S. Plastic Antioxidants Market Volume (Tons) Forecast, by Type, 2018–2027
Table 15: U.S. Plastic Antioxidants Market Value (US$ Thousand) Forecast, by Type, 2018–2027
Table 16: U.S. Plastic Antioxidants Market Volume (Tons) Forecast, by Application, 2018–2027
Table 17: U.S. Plastic Antioxidants Market Value (US$ Thousand) Forecast, by Application, 2018–2027
Table 18: Canada Plastic Antioxidants Market Volume (Tons) Forecast, by Type, 2018–2027
Table 19: Canada Plastic Antioxidants Market Value (US$ Thousand) Forecast, by Type, 2018–2027
Table 20: Canada Plastic Antioxidants Market Volume (Tons) Forecast, by Application, 2018–2027
Table 21: Canada Plastic Antioxidants Market Value (US$ Thousand) Forecast, by Application, 2018–2027
Table 22: Europe Plastic Antioxidants Market Volume (Tons) Forecast, by Type, 2018–2027
Table 23: Europe Plastic Antioxidants Market Value (US$ Thousand) Forecast, by Type, 2018–2027
Table 24: Europe Plastic Antioxidants Market Volume (Tons) Forecast, by Application, 2018–2027
Table 25: Europe Plastic Antioxidants Market Value (US$ Thousand) Forecast, by Application, 2018–2027
Table 26: Europe Plastic Antioxidants Market Volume (Tons) Forecast, by Country and Sub-region, 2018–2027
Table 27: Europe Plastic Antioxidants Market Value (US$ Thousand) Forecast, by Country and Sub-region, 2018–2027
Table 28: Germany Plastic Antioxidants Market Volume (Tons) Forecast, by Type, 2018–2027
Table 29: Germany Plastic Antioxidants Market Value (US$ Thousand) Forecast, by Type, 2018–2027
Table 30: Germany Plastic Antioxidants Market Volume (Tons) Forecast, by Application, 2018–2027
Table 31: Germany Plastic Antioxidants Market Value (US$ Thousand) Forecast, by Application, 2018–2027
Table 32: U.K. Plastic Antioxidants Market Volume (Tons) Forecast, by Type, 2018–2027
Table 33: U.K. Plastic Antioxidants Market Value (US$ Thousand) Forecast, by Type, 2018–2027
Table 34: U.K. Plastic Antioxidants Market Volume (Tons) Forecast, by Application, 2018–2027
Table 35: U.K. Plastic Antioxidants Market Value (US$ Thousand) Forecast, by Application, 2018–2027
Table 36: France Plastic Antioxidants Market Volume (Tons) Forecast, by Type, 2018–2027
Table 37: France Plastic Antioxidants Market Value (US$ Thousand) Forecast, by Type, 2018–2027
Table 38: France Plastic Antioxidants Market Volume (Tons) Forecast, by Application, 2018–2027
Table 39: France Plastic Antioxidants Market Value (US$ Thousand) Forecast, by Application, 2018–2027
Table 40: Italy Plastic Antioxidants Market Volume (Tons) Forecast, by Type, 2018–2027
Table 41: Italy Plastic Antioxidants Market Value (US$ Thousand) Forecast, by Type, 2018–2027
Table 42: Italy Plastic Antioxidants Market Volume (Tons) Forecast, by Application, 2018–2027
Table 43: Italy Plastic Antioxidants Market Value (US$ Thousand) Forecast, by Application, 2018–2027
Table 44: Spain Plastic Antioxidants Market Volume (Tons) Forecast, by Type, 2018–2027
Table 45: Spain Plastic Antioxidants Market Value (US$ Thousand) Forecast, by Type, 2018–2027
Table 46: Spain Plastic Antioxidants Market Volume (Tons) Forecast, by Application, 2018–2027
Table 47: Spain Plastic Antioxidants Market Value (US$ Thousand) Forecast, by Application, 2018–2027
Table 48: Russia & CIS Plastic Antioxidants Market Volume (Tons) Forecast, by Type, 2018–2027
Table 49: Russia & CIS Plastic Antioxidants Market Value (US$ Thousand) Forecast, by Type, 2018–2027
Table 50: Russia & CIS Plastic Antioxidants Market Volume (Tons) Forecast, by Application, 2018–2027
Table 51: Russia & CIS Plastic Antioxidants Market Value (US$ Thousand) Forecast, by Application, 2018–2027
Table 52: Rest of Europe Plastic Antioxidants Market Volume (Tons) Forecast, by Type, 2018–2027
Table 53: Rest of Europe Plastic Antioxidants Market Value (US$ Thousand) Forecast, by Type, 2018–2027
Table 54: Rest of Europe Plastic Antioxidants Market Volume (Tons) Forecast, by Application, 2018–2027
Table 55: Rest of Europe Plastic Antioxidants Market Value (US$ Thousand) Forecast, by Application, 2018–2027
Table 56: Asia Pacific Plastic Antioxidants Market Volume (Tons) Forecast, by Type, 2018–2027
Table 57: Asia Pacific Plastic Antioxidants Market Value (US$ Thousand) Forecast, by Type, 2018–2027
Table 58: Asia Pacific Plastic Antioxidants Market Volume (Tons) Forecast, by Application, 2018–2027
Table 59: Asia Pacific Plastic Antioxidants Market Value (US$ Thousand) Forecast, by Application, 2018–2027
Table 60: Asia Pacific Plastic Antioxidants Market Volume (Tons) Forecast, by Country and Sub-region, 2018–2027
Table 61: Asia Pacific Plastic Antioxidants Market Value (US$ Thousand) Forecast, by Country and Sub-region, 2018–2027
Table 62: China Plastic Antioxidants Market Volume (Tons) Forecast, by Type, 2018–2027
Table 63: China Plastic Antioxidants Market Value (US$ Thousand) Forecast, by Type, 2018–2027
Table 64: China Plastic Antioxidants Market Volume (Tons) Forecast, by Application, 2018–2027
Table 65: China Plastic Antioxidants Market Value (US$ Thousand) Forecast, by Application, 2018–2027
Table 66: India Plastic Antioxidants Market Volume (Tons) Forecast, by Type, 2018–2027
Table 67: India Plastic Antioxidants Market Value (US$ Thousand) Forecast, by Type, 2018–2027
Table 68: India Plastic Antioxidants Market Volume (Tons) Forecast, by Application, 2018–2027
Table 69: India Plastic Antioxidants Market Value (US$ Thousand) Forecast, by Application, 2018–2027
Table 70: Japan Plastic Antioxidants Market Volume (Tons) Forecast, by Type, 2018–2027
Table 71: Japan Plastic Antioxidants Market Value (US$ Thousand) Forecast, by Type, 2018–2027
Table 72: Japan Plastic Antioxidants Market Volume (Tons) Forecast, by Application, 2018–2027
Table 73: Japan Plastic Antioxidants Market Value (US$ Thousand) Forecast, by Application, 2018–2027
Table 74: ASEAN Plastic Antioxidants Market Volume (Tons) Forecast, by Type, 2018–2027
Table 75: ASEAN Plastic Antioxidants Market Value (US$ Thousand) Forecast, by Type, 2018–2027
Table 76: ASEAN Plastic Antioxidants Market Volume (Tons) Forecast, by Application, 2018–2027
Table 77: ASEAN Plastic Antioxidants Market Value (US$ Thousand) Forecast, by Application, 2018–2027
Table 78: Rest of Asia Pacific Plastic Antioxidants Market Volume (Tons) Forecast, by Type, 2018–2027
Table 79: Rest of Asia Pacific Plastic Antioxidants Market Value (US$ Thousand) Forecast, by Type, 2018–2027
Table 80: Rest of Asia Pacific Plastic Antioxidants Market Volume (Tons) Forecast, by Application, 2018–2027
Table 81: Rest of Asia Pacific Plastic Antioxidants Market Value (US$ Thousand) Forecast, by Application, 2018–2027
Table 82: Middle East & Africa Plastic Antioxidants Market Volume (Tons) Forecast, by Type, 2018–2027
Table 83: Middle East & Africa Plastic Antioxidants Market Value (US$ Thousand) Forecast, by Type, 2018–2027
Table 84: Middle East & Africa Plastic Antioxidants Market Volume (Tons) Forecast, by Application, 2018–2027
Table 85: Middle East & Africa Plastic Antioxidants Market Value (US$ Thousand) Forecast, by Application, 2018–2027
Table 86: Middle East & Africa Plastic Antioxidants Market Volume (Tons) Forecast, by Country and Sub-region, 2018–2027
Table 87: Middle East & Africa Plastic Antioxidants Market Value (US$ Thousand) Forecast, by Country and Sub-region, 2018–2027
Table 88: GCC Plastic Antioxidants Market Volume (Tons) Forecast, by Type, 2018–2027
Table 89: GCC Plastic Antioxidants Market Value (US$ Thousand) Forecast, by Type, 2018–2027
Table 90: GCC Plastic Antioxidants Market Volume (Tons) Forecast, by Application, 2018–2027
Table 91: GCC Plastic Antioxidants Market Value (US$ Thousand) Forecast, by Application, 2018–2027
Table 92: South Africa Plastic Antioxidants Market Volume (Tons) Forecast, by Type, 2018–2027
Table 93: South Africa Plastic Antioxidants Market Value (US$ Thousand) Forecast, by Type, 2018–2027
Table 94: South Africa Plastic Antioxidants Market Volume (Tons) Forecast, by Application, 2018–2027
Table 95: South Africa Plastic Antioxidants Market Value (US$ Thousand) Forecast, by Application, 2018–2027
Table 96: Rest of Middle East & Africa Plastic Antioxidants Market Volume (Tons) Forecast, by Type, 2018–2027
Table 97: Rest of Middle East & Africa Plastic Antioxidants Market Value (US$ Thousand) Forecast, by Type, 2018–2027
Table 98: Rest of Middle East & Africa Plastic Antioxidants Market Volume (Tons) Forecast, by Application, 2018–2027
Table 99: Rest of Middle East & Africa Plastic Antioxidants Market Value (US$ Thousand) Forecast, by Application, 2018–2027
Table 100: Latin America Plastic Antioxidants Market Volume (Tons) Forecast, by Type, 2018–2027
Table 101: Latin America Plastic Antioxidants Market Value (US$ Thousand) Forecast, by Type, 2018–2027
Table 102: Latin America Plastic Antioxidants Market Volume (Tons) Forecast, by Application, 2018–2027
Table 103: Latin America Plastic Antioxidants Market Value (US$ Thousand) Forecast, by Application, 2018–2027
Table 104: Latin America Plastic Antioxidants Market Volume (Tons) Forecast, by Country and Sub-region, 2018-2027
Table 105: Latin America Plastic Antioxidants Market Value (US$ Thousand) Forecast, by Country and Sub-region, 2018-2027
Table 106: Brazil Plastic Antioxidants Market Volume (Tons) Forecast, by Type, 2018–2027
Table 107: Brazil Plastic Antioxidants Market Value (US$ Thousand) Forecast, by Type, 2018–2027
Table 108: Brazil Plastic Antioxidants Market Volume (Tons) Forecast, by Application, 2018–2027
Table 109: Brazil Plastic Antioxidants Market Value (US$ Thousand) Forecast, by Application, 2018–2027
Table 110: Mexico Plastic Antioxidants Market Volume (Tons) Forecast, by Application, 2018–2027
Table 111: Mexico Plastic Antioxidants Market Value (US$ Thousand) Forecast, by Type, 2018–2027
Table 112: Mexico Plastic Antioxidants Market Volume (Tons) Forecast, by Application, 2018–2027
Table 113: Mexico Plastic Antioxidants Market Value (US$ Thousand) Forecast, by Application, 2018–2027
Table 114: Rest of Latin America Plastic Antioxidants Market Volume (Tons) Forecast, by Type, 2018–2027
Table 115: Rest of Latin America Plastic Antioxidants Market Value (US$ Thousand) Forecast, by Type, 2018–2027
Table 116: Rest of Latin America Plastic Antioxidants Market Volume (Tons) Forecast, by Application, 2018–2027
Table 117: Rest of Latin America Plastic Antioxidants Market Value (US$ Thousand) Forecast, by Application, 2018–2027
List of Figures
Figure 01: Global Plastic Antioxidants Market
Figure 02: Global Plastic Antioxidants Market Share Analysis, by Type, 2018
Figure 03: Global Plastic Antioxidants Market Share Analysis, by Application, 2018
Figure 04: Average Price Comparison of Plastic Antioxidants (US$/Ton), by Type, 2018
Figure 05: Global Plastic Antioxidants Market Volume, by Type, 2018 and 2027
Figure 06: Global Plastic Antioxidants Market Volume (Tons) and Value (US$ Thousand), by Phenolics, 2018–2027
Figure 07: Global Plastic Antioxidants Market Volume (Tons) and Value (US$ Thousand), by Phosphites, 2018–2027
Figure 08: Global Plastic Antioxidants Market Volume (Tons) and Value (US$ Thousand), by Amines, 2018–2027
Figure 09: Global Plastic Antioxidants Market Volume (Tons) and Value (US$ Thousand), by Thioesters, 2018–2027
Figure 10: Global Plastic Antioxidants Market Volume (Tons) and Value (US$ Thousand), by Blends, 2018–2027
Figure 11: Global Plastic Antioxidants Market Attractiveness, by Type
Figure 12: Global Plastic Antioxidants Market Volume, by Application, 2018 and 2027
Figure 13: Global Plastic Antioxidants Market Volume (Tons) and Value (US$ Thousand), by PP, 2018–2027
Figure 14: Global Plastic Antioxidants Market Volume (Tons) and Value (US$ Thousand), by PE, 2018–2027
Figure 15: Global Plastic Antioxidants Market Volume (Tons) and Value (US$ Thousand), by PVC, 2018–2027
Figure 16: Global Plastic Antioxidants Market Volume (Tons) and Value (US$ Thousand), by PS, 2018–2027
Figure 17: Global Plastic Antioxidants Market Volume (Tons) and Value (US$ Thousand), by ABS, 2018–2027
Figure 18: Global Plastic Antioxidants Market Volume (Tons) and Value (US$ Thousand), by Others, 2018–2027
Figure 19: Global Plastic Antioxidants Market Attractiveness, by Application
Figure 20: Global Plastic Antioxidants Market Volume, by Region, 2018 and 2027
Figure 21: Global Plastic Antioxidants Market Attractiveness, by Region
Figure 22: North America Plastic Antioxidants Market Volume (Tons) and Value (US$ Thousand) Forecast, 2018–2027
Figure 23: North America Plastic Antioxidants Market Attractiveness, by Country and Sub-region
Figure 24: North America Plastic Antioxidants Market Volume, by Type, 2018 and 2027
Figure 25: North America Plastic Antioxidants Market Volume, by Application, 2018 and 2027
Figure 26: North America Plastic Antioxidants Market Volume, by Country, 2018 and 2027
Figure 27: North America Plastic Antioxidants Market Attractiveness, by Type
Figure 28: North America Plastic Antioxidants Market Attractiveness, by Application
Figure 29: Europe Plastic Antioxidants Market Volume (Tons) and Value (US$ Thousand) Forecast, 2018–2027
Figure 30: Europe Plastic Antioxidants Market Attractiveness, by Country and Sub-region
Figure 31: Europe Plastic Antioxidants Market Volume, by Type, 2018 and 2027
Figure 32: Europe Plastic Antioxidants Market Volume Share, by Application, 2018 and 2027
Figure 33: Europe Plastic Antioxidants Market Volume Share, by Country and Sub-region, 2018 and 2027
Figure 34: Europe Plastic Antioxidants Market Attractiveness, by Type
Figure 35: Europe Plastic Antioxidants Market Attractiveness, by Application
Figure 36: Asia Pacific Plastic Antioxidants Market Volume (Tons) and Value (US$ Thousand) Forecast, 2018–2027
Figure 37: Asia Pacific Plastic Antioxidants Market Attractiveness, by Country and Sub-region, 2018–2027
Figure 38: Asia Pacific Plastic Antioxidants Market Volume, by Type, 2018 and 2027
Figure 39: Asia Pacific Plastic Antioxidants Market Volume, by Application, 2018 and 2027
Figure 40: Asia Pacific Plastic Antioxidants Market Volume, by Country and Sub-region, 2018 and 2027
Figure 41: Asia Pacific Plastic Antioxidants Market Attractiveness, by Type
Figure 42: Asia Pacific Plastic Antioxidants Market Attractiveness, by Application
Figure 43: Middle East & Africa Plastic Antioxidants Market Volume (Tons) and Value (US$ Thousand) Forecast, 2018–2027
Figure 44: Middle East & Africa Plastic Antioxidants Market Attractiveness, by Country and Sub-region, 2019–2027
Figure 45: Middle East & Africa Plastic Antioxidants Market Volume, by Type, 2018 and 2027
Figure 46: Middle East & Africa Plastic Antioxidants Market Volume, by Application, 2018 and 2027
Figure 47: Middle East & Africa Plastic Antioxidants Market Volume, by Country and Sub-region, 2018 and 2027
Figure 48: Middle East & Africa Plastic Antioxidants Market Attractiveness, by Type
Figure 49: Middle East & Africa Plastic Antioxidants Market Attractiveness, by Application
Figure 50: Latin America Plastic Antioxidants Volume (Tons) and Market Value (US$ Thousand) Forecast, 2018-2027
Figure 51: Latin America Plastic Antioxidants Market Attractiveness, by Country and Sub-region, 2018
Figure 52: Latin America Plastic Antioxidants Market Volume, by Type, 2018 and 2027
Figure 53: Latin America Plastic Antioxidants Market Volume, by Application, 2018 and 2027
Figure 54: Latin America Plastic Antioxidants Market Volume, by Country and Sub-region, 2018 and 2027
Figure 55: Latin America Plastic Antioxidants Market Attractiveness, by Type
Figure 56: Latin America Plastic Antioxidants Market Attractiveness, by Application
Figure 57: Plastic Antioxidants Market Share Analysis, by Company, 2018
Copyright © Transparency Market Research, Inc. All Rights reserved
Trust Online

Plastic Antioxidants Market