
Reports
Reports
Analysts’ Viewpoint on PET Foam Core Market Scenario
Rise in adoption of PET foam core in various end-use industries such as construction, transportation, and aviation is driving the global market. PET foam core is flame retardant and offers resistance to high temperatures. It also provides good mechanical properties, chemical resistance, excellent sound insulation performance, and low water absorption. Growth in the wind energy sector is expected to augment the global PET foam core market during the forecast period. Market players are expanding their manufacturing capacities and distribution channels to broaden their revenue streams. They are also using recycled plastic bottles as raw materials to manufacture PET foam in order to reduce their carbon footprint.
PET foam is a kind of closed-cell thermoplastic structural foam. Polyethylene terephthalate, commonly known as polyester resin, is the primary component of PET foam core material. Majority of synthesis of PU foams is based on the petrochemicals industry. The PET foam material has a convenient processing method. The thermoforming process is used to form a complex body structure. PET foam core offers excellent thermal stability under high temperatures. High-density PET foam core material has certain shear and compression strength. It is widely used in construction, road & rail transportation, aviation, wind power, and other industries. Flexible polyurethane foam is employed in the manufacture of various consumer and commercial products.
Wind energy is one of the key end-users of PET foam core. The foam is used in sandwich construction of rotor blades, nacelles, and spinners. The average height of turbines has increased significantly over the past few years. Since 2012, the average height of wind turbines installed in the U.S. has been about 280 feet or 80 meters. A few wind turbines were as tall as 280 feet prior to 2006.
According to a Global Wind Energy Council 2021 report, 2020 was the best year in history for the global wind industry, with 93 GW of new capacity installed, a 53% year-on-year increase. China and the U.S. recorded nearly 75% of new installations in 2020 and accounted for over half of the world’s total wind power capacity. Thus, increase in height of wind turbines and rise in capacity of wind energy are anticipated to boost the market value of PET foam core during the forecast period.
According to the PET foam core market overview, rise in implementation of stringent environmental regulations across the globe is prompting companies in the power generation sector to opt for cleaner and environment-friendly energy resources. Major economies around the world are focused on the development of renewable energy to reduce their dependence on conventional resources. PET foam core is more environment-friendly than PVC foam core. Conventional PET foams are produced using fluoride as a blowing agent, which negatively impacts the environment and human health. Recently introduced PET foaming technologies use carbon dioxide generated in the production process as a blowing agent, which is beneficial to environmental protection.
Waste treatment of PVC primarily includes burning and burying, which lead to land and air pollution. However, low-density PET foam can be 100% recycled. PET plastics have a relatively high recycling rate of about 20% (compared to 2.0% for PVC plastics). Thus, choosing a new type of PET core material is a more environment-friendly choice.
In terms of density, the global PET foam core market has been classified into up to 70 kg/m3, >70-195 kg/m3, and above 195 kg/m3. According to the PET foam core market analysis, the >70-195 kg/m3 segment accounted for prominent share of the global market in 2021. The segment is anticipated to grow at a CAGR of 7.3% during the forecast period. Low-density PET foam core possesses a density range of 70 kg/m3 to 195 kg/m3. It offers desirable mechanical properties such as resistance to fatigue, chemical stability, and UV resistance. Primary applications of low-density foams include wind power generation, rail transportation, yacht, aerospace, and energy-efficient buildings.
According to the recent insights on the PET foam core market, Europe dominated the global market in terms of value in 2021. The region is estimated to maintain its dominance during the forecast period. Expansion of the PET foam core market in the region can be ascribed to surge in adoption of high-density PET foam core in various end-use industries.
Market share for pet foam core in North America stood at 24.4% in 2021. Growth in the automotive industry is driving the market in the region. Asia Pacific held 16.9% share of the global market in 2021. The market in the region is projected to grow at a moderate pace during the forecast period. Latin America and Middle East & Africa constituted 5.4% and 1.3% share of the market, respectively, in 2021. The market in these regions is expected to grow at a moderate pace during the forecast period.
The global PET foam core market is highly consolidated, with a small number of large-scale vendors controlling majority of the share. Most of the companies are investing significantly in comprehensive R&D activities, primarily to create environment-friendly products. Expansion of product portfolios and mergers & acquisitions are key strategies adopted by prominent players. Armacell, 3A Composites GmbH, CoreLite, Feininger (Nanjing) Energy Saving Technology Co., Ltd., DIAB International AB, Sicomin Epoxy Systems, Gurit, CEL COMPONENTS S.R.L., SAERTEX GmbH & Co. KG, and Carlier Plastiques are key entities operating in the market.
Each of these players has been profiled in the PET foam core market report based on parameters such as company overview, financial overview, business strategies, product portfolio, business segments, and recent developments.
|
Attribute |
Detail |
|
Market Size Value in 2021 |
US$ 84.2 Mn |
|
Market Forecast Value in 2031 |
US$ 165.7 Mn |
|
Growth Rate (CAGR) |
7.2% |
|
Forecast Period |
2022–2031 |
|
Historical Data Available for |
2020 |
|
Quantitative Units |
US$ Mn for Value and Thousand Square Meters for Volume |
|
Market Analysis |
It includes cross-segment analysis at the global as well as regional level. Furthermore, the qualitative analysis includes drivers, restraints, opportunities, key trends, Porter’s Five Forces analysis, value chain analysis, and key trend analysis. |
|
Competition Landscape |
|
|
Format |
Electronic (PDF) + Excel |
|
Market Segmentation |
|
|
Regions Covered |
|
|
Countries Covered |
|
|
Companies Profiled |
|
|
Customization Scope |
Available upon request |
|
Pricing |
Available upon request |
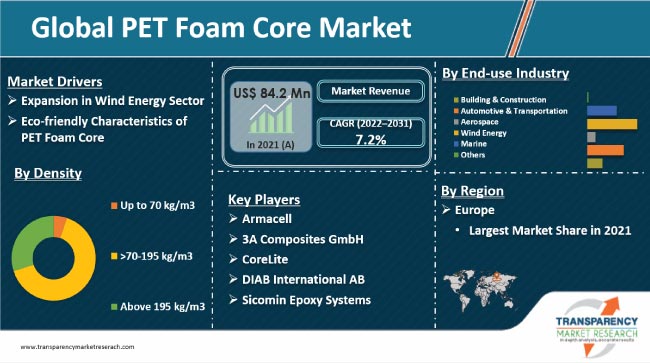
The PET foam core market stood at US$ 84.2 Mn in 2021.
The PET foam core market is expected to grow at a CAGR of 7.2% from 2022 to 2031.
Expansion in wind energy sector and eco-friendly characteristics of PET foam core.
>70-195 kg/m3 was the largest segment that held 65.0% value share of the market in 2021.
Europe was the most lucrative region with 52.0% share of the global PET foam core market in 2021.
Armacell, 3A Composites GmbH, CoreLite, Feininger (Nanjing) Energy Saving Technology Co., Ltd., DIAB International AB, Sicomin Epoxy Systems, Gurit, CEL COMPONENTS S.R.L., SAERTEX GmbH & Co. KG, and Carlier Plastiques.
1. Executive Summary
1.1. PET Foam Core Market Snapshot
1.2. Current Market and Future Potential
2. Market Overview
2.1. Market Segmentation
2.2. Market Trends
2.3. Market Dynamics
2.3.1. Drivers
2.3.2. Restraints
2.3.3. Opportunities
2.4. Porter’s Five Forces Analysis
2.5. Regulatory Analysis
2.6. Value Chain Analysis
2.6.1. List of Raw Material Providers
2.6.2. List of PET Foam Core Manufacturers
2.6.3. List of Dealers/Distributors
2.6.4. List of Potential Customer
3. COVID-19 Impact Analysis
4. PET Foam Core Market Analysis and Forecast, by Density, 2022–2031
4.1. Introduction and Definitions
4.2. Global PET Foam Core Market Volume (Thousand Square Meters) and Value (US$ Mn) Forecast, by Density, 2022–2031
4.2.1. Up to 70 kg/m3
4.2.2. >70-195 kg/m3
4.2.3. Above 195 kg/m3
4.3. Global PET Foam Core Market Attractiveness, by Density
5. Global PET Foam Core Market Analysis and Forecast, End-use Industry, 2022–2031
5.1. Introduction and Definitions
5.2. Global PET Foam Core Market Volume (Thousand Square Meters) and Value (US$ Mn) Forecast, by End-use Industry, 2022–2031
5.2.1. Building & Construction
5.2.2. Automotive & Transportation
5.2.3. Aerospace
5.2.4. Wind Energy
5.2.5. Marine
5.2.6. Others
5.3. Global PET Foam Core Market Attractiveness, by End-use Industry
6. Global PET Foam Core Market Analysis and Forecast, by Region, 2022–2031
6.1. Key Findings
6.2. Global PET Foam Core Market Volume (Thousand Square Meters) and Value (US$ Mn) Forecast, by Region, 2022–2031
6.2.1. North America
6.2.2. Europe
6.2.3. Asia Pacific
6.2.4. Latin America
6.2.5. Middle East & Africa
6.3. Global PET Foam Core Market Attractiveness, by Region
7. North America PET Foam Core Market Analysis and Forecast, 2022–2031
7.1. Key Findings
7.2. North America PET Foam Core Market Volume (Thousand Square Meters) and Value (US$ Mn) Forecast, by Density, 2022–2031
7.3. North America PET Foam Core Market Volume (Thousand Square Meters) and Value (US$ Mn) Forecast, by End-use Industry, 2022–2031
7.4. North America PET Foam Core Market Volume (Thousand Square Meters) and Value (US$ Mn) Forecast, by Country, 2022–2031
7.4.1. U.S. PET Foam Core Market Volume (Thousand Square Meters) and Value (US$ Mn) Forecast, by Density, 2022–2031
7.4.2. U.S. PET Foam Core Market Volume (Thousand Square Meters) and Value (US$ Mn) Forecast, End-use Industry, 2022–2031
7.4.3. Canada PET Foam Core Market Volume (Thousand Square Meters) and Value (US$ Mn) Forecast, by Density, 2022–2031
7.4.4. Canada PET Foam Core Market Volume (Thousand Square Meters) and Value (US$ Mn) Forecast, End-use Industry, 2022–2031
7.5. North America PET Foam Core Market Attractiveness Analysis
8. Europe PET Foam Core Market Analysis and Forecast, 2022–2031
8.1. Key Findings
8.2. Europe PET Foam Core Market Volume (Thousand Square Meters) and Value (US$ Mn) Forecast, by Density, 2022–2031
8.3. Europe PET Foam Core Market Volume (Thousand Square Meters) and Value (US$ Mn) Forecast, by End-use Industry, 2022–2031
8.4. Europe PET Foam Core Market Volume (Thousand Square Meters) and Value (US$ Mn) Forecast, by Country and Sub-region, 2021-2031
8.4.1. Germany PET Foam Core Market Volume (Thousand Square Meters) and Value (US$ Mn) Forecast, by Density, 2022–2031
8.4.2. Germany. PET Foam Core Market Volume (Thousand Square Meters) and Value (US$ Mn) Forecast, End-use Industry, 2022–2031
8.4.3. France PET Foam Core Market Volume (Thousand Square Meters) and Value (US$ Mn) Forecast, by Density, 2022–2031
8.4.4. France. PET Foam Core Market Volume (Thousand Square Meters) and Value (US$ Mn) Forecast, End-use Industry, 2022–2031
8.4.5. U.K. PET Foam Core Market Volume (Thousand Square Meters) and Value (US$ Mn) Forecast, by Density, 2022–2031
8.4.6. U.K. PET Foam Core Market Volume (Thousand Square Meters) and Value (US$ Mn) Forecast, End-use Industry, 2022–2031
8.4.7. Italy PET Foam Core Market Volume (Thousand Square Meters) and Value (US$ Mn) Forecast, by Density, 2022–2031
8.4.8. Italy PET Foam Core Market Volume (Thousand Square Meters) and Value (US$ Mn) Forecast, End-use Industry, 2022–2031
8.4.9. Russia & CIS PET Foam Core Market Volume (Thousand Square Meters) and Value (US$ Mn) Forecast, by Density, 2022–2031
8.4.10. Russia & CIS PET Foam Core Market Volume (Thousand Square Meters) and Value (US$ Mn) Forecast, End-use Industry, 2022–2031
8.4.11. Rest of Europe PET Foam Core Market Volume (Thousand Square Meters) and Value (US$ Mn) Forecast, by Density, 2022–2031
8.4.12. Rest of Europe PET Foam Core Market Volume (Thousand Square Meters) and Value (US$ Mn) Forecast, End-use Industry, 2022–2031
8.5. Europe PET Foam Core Market Attractiveness Analysis
9. Asia Pacific PET Foam Core Market Analysis and Forecast, 2022–2031
9.1. Key Findings
9.2. Asia Pacific PET Foam Core Market Volume (Thousand Square Meters) and Value (US$ Mn) Forecast, by Density
9.3. Asia Pacific PET Foam Core Market Volume (Thousand Square Meters) and Value (US$ Mn) Forecast, by End-use Industry, 2022–2031
9.4. Asia Pacific PET Foam Core Market Volume (Thousand Square Meters) and Value (US$ Mn) Forecast, by Country and Sub-region, 2021-2031
9.4.1. China PET Foam Core Market Volume (Thousand Square Meters) and Value (US$ Mn) Forecast, by Density, 2022–2031
9.4.2. China PET Foam Core Market Volume (Thousand Square Meters) and Value (US$ Mn) Forecast, End-use Industry, 2022–2031
9.4.3. Japan PET Foam Core Market Volume (Thousand Square Meters) and Value (US$ Mn) Forecast, by Density, 2022–2031
9.4.4. Japan PET Foam Core Market Volume (Thousand Square Meters) and Value (US$ Mn) Forecast, End-use Industry, 2022–2031
9.4.5. India PET Foam Core Market Volume (Thousand Square Meters) and Value (US$ Mn) Forecast, by Density, 2022–2031
9.4.6. India PET Foam Core Market Volume (Thousand Square Meters) and Value (US$ Mn) Forecast, End-use Industry, 2022–2031
9.4.7. ASEAN PET Foam Core Market Volume (Thousand Square Meters) and Value (US$ Mn) Forecast, by Density, 2022–2031
9.4.8. ASEAN PET Foam Core Market Volume (Thousand Square Meters) and Value (US$ Mn) Forecast, End-use Industry, 2022–2031
9.4.9. Rest of Asia Pacific PET Foam Core Market Volume (Thousand Square Meters) and Value (US$ Mn) Forecast, by Density, 2022–2031
9.4.10. Rest of Asia Pacific PET Foam Core Market Volume (Thousand Square Meters) and Value (US$ Mn) Forecast, End-use Industry, 2022–2031
9.5. Asia Pacific PET Foam Core Market Attractiveness Analysis
10. Latin America PET Foam Core Market Analysis and Forecast, 2022–2031
10.1. Key Findings
10.2. Latin America PET Foam Core Market Volume (Thousand Square Meters) and Value (US$ Mn) Forecast, by Density, 2022–2031
10.3. Latin America PET Foam Core Market Volume (Thousand Square Meters) and Value (US$ Mn) Forecast, by End-use Industry, 2022–2031
10.4. Latin America PET Foam Core Market Volume (Thousand Square Meters) and Value (US$ Mn) Forecast, by Country and Sub-region, 2021-2031
10.4.1. Brazil PET Foam Core Market Volume (Thousand Square Meters) and Value (US$ Mn) Forecast, by Density, 2022–2031
10.4.2. Brazil PET Foam Core Market Volume (Thousand Square Meters) and Value (US$ Mn) Forecast, End-use Industry, 2022–2031
10.4.3. Mexico PET Foam Core Market Volume (Thousand Square Meters) and Value (US$ Mn) Forecast, by Density, 2022–2031
10.4.4. Mexico PET Foam Core Market Volume (Thousand Square Meters) and Value (US$ Mn) Forecast, End-use Industry, 2022–2031
10.4.5. Rest of Latin America PET Foam Core Market Volume (Thousand Square Meters) and Value (US$ Mn) Forecast, by Density, 2022–2031
10.4.6. Rest of Latin America PET Foam Core Market Volume (Thousand Square Meters) and Value (US$ Mn) Forecast, End-use Industry, 2022–2031
10.5. Latin America PET Foam Core Market Attractiveness Analysis
11. Middle East & Africa PET Foam Core Market Analysis and Forecast, 2022–2031
11.1. Key Findings
11.2. Middle East & Africa PET Foam Core Market Volume (Thousand Square Meters) and Value (US$ Mn) Forecast, by Density, 2022–2031
11.3. Middle East & Africa PET Foam Core Market Volume (Thousand Square Meters) and Value (US$ Mn) Forecast, by End-use Industry, 2022–2031
11.4. Middle East & Africa PET Foam Core Market Volume (Thousand Square Meters) and Value (US$ Mn) Forecast, by Country and Sub-region, 2021-2031
11.4.1. GCC PET Foam Core Market Volume (Thousand Square Meters) and Value (US$ Mn) Forecast, by Density, 2022–2031
11.4.2. GCC PET Foam Core Market Volume (Thousand Square Meters) and Value (US$ Mn) Forecast, End-use Industry, 2022–2031
11.4.3. South Africa PET Foam Core Market Volume (Thousand Square Meters) and Value (US$ Mn) Forecast, by Density, 2022–2031
11.4.4. South Africa PET Foam Core Market Volume (Thousand Square Meters) and Value (US$ Mn) Forecast, End-use Industry, 2022–2031
11.4.5. Rest of Middle East & Africa PET Foam Core Market Volume (Thousand Square Meters) and Value (US$ Mn) Forecast, by Density, 2022–2031
11.4.6. Rest of Middle East & Africa PET Foam Core Market Volume (Thousand Square Meters) and Value (US$ Mn) Forecast, End-use Industry, 2022–2031
11.5. Middle East & Africa PET Foam Core Market Attractiveness Analysis
12. Competition Landscape
12.1. Global PET Foam Core Company Market Share Analysis, 2021
12.2. Company Profiles (Details – Overview, Financials, Recent Developments, and Strategy)
12.2.1. Armacell
12.2.1.1. Company Description
12.2.1.2. Business Overview
12.2.1.3. Financial Overview
12.2.1.4. Strategic Overview
12.2.2. 3A Composites GmbH
12.2.2.1. Company Description
12.2.2.2. Business Overview
12.2.2.3. Financial Overview
12.2.2.4. Strategic Overview
12.2.3. CoreLite
12.2.3.1. Company Description
12.2.3.2. Business Overview
12.2.3.3. Financial Overview
12.2.3.4. Strategic Overview
12.2.4. Feininger (Nanjing) Energy Saving Technology Co., Ltd.
12.2.4.1. Company Description
12.2.4.2. Business Overview
12.2.4.3. Financial Overview
12.2.4.4. Strategic Overview
12.2.5. DIAB International AB
12.2.5.1. Company Description
12.2.5.2. Business Overview
12.2.5.3. Financial Overview
12.2.5.4. Strategic Overview
12.2.6. Sicomin Epoxy Systems
12.2.6.1. Company Description
12.2.6.2. Business Overview
12.2.6.3. Financial Overview
12.2.6.4. Strategic Overview
12.2.7. Gurit
12.2.7.1. Company Description
12.2.7.2. Business Overview
12.2.7.3. Financial Overview
12.2.8. CEL COMPONENTS S.R.L.
12.2.8.1. Company Description
12.2.8.2. Business Overview
12.2.8.3. Financial Overview
12.2.9. SAERTEX GmbH & Co.KG
12.2.9.1. Company Description
12.2.9.2. Business Overview
12.2.9.3. Financial Overview
12.2.10. Carlier Plastiques
12.2.10.1. Company Description
12.2.10.2. Business Overview
12.2.10.3. Financial Overview
13. Primary Research: Key Insights
14. Appendix
List of Tables
Table 1: Global PET Foam Core Market Volume (Thousand Square Meters) Forecast, by Density, 2022–2031
Table 2: Global PET Foam Core Market Value (US$ Mn) Forecast, by Density, 2022–2031
Table 3: Global PET Foam Core Market Volume (Thousand Square Meters) Forecast, by End-use Industry, 2022–2031
Table 4: Global PET Foam Core Market Value (US$ Mn) Forecast, by End-use Industry, 2022–2031
Table 5: Global PET Foam Core Market Volume (Thousand Square Meters) Forecast, by Region, 2022–2031
Table 6: Global PET Foam Core Market Value (US$ Mn) Forecast, by Region, 2022–2031
Table 7: North America PET Foam Core Market Volume (Thousand Square Meters) Forecast, by Density, 2022–2031
Table 8: North America PET Foam Core Market Value (US$ Mn) Forecast, by Density, 2022–2031
Table 9: North America PET Foam Core Market Volume (Thousand Square Meters) Forecast, by End-use Industry, 2022–2031
Table 10: North America PET Foam Core Market Value (US$ Mn) Forecast, by End-use Industry, 2022–2031
Table 11: North America PET Foam Core Market Volume (Thousand Square Meters) Forecast, by Country, 2022–2031
Table 12: North America PET Foam Core Market Value (US$ Mn) Forecast, by Country, 2022–2031
Table 13: U.S. PET Foam Core Market Volume (Thousand Square Meters) Forecast, by Density, 2022–2031
Table 14: U.S. PET Foam Core Market Value (US$ Mn) Forecast, by Density, 2022–2031
Table 15: U.S. PET Foam Core Market Volume (Thousand Square Meters) Forecast, by End-use Industry, 2022–2031
Table 16: U.S. PET Foam Core Market Value (US$ Mn) Forecast, by End-use Industry, 2022–2031
Table 17: Canada PET Foam Core Market Volume (Thousand Square Meters) Forecast, by Density, 2022–2031
Table 18: Canada PET Foam Core Market Value (US$ Mn) Forecast, by Density, 2022–2031
Table 19: Canada PET Foam Core Market Volume (Thousand Square Meters) Forecast, by End-use Industry, 2022–2031
Table 20: Canada PET Foam Core Market Value (US$ Mn) Forecast, by End-use Industry 2022–2031
Table 21: Europe PET Foam Core Market Volume (Thousand Square Meters) Forecast, by Density, 2022–2031
Table 22: Europe PET Foam Core Market Value (US$ Mn) Forecast, by Density, 2022–2031
Table 23: Europe PET Foam Core Market Volume (Thousand Square Meters) Forecast, by End-use Industry, 2022–2031
Table 24: Europe PET Foam Core Market Value (US$ Mn) Forecast, by End-use Industry 2022–2031
Table 25: Europe PET Foam Core Market Volume (Thousand Square Meters) Forecast, by Country and Sub-region, 2022–2031
Table 26: Europe PET Foam Core Market Value (US$ Mn) Forecast, by Country and Sub-region, 2022–2031
Table 27: Germany PET Foam Core Market Volume (Thousand Square Meters) Forecast, by Density, 2022–2031
Table 28: Germany PET Foam Core Market Value (US$ Mn) Forecast, by Density, 2022–2031
Table 29: Germany PET Foam Core Market Volume (Thousand Square Meters) Forecast, by End-use Industry, 2022–2031
Table 30: Germany PET Foam Core Market Value (US$ Mn) Forecast, by End-use Industry 2022–2031
Table 31: France PET Foam Core Market Volume (Thousand Square Meters) Forecast, by Density, 2022–2031
Table 32: France PET Foam Core Market Value (US$ Mn) Forecast, by Density, 2022–2031
Table 33: France PET Foam Core Market Volume (Thousand Square Meters) Forecast, by End-use Industry, 2022–2031
Table 34: France PET Foam Core Market Value (US$ Mn) Forecast, by End-use Industry 2022–2031
Table 35: U.K. PET Foam Core Market Volume (Thousand Square Meters) Forecast, by Density, 2022–2031
Table 36: U.K. PET Foam Core Market Value (US$ Mn) Forecast, by Density, 2022–2031
Table 37: U.K. PET Foam Core Market Volume (Thousand Square Meters) Forecast, by End-use Industry, 2022–2031
Table 38: U.K. PET Foam Core Market Value (US$ Mn) Forecast, by End-use Industry 2022–2031
Table 39: Italy PET Foam Core Market Volume (Thousand Square Meters) Forecast, by Density, 2022–2031
Table 40: Italy PET Foam Core Market Value (US$ Mn) Forecast, by Density, 2022–2031
Table 41: Italy PET Foam Core Market Volume (Thousand Square Meters) Forecast, by End-use Industry, 2022–2031
Table 42: Italy PET Foam Core Market Value (US$ Mn) Forecast, by End-use Industry 2022–2031
Table 43: Spain PET Foam Core Market Volume (Thousand Square Meters) Forecast, by Density, 2022–2031
Table 44: Spain PET Foam Core Market Value (US$ Mn) Forecast, by Density, 2022–2031
Table 45: Spain PET Foam Core Market Volume (Thousand Square Meters) Forecast, by End-use Industry, 2022–2031
Table 46: Spain PET Foam Core Market Value (US$ Mn) Forecast, by End-use Industry 2022–2031
Table 47: Russia & CIS PET Foam Core Market Volume (Thousand Square Meters) Forecast, by Density, 2022–2031
Table 48: Russia & CIS PET Foam Core Market Value (US$ Mn) Forecast, by Density, 2022–2031
Table 49: Russia & CIS PET Foam Core Market Volume (Thousand Square Meters) Forecast, by End-use Industry, 2022–2031
Table 50: Russia & CIS PET Foam Core Market Value (US$ Mn) Forecast, by End-use Industry 2022–2031
Table 51: Rest of Europe PET Foam Core Market Volume (Thousand Square Meters) Forecast, by Density, 2022–2031
Table 52: Rest of Europe PET Foam Core Market Value (US$ Mn) Forecast, by Density, 2022–2031
Table 53: Rest of Europe PET Foam Core Market Volume (Thousand Square Meters) Forecast, by End-use Industry, 2022–2031
Table 54: Rest of Europe PET Foam Core Market Value (US$ Mn) Forecast, by End-use Industry 2022–2031
Table 55: Asia Pacific PET Foam Core Market Volume (Thousand Square Meters) Forecast, by Density, 2022–2031
Table 56: Asia Pacific PET Foam Core Market Value (US$ Mn) Forecast, by Density, 2022–2031
Table 57: Asia Pacific PET Foam Core Market Volume (Thousand Square Meters) Forecast, by End-use Industry, 2022–2031
Table 58: Asia Pacific PET Foam Core Market Value (US$ Mn) Forecast, by End-use Industry 2022–2031
Table 59: Asia Pacific PET Foam Core Market Volume (Thousand Square Meters) Forecast, by Country and Sub-region, 2022–2031
Table 60: Asia Pacific PET Foam Core Market Value (US$ Mn) Forecast, by Country and Sub-region, 2022–2031
Table 61: China PET Foam Core Market Volume (Thousand Square Meters) Forecast, by Density, 2022–2031
Table 62: China PET Foam Core Market Value (US$ Mn) Forecast, by Density 2022–2031
Table 63: China PET Foam Core Market Volume (Thousand Square Meters) Forecast, by End-use Industry, 2022–2031
Table 64: China PET Foam Core Market Value (US$ Mn) Forecast, by End-use Industry 2022–2031
Table 65: Japan PET Foam Core Market Volume (Thousand Square Meters) Forecast, by Density, 2022–2031
Table 66: Japan PET Foam Core Market Value (US$ Mn) Forecast, by Density, 2022–2031
Table 67: Japan PET Foam Core Market Volume (Thousand Square Meters) Forecast, by End-use Industry, 2022–2031
Table 68: Japan PET Foam Core Market Value (US$ Mn) Forecast, by End-use Industry 2022–2031
Table 69: India PET Foam Core Market Volume (Thousand Square Meters) Forecast, by Density, 2022–2031
Table 70: India PET Foam Core Market Value (US$ Mn) Forecast, by Density, 2022–2031
Table 71: India PET Foam Core Market Volume (Thousand Square Meters) Forecast, by End-use Industry, 2022–2031
Table 72: India PET Foam Core Market Value (US$ Mn) Forecast, by End-use Industry 2022–2031
Table 73: ASEAN PET Foam Core Market Volume (Thousand Square Meters) Forecast, by Density, 2022–2031
Table 74: ASEAN PET Foam Core Market Value (US$ Mn) Forecast, by Density, 2022–2031
Table 75: ASEAN PET Foam Core Market Volume (Thousand Square Meters) Forecast, by End-use Industry, 2022–2031
Table 76: ASEAN PET Foam Core Market Value (US$ Mn) Forecast, by End-use Industry 2022–2031
Table 77: Rest of Asia Pacific PET Foam Core Market Volume (Thousand Square Meters) Forecast, by Density, 2022–2031
Table 78: Rest of Asia Pacific PET Foam Core Market Value (US$ Mn) Forecast, by Density, 2022–2031
Table 79: Rest of Asia Pacific PET Foam Core Market Volume (Thousand Square Meters) Forecast, by End-use Industry, 2022–2031
Table 80: Rest of Asia Pacific PET Foam Core Market Value (US$ Mn) Forecast, by End-use Industry 2022–2031
Table 81: Latin America PET Foam Core Market Volume (Thousand Square Meters) Forecast, by Density, 2022–2031
Table 82: Latin America PET Foam Core Market Value (US$ Mn) Forecast, by Density, 2022–2031
Table 83: Latin America PET Foam Core Market Volume (Thousand Square Meters) Forecast, by End-use Industry, 2022–2031
Table 84: Latin America PET Foam Core Market Value (US$ Mn) Forecast, by End-use Industry 2022–2031
Table 85: Latin America PET Foam Core Market Volume (Thousand Square Meters) Forecast, by Country and Sub-region, 2022–2031
Table 86: Latin America PET Foam Core Market Value (US$ Mn) Forecast, by Country and Sub-region, 2022–2031
Table 87: Brazil PET Foam Core Market Volume (Thousand Square Meters) Forecast, by Density, 2022–2031
Table 88: Brazil PET Foam Core Market Value (US$ Mn) Forecast, by Density, 2022–2031
Table 89: Brazil PET Foam Core Market Volume (Thousand Square Meters) Forecast, by End-use Industry, 2022–2031
Table 90: Brazil PET Foam Core Market Value (US$ Mn) Forecast, by End-use Industry 2022–2031
Table 91: Mexico PET Foam Core Market Volume (Thousand Square Meters) Forecast, by Density, 2022–2031
Table 92: Mexico PET Foam Core Market Value (US$ Mn) Forecast, by Density, 2022–2031
Table 93: Mexico PET Foam Core Market Volume (Thousand Square Meters) Forecast, by End-use Industry, 2022–2031
Table 94: Mexico PET Foam Core Market Value (US$ Mn) Forecast, by End-use Industry 2022–2031
Table 95: Rest of Latin America PET Foam Core Market Volume (Thousand Square Meters) Forecast, by Density, 2022–2031
Table 96: Rest of Latin America PET Foam Core Market Value (US$ Mn) Forecast, by Density, 2022–2031
Table 97: Rest of Latin America PET Foam Core Market Volume (Thousand Square Meters) Forecast, by End-use Industry, 2022–2031
Table 98: Rest of Latin America PET Foam Core Market Value (US$ Mn) Forecast, by End-use Industry 2022–2031
Table 99: Middle East & Africa PET Foam Core Market Volume (Thousand Square Meters) Forecast, by Density, 2022–2031
Table 100: Middle East & Africa PET Foam Core Market Value (US$ Mn) Forecast, by Density, 2022–2031
Table 101: Middle East & Africa PET Foam Core Market Volume (Thousand Square Meters) Forecast, by End-use Industry, 2022–2031
Table 102: Middle East & Africa PET Foam Core Market Value (US$ Mn) Forecast, by End-use Industry 2022–2031
Table 103: Middle East & Africa PET Foam Core Market Volume (Thousand Square Meters) Forecast, by Country and Sub-region, 2022–2031
Table 104: Middle East & Africa PET Foam Core Market Value (US$ Mn) Forecast, by Country and Sub-region, 2022–2031
Table 105: GCC PET Foam Core Market Volume (Thousand Square Meters) Forecast, by Density, 2022–2031
Table 106: GCC PET Foam Core Market Value (US$ Mn) Forecast, by Density, 2022–2031
Table 107: GCC PET Foam Core Market Volume (Thousand Square Meters) Forecast, by End-use Industry, 2022–2031
Table 108: GCC PET Foam Core Market Value (US$ Mn) Forecast, by End-use Industry 2022–2031
Table 109: South Africa PET Foam Core Market Volume (Thousand Square Meters) Forecast, by Density, 2022–2031
Table 110: South Africa PET Foam Core Market Value (US$ Mn) Forecast, by Density, 2022–2031
Table 111: South Africa PET Foam Core Market Volume (Thousand Square Meters) Forecast, by End-use Industry, 2022–2031
Table 112: South Africa PET Foam Core Market Value (US$ Mn) Forecast, by End-use Industry 2022–2031
Table 113: Rest of Middle East & Africa PET Foam Core Market Volume (Thousand Square Meters) Forecast, by Density, 2022–2031
Table 114: Rest of Middle East & Africa PET Foam Core Market Value (US$ Mn) Forecast, by Density, 2022–2031
Table 115: Rest of Middle East & Africa PET Foam Core Market Volume (Thousand Square Meters) Forecast, by End-use Industry, 2022–2031
Table 116: Rest of Middle East & Africa PET Foam Core Market Value (US$ Mn) Forecast, by End-use Industry 2022–2031
List of Figures
Figure 1: Global PET Foam Core Market Volume Share Analysis, by Density, 2021, 2025, and 2031
Figure 2: Global PET Foam Core Market Attractiveness, by Density
Figure 3: Global PET Foam Core Market Volume Share Analysis, by End-use Industry, 2021, 2025, and 2031
Figure 4: Global PET Foam Core Market Attractiveness, by End-use Industry
Figure 5: Global PET Foam Core Market Volume Share Analysis, by Region, 2021, 2025, and 2031
Figure 6: Global PET Foam Core Market Attractiveness, by Region
Figure 7: North America PET Foam Core Market Volume Share Analysis, by Density, 2021, 2025, and 2031
Figure 8: North America PET Foam Core Market Attractiveness, by Density
Figure 9: North America PET Foam Core Market Attractiveness, by Density
Figure 10: North America PET Foam Core Market Volume Share Analysis, by End-use Industry, 2021, 2025, and 2031
Figure 11: North America PET Foam Core Market Attractiveness, by End-use Industry
Figure 12: North America PET Foam Core Market Attractiveness, by Country and Sub-region
Figure 13: Europe PET Foam Core Market Volume Share Analysis, by Density, 2021, 2025, and 2031
Figure 14: Europe PET Foam Core Market Attractiveness, by Density
Figure 15: Europe PET Foam Core Market Volume Share Analysis, by End-use Industry, 2021, 2025, and 2031
Figure 16: Europe PET Foam Core Market Attractiveness, by End-use Industry
Figure 17: Europe PET Foam Core Market Volume Share Analysis, by Country and Sub-region, 2021, 2025, and 2031
Figure 18: Europe PET Foam Core Market Attractiveness, by Country and Sub-region
Figure 19: Asia Pacific PET Foam Core Market Volume Share Analysis, by Density, 2021, 2025, and 2031
Figure 20: Asia Pacific PET Foam Core Market Attractiveness, by Density
Figure 21: Asia Pacific PET Foam Core Market Volume Share Analysis, by End-use Industry, 2021, 2025, and 2031
Figure 22: Asia Pacific PET Foam Core Market Attractiveness, by End-use Industry
Figure 23: Asia Pacific PET Foam Core Market Volume Share Analysis, by Country and Sub-region, 2021, 2025, and 2031
Figure 24: Asia Pacific PET Foam Core Market Attractiveness, by Country and Sub-region
Figure 25: Latin America PET Foam Core Market Volume Share Analysis, by Density, 2021, 2025, and 2031
Figure 26: Latin America PET Foam Core Market Attractiveness, by Density
Figure 27: Latin America PET Foam Core Market Volume Share Analysis, by End-use Industry, 2021, 2025, and 2031
Figure 28: Latin America PET Foam Core Market Attractiveness, by End-use Industry
Figure 29: Latin America PET Foam Core Market Volume Share Analysis, by Country and Sub-region, 2021, 2025, and 2031
Figure 30: Latin America PET Foam Core Market Attractiveness, by Country and Sub-region
Figure 31: Middle East & Africa PET Foam Core Market Volume Share Analysis, by Density, 2021, 2025, and 2031
Figure 32: Middle East & Africa PET Foam Core Market Attractiveness, by Density
Figure 33: Middle East & Africa PET Foam Core Market Volume Share Analysis, by End-use Industry, 2021, 2025, and 2031
Figure 34: Middle East & Africa PET Foam Core Market Attractiveness, by End-use Industry
Figure 35: Middle East & Africa PET Foam Core Market Volume Share Analysis, by Country and Sub-region, 2021, 2025, and 2031
Figure 36: Middle East & Africa PET Foam Core Market Attractiveness, by Country and Sub-region
Copyright © Transparency Market Research, Inc. All Rights reserved
Trust Online

PET Foam Core Market