
Reports
Reports
Analysts’ Viewpoint on Pancreatin Market Scenario
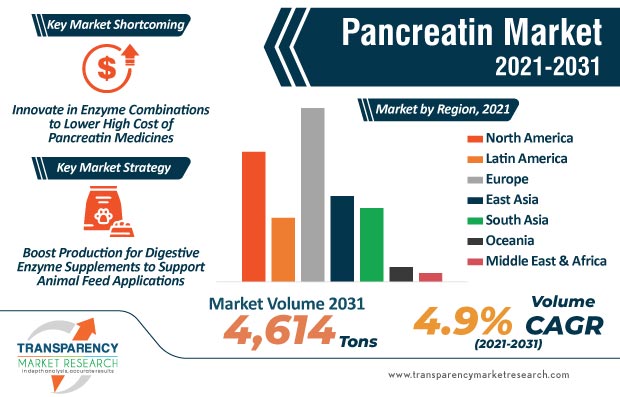
As per the data provided by the Association of Manufacturers & Formulators of Enzyme Products, companies in the pancreatin market are emerging resilient to the COVID-19 pandemic, as enzymes form an important part of the food & feed chain. Apart from side effects from the consumption of pancreatin products, the high cost of these products is increasing the possibility of substitute medicines and consumption of non-branded pancreatin. Hence, manufacturers should invest in R&D to improve product formulations and lower cost of production processes to increase the availability of affordable pancreatin. As such, it has been found that approximately half of the acute pancreatitis cases are caused due to gallstones and rest by alcohol & other factors in the U.K.
Blends of enzymes are becoming popular among people, as people are growing increasingly aware about their health benefits. Such trends are contributing to the growth of the global pancreatin market. The demand for modern supplements is creating opportunities for manufacturers to innovate and combine enzymes based on animal, plant, and microbial sources.
Companies in the pancreatin market are gaining recognition for specializing in science-backed solutions that benefit microbiome health in individuals using probiotic, prebiotic, and enzyme technology. Microbiomes are used as a major source of enzymes for supplements that are produced commercially.
The emergence of the COVID-19 outbreak is associated with massive interruptions in normal life functioning and economies. This is anticipates to cause ripple effects in the pancreatin market. Nevertheless, an increasing number of participants in the market are switching to eCommerce and online shopping apps to boost product sales.
Companies in the pancreatin market are targeting health conscious consumers for increasing product uptake, since the pandemic has brought emphasis on health foods. Manufacturers are increasing efforts to adapt to new standard operating procedures (SOPs) as far as the safety of human resources is concerned. They are revising budgets to accommodate increased costs for complying with new SOPs. Manufacturers are ensuring less-interrupted supply of their additives to the food, feed, and enzymes manufacturing industries.
It has been found that the production and retail cost of pancreatin-based medicine is relatively high, as it involves multiple enzymes and manufacturers use leading-edge technology to ensure maximum purity of the ingredients. Nevertheless, manufacturers are investing in R&D to increase the availability of low-cost pancreatin products and to diversify their product offerings in applications such as the leather industry.
The high prevalence of pancreatic diseases is translating into value-grab opportunities for manufacturers in the pancreatin market. Issues of acute pancreatitis are surging worldwide due to increased rates of obesity and gallstones. According to a report published by the National Institute for Health and Care Excellence in 2018, several thousands of people every year are diagnosed with acute pancreatitis in the U.K.
Enzymes are being used in the leather industry for removing unwanted parts of animals to process animal skin as a raw material. Alkaline proteases that are utilized for soaking the skin and removing protein, fats & dirt in order to reduce the processing time. Thus, pancreatin is being publicized as an effective alternative to alkaline proteases, as it contains multiple relevant enzymes.
Manufacturers are boosting their output capacities, since pancreatin is also used as a bating agent for all types of raw materials and animal skins used for manufacturing various types of leather.
The growing adoption of digestive enzyme supplements in sports nutrition is contributing to the expansion of the pancreatin market. Proteins are essential macronutrients that play an important role to maintain a healthy lifestyle. Active individuals, fitness enthusiasts, and serious athletes are opting for pancreatin supplements to ensure muscle recovery. Due to high consumption of protein, there is a need for more enzyme supplements to aid in its absorption.
Pancreatin manufacturers are establishing stable revenue streams in animal feed applications. Digestive enzymes help break down feed into smaller units that fuel crucial life functions of animals.
Rising consumer awareness regarding severity of digestive disorders
Several unhealthy lifestyle habits of consumers such as poor diets, sedentary work, and increased levels of stress in daily life have a detrimental impact on digestive health. Consumers are focusing on preventative health management as most of them are working professionals and have disposable income to purchase supplements. This is promoting the demand for digestive enzymes.
Due to unhealthy lifestyles and people eating different foods, which require different enzymes and time to digest, as well as long working hours, people are gaining food sensitivities where their body is unable to digest certain foods. These are a few of the reasons leading to an increase in the consumption of supplements by the work-centric population.
Supplements with digestive enzymes help treat digestive diseases such as food intolerances, irritable bowel syndrome, Crohn's disease and celiac disease, and other chronic diseases
Different enzymes formulated to help digest broad range of foods
Enzyme producers are enhancing their formulations, with the outcome being a more segmented market. Enzyme products today are more concentrated than they were earlier. The wide range of enzyme materials has allowed manufacturers to formulate more specific, potent, and diverse products.
Brands are beginning to add supplemental digestive enzymes to their OTC product offerings, which show increased customer interest in protein and enzyme products. There has likewise been more focus on clinically concentrated enzymes. Enzyme producers are currently changing their product formulations to address the issues of disparate customer segments.
Side effects of pancreatin enzyme to hinder market growth
Pancreatin intake can cause nausea, vomiting, diarrhea, mouth and skin irritation, gastrointestinal pain, sore throat, and allergic reactions. High doses can cause problems such as high presence of uric acid in blood as well as colon damage. Since pancreatin is obtained from the pancreas of animals such as pigs and cows, one should not take pancreatin if allergic to pork proteins. It is also advised that pancreatin should not be taken during pregnancy and breastfeeding.
Various studies show that pancreatin may interact with other medicines such as acarbose and miglitol, and hence, should be avoided. Manufacturers of pancreatin recommend not to take pancreatin without consulting doctors. The adverse effects of pancreatin are, thus expected to restrain its sales.
There are also common side effects observed such as pain in the stomach, constipation, bloating, diarrhea, nausea, and vomiting. Symptoms such as itching, hives, swollen face and eyes, palpitations, rashes, and dizziness might require medical attention. These side effects might hamper the market for pancreatin enzyme.
|
Attribute |
Detail |
|
Market Size Value in 2021 (Base Year) |
US$ 101.4 Mn |
|
Market Forecast Value in 2031 |
US$ 175.7 Mn |
|
Growth Rate (CAGR) |
5.7% |
|
Forecast Period |
2021-2031 |
|
Quantitative Units |
US$ Mn for Value |
|
Market Analysis |
It includes segment analysis at global as well as regional level. Furthermore, qualitative analysis includes drivers, restraints, opportunities, key trends, supply chain analysis, parent industry overview, etc. |
|
Competition Landscape |
|
|
Format |
Electronic (PDF) + Excel |
|
Market Segmentation |
|
|
Regions Covered |
|
|
Countries Covered |
|
|
Companies Profiled |
|
|
Customization Scope |
Available upon Request |
|
Pricing |
Available upon Request |
Pancreatin Market is expected to Reach US$ 175.7 Mn By 2031
Pancreatin Market is estimated to rise at a CAGR of 5.7% during forecast period
Growing adoption of digestive enzyme supplements in sports nutrition is expected to drive the Pancreatin Market
Asia Pacific is more attractive for vendors in the Pancreatin Market
Key players of Pancreatin Market are Biovencer Healthcare Private Limited, Nordmark, Fengchen Group Co., Ltd, Biozyme, Sichuan Biosyn Pharmaceutical Co., Ltd, Bioseutica, Wellona Pharma, Shreeji Pharma International, Hetero Healthcare Limited, Creative Enzymes, Baoding Faithful Industry Co. Ltd., SG Pharma Pvt. Ltd, Provita Nutrition and Health Inc, Hepalink Group, NOW® Foods, Bio Basic Inc., Sichuan Deebio Pharmaceutical Co., Ltd., Enzyme Bioscience Pvt. Ltd, Umang Pharmaceuticals, Antozyme Bio
1. Executive Summary
1.1. Global Market Outlook
1.2. Demand Side Trends
1.3. Supply Side Trends
1.4. Analysis and Recommendations
2. Market Overview
2.1. Market Coverage / Taxonomy
2.2. Market Definition / Scope / Limitations
3. Key Market Trends
3.1. Key Trends Impacting the Market
3.2. Product Innovation / Development Trends
4. Key Success Factors
4.1. Product Adoption / Usage Analysis
4.2. Product USPs / Features
4.3. Strategic Promotional Strategies
5. Trade Outlook Scenario
5.1. Top Importing Countries (Value & Volume Analysis)
5.2. Top Exporting Countries (Value & Volume Analysis)
5.3. Average Pricing of Exporters & Importers
6. Sentiment Analysis
6.1. Consumer Sentiment Analysis
6.1.1. Consumer Sentiment Analysis – Overall Food Supplement Consumption
6.1.2. Consumer Sentiment Analysis – Popular Supplements Mapped by Age & Gender
6.1.3. Consumer Sentiment Analysis – Food Supplement Categories
6.2. Social Media Sentiment Analysis
6.2.1. Social Media Sentiment Analysis – Interest by Region “Pancreatin”
6.2.1.1. Social Media Sentiment Analysis – “Pancreatin” Interest by Country
6.2.1.2. Social Media Sentiment Analysis – “Pancreatin” Related Topics
6.2.1.3. Social Media Sentiment Analysis – “Pancreatin” Related Queries
6.2.2. Social Media Sentiment Analysis – Pancreatic Enzymes
6.2.2.1. Social Media Sentiment Analysis – Interest by Region “Pancreatic Enzyme”
6.2.2.2. Social Media Sentiment Analysis – “Pancreatic Enzyme” Interest by Country
6.2.3. Social Media Sentiment Analysis - Enzymes
6.2.3.1. Social Media Sentiment Analysis – Interest by Region “Enzyme”
6.2.3.2. Social Media Sentiment Analysis – “Enzyme” Interest by Country
6.2.4. Social Media Sentiment Analysis – Pancreatic Enzymes Vs Enzymes
7. Patent Analysis
7.1. Patent Analysis – Pancreatin 2001 to 2021
7.2. Patent Analysis – Pancreatin Legal Status 2001 to 2021
7.3. Patent Analysis – Pancreatin Patented Documents by Type 2001 to 2021
8. Global Pancreatin Market Demand Volume (Tons) Analysis 2016–2020 and Forecast, 2021–2031
8.1. Historical Market Volume (Tons) Analysis, 2016–2020
8.2. Current and Future Market Volume (Tons) Projections, 2021–2031
9. Global Pancreatin Market - Pricing Analysis
9.1. Regional Pricing Analysis
10. Global Pancreatin Market Demand Value (US$ ‘000) Analysis 2016–2020 and Forecast, 2021–2031
10.1. Historical Market Value (US$ ‘000) Analysis, 2016–2020
10.2. Current and Future Market Value (US$ ‘000) Projections, 2021–2031
10.2.1. Y-o-Y Growth Trend Analysis
10.2.2. Absolute $ Opportunity Analysis
11. Market Background
11.1. Macro-Economic Factors
11.1.1. Global GDP Growth Outlook
11.1.2. Global Industry Value Added
11.1.3. Global Urbanization Growth Outlook
11.1.4. Global Food Security Index Outlook
11.1.5. Global Rank – Ease of Doing Business
11.1.6. Global Rank – Trading Across Borders
11.2. Impact of COVID-19 on Enzymes Market
11.2.1. Manufacturer/Processors
11.2.2. Supply Chain and Logistics
11.2.3. Wholesalers/Traders
11.2.4. Retailers
11.3. COVID-19 Risk Assessment/Impact
11.4. Global Enzyme Industry Outlook
11.5. Global Pharmaceutical Industry Outlook
11.6. Global Nutraceutical Industry Outlook
11.7. End User Industry Demand Analysis
11.8. Pancreatin Processing Technology
11.9. Industry Value and Supply Chain Analysis
11.9.1. Profit Margin Analysis at each point of sales
11.9.1.1. Pancreatin Market Processors
11.9.1.2. Distributors/Suppliers/Wholesalers
11.9.1.3. Traders/Retailers
11.9.1.4. End Users
11.10. Key Certifications/Claims
11.11. Key Regulations
11.12. Market Dynamics
11.12.1. Drivers
11.12.2. Restraints
11.12.3. Opportunity Analysis
11.13. Forecast Factors - Relevance & Impact
12. Global Pancreatin Market Analysis 2016–2020 and Forecast 2021–2031, By Form
12.1. Introduction / Key Findings
12.2. Historical Market Value (US$ ‘000) and Volume (in Tons) Analysis By Form, 2016–2020
12.3. Current and Future Market Value (US$ ‘000) and Volume (in Tons) Analysis and Forecast By Form, 2021–2031
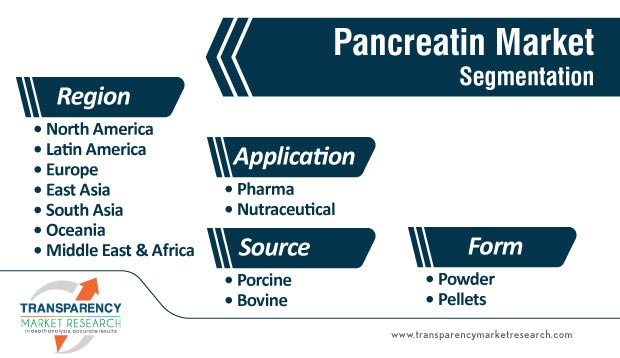
12.3.1. Powder
12.3.2. Pellets
12.4. Market Attractiveness Analysis By Form
13. Global Pancreatin Market Analysis 2016–2020 and Forecast 2021–2031, By Source
13.1. Introduction / Key Findings
13.2. Historical Market Value (US$ ‘000) and Volume (in Tons) Analysis By Source, 2016–2020
13.3. Current and Future Market Value (US$ ‘000) and Volume (in Tons) Analysis and Forecast By Source, 2021–2031
13.3.1. Porcine
13.3.2. Bovine
13.4. Market Attractiveness Analysis By Source
14. Global Pancreatin Market Analysis 2016–2020 and Forecast 2021–2031, By Application
14.1. Introduction / Key Findings
14.2. Historical Market Value (US$ ‘000) and Volume (in Tons) Analysis By Application, 2016–2020
14.3. Current and Future Market Value (US$ ‘000) and Volume (in Tons) Analysis and Forecast By Application, 2021–2031
14.3.1. Pharmaceutical
14.3.2. Nutraceutical
14.4. Market Attractiveness Analysis By Application
15. Global Pancreatin Market Analysis 2016–2020 and Forecast 2021–2031, by Region
15.1. Introduction
15.2. Historical Market Value (US$ ‘000) and Volume (in Tons) Analysis By Region, 2016–2020
15.3. Current Market Value (US$ ‘000) and Volume (in Tons) Analysis and Forecast By Region, 2021–2031
15.3.1. North America
15.3.2. Latin America
15.3.3. Europe
15.3.4. East Asia
15.3.5. South Asia
15.3.6. Oceania
15.3.7. Middle East and Africa (MEA)
15.4. Market Attractiveness Analysis By Region
16. North America Pancreatin Market Analysis 2016–2020 and Forecast 2021–2031
16.1. Introduction
16.2. Historical Market Value (US$ ‘000) and Volume (in Tons) Trend Analysis By Market Taxonomy, 2016–2020
16.3. Market Value (US$ ‘000) and Volume (in Tons) Forecast By Market Taxonomy, 2021–2031
16.3.1. By Country
16.3.1.1. U.S.
16.3.1.2. Canada
16.3.2. By Form
16.3.3. By Source
16.3.4. By Application
16.4. Market Attractiveness Analysis
16.4.1. By Country
16.4.2. By Form
16.4.3. By Source
16.4.4. By Application
16.5. Drivers and Restraints - Impact Analysis
17. Latin America Pancreatin Market Analysis 2016–2020 and Forecast 2021–2031
17.1. Introduction
17.2. Historical Market Value (US$ ‘000) and Volume (in Tons) Trend Analysis By Market Taxonomy, 2016–2020
17.3. Market Value (US$ ‘000) and Volume (in Tons) Forecast By Market Taxonomy, 2021–2031
17.3.1. By Country
17.3.1.1. Brazil
17.3.1.2. Mexico
17.3.1.3. Rest of Latin America
17.3.2. By Form
17.3.3. By Source
17.3.4. By Application
17.4. Market Attractiveness Analysis
17.4.1. By Country
17.4.2. By Form
17.4.3. By Source
17.4.4. By Application
17.5. Drivers and Restraints - Impact Analysis
18. Europe Pancreatin Market Analysis 2016–2020 and Forecast 2021–2031
18.1. Introduction
18.2. Historical Market Value (US$ ‘000) and Volume (in Tons) Trend Analysis By Market Taxonomy, 2016–2020
18.3. Market Value (US$ ‘000) and Volume (in Tons) Forecast By Market Taxonomy, 2021–2031
18.3.1. By Country
18.3.1.1. Germany
18.3.1.2. U.K.
18.3.1.3. France
18.3.1.4. Italy
18.3.1.5. Spain
18.3.1.6. BENELUX
18.3.1.7. Nordic
18.3.1.8. Russia
18.3.1.9. Poland
18.3.1.10. Rest of Europe
18.3.2. By Form
18.3.3. By Source
18.3.4. By Application
18.4. Market Attractiveness Analysis
18.4.1. By Country
18.4.2. By Form
18.4.3. By Source
18.4.4. By Application
18.5. Drivers and Restraints - Impact Analysis
19. South Asia Pancreatin Market Analysis 2016–2020 and Forecast 2021–2031
19.1. Introduction
19.2. Historical Market Value (US$ ‘000) and Volume (in Tons) Trend Analysis By Market Taxonomy, 2016–2020
19.3. Market Value (US$ ‘000) and Volume (in Tons) Forecast By Market Taxonomy, 2021–2031
19.3.1. By Country
19.3.1.1. India
19.3.1.2. Thailand
19.3.1.3. Indonesia
19.3.1.4. Malaysia
19.3.1.5. Rest of South Asia
19.3.2. By Form
19.3.3. By Source
19.3.4. By Application
19.4. Market Attractiveness Analysis
19.4.1. By Country
19.4.2. By Form
19.4.3. By Source
19.4.4. By Application
19.5. Drivers and Restraints - Impact Analysis
20. East Asia Pancreatin Market Analysis 2016–2020 and Forecast 2021–2031
20.1. Introduction
20.2. Historical Market Value (US$ ‘000) and Volume (in Tons) Trend Analysis By Market Taxonomy, 2016–2020
20.3. Market Value (US$ ‘000) and Volume (in Tons) Forecast By Market Taxonomy, 2021–2031
20.3.1. By Country
20.3.1.1. China
20.3.1.2. Japan
20.3.1.3. South Korea
20.3.2. By Form
20.3.3. By Source
20.3.4. By Application
20.4. Market Attractiveness Analysis
20.4.1. By Country
20.4.2. By Form
20.4.3. By Source
20.4.4. By Application
20.5. Drivers and Restraints - Impact Analysis
21. Oceania Pancreatin Market Analysis 2016–2020 and Forecast 2021–2031
21.1. Introduction
21.2. Historical Market Value (US$ ‘000) and Volume (in Tons) Trend Analysis By Market Taxonomy, 2016–2020
21.3. Market Value (US$ ‘000) and Volume (in Tons) Forecast By Market Taxonomy, 2021–2031
21.3.1. By Country
21.3.1.1. Australia
21.3.1.2. New Zealand
21.3.2. By Form
21.3.3. By Source
21.3.4. By Application
21.4. Market Attractiveness Analysis
21.4.1. By Country
21.4.2. By Form
21.4.3. By Source
21.4.4. By Application
21.5. Drivers and Restraints - Impact Analysis
22. Middle East and Africa Pancreatin Market Analysis 2016–2020 and Forecast 2021–2031
22.1. Introduction
22.2. Historical Market Value (US$ ‘000) and Volume (in Tons) Trend Analysis By Market Taxonomy, 2016–2020
22.3. Market Value (US$ ‘000) and Volume (in Tons) Forecast By Market Taxonomy, 2021–2031
22.3.1. By Country
22.3.1.1. GCC Countries
22.3.1.2. South Africa
22.3.1.3. Rest of Middle East and Africa
22.3.2. By Form
22.3.3. By Source
22.3.4. By Application
22.4. Market Attractiveness Analysis
22.4.1. By Country
22.4.2. By Form
22.4.3. By Source
22.4.4. By Application
22.5. Drivers and Restraints - Impact Analysis
23. Market Structure Analysis
23.1. Market Analysis by Tier of Companies
23.2. Market Concentration
23.3. Market Presence Analysis
24. Competition Analysis
24.1. Competition Dashboard
24.2. Competition Deep Dive
24.2.1. Antozyme Biotech Pvt Ltd
24.2.1.1. Overview
24.2.1.2. Product Portfolio
24.2.1.3. Sales Footprint
24.2.1.4. Key Developments
24.2.1.5. Strategy Overview
24.2.2. Umang Pharmaceuticals
24.2.2.1. Overview
24.2.2.2. Product Portfolio
24.2.2.3. Sales Footprint
24.2.2.4. Key Developments
24.2.2.5. Strategy Overview
24.2.3. Enzyme Bioscience Pvt. Ltd
24.2.3.1. Overview
24.2.3.2. Product Portfolio
24.2.3.3. Sales Footprint
24.2.3.4. Key Developments
24.2.3.5. Strategy Overview
24.2.4. Biovencer Healthcare Private Limited
24.2.4.1. Overview
24.2.4.2. Product Portfolio
24.2.4.3. Sales Footprint
24.2.4.4. Key Developments
24.2.4.5. Strategy Overview
24.2.5. Nordmark
24.2.5.1. Overview
24.2.5.2. Product Portfolio
24.2.5.3. Sales Footprint
24.2.5.4. Key Developments
24.2.5.5. Strategy Overview
24.2.6. Fengchen Group Co., Ltd.
24.2.6.1. Overview
24.2.6.2. Product Portfolio
24.2.6.3. Sales Footprint
24.2.6.4. Key Developments
24.2.6.5. Strategy Overview
24.2.7. Biozyme
24.2.7.1. Overview
24.2.7.2. Product Portfolio
24.2.7.3. Sales Footprint
24.2.7.4. Key Developments
24.2.7.5. Strategy Overview
24.2.8. Sichuan Biosyn Pharmaceutical Co., Ltd.
24.2.8.1. Overview
24.2.8.2. Product Portfolio
24.2.8.3. Sales Footprint
24.2.8.4. Key Developments
24.2.8.5. Strategy Overview
24.2.9. Bioseutica
24.2.9.1. Overview
24.2.9.2. Product Portfolio
24.2.9.3. Sales Footprint
24.2.9.4. Key Developments
24.2.9.5. Strategy Overview
24.2.10. Wellona Pharma
24.2.10.1. Overview
24.2.10.2. Product Portfolio
24.2.10.3. Sales Footprint
24.2.10.4. Key Developments
24.2.10.5. Strategy Overview
24.2.11. Shreeji Pharma International
24.2.11.1. Overview
24.2.11.2. Product Portfolio
24.2.11.3. Sales Footprint
24.2.11.4. Key Developments
24.2.11.5. Strategy Overview
24.2.12. Hetero Healthcare Limited
24.2.12.1. Overview
24.2.12.2. Product Portfolio
24.2.12.3. Sales Footprint
24.2.12.4. Key Developments
24.2.12.5. Strategy Overview
24.2.13. Creative Enzymes
24.2.13.1. Overview
24.2.13.2. Product Portfolio
24.2.13.3. Sales Footprint
24.2.13.4. Key Developments
24.2.13.5. Strategy Overview
24.2.14. Baoding Faithful Industry Co. Ltd.
24.2.14.1. Overview
24.2.14.2. Product Portfolio
24.2.14.3. Sales Footprint
24.2.14.4. Key Developments
24.2.14.5. Strategy Overview
24.2.15. SG Pharma Pvt. Ltd.
24.2.15.1. Overview
24.2.15.2. Product Portfolio
24.2.15.3. Sales Footprint
24.2.15.4. Key Developments
24.2.15.5. Strategy Overview
24.2.16. Provita Nutrition and Health Inc.
24.2.16.1. Overview
24.2.16.2. Product Portfolio
24.2.16.3. Sales Footprint
24.2.16.4. Key Developments
24.2.16.5. Strategy Overview
24.2.17. Hepalink Group
24.2.17.1. Overview
24.2.17.2. Product Portfolio
24.2.17.3. Sales Footprint
24.2.17.4. Key Developments
24.2.17.5. Strategy Overview
24.2.18. NOW® Foods
24.2.18.1. Overview
24.2.18.2. Product Portfolio
24.2.18.3. Sales Footprint
24.2.18.4. Key Developments
24.2.18.5. Strategy Overview
24.2.19. Bio Basic Inc.
24.2.19.1. Overview
24.2.19.2. Product Portfolio
24.2.19.3. Sales Footprint
24.2.19.4. Key Developments
24.2.19.5. Strategy Overview
24.2.20. Sichuan Deebio Pharmaceutical Co., Ltd.
24.2.20.1. Overview
24.2.20.2. Product Portfolio
24.2.20.3. Sales Footprint
24.2.20.4. Key Developments
24.2.20.5. Strategy Overview
24.2.21. Others (Available on Request)
25. Assumptions and Acronyms Used
26. Research Methodology
List of Tables
Table 01: Global Pancreatin Market Value (US$ '000) Analysis and Forecast By Form, 2016-2031
Table 02: Global Pancreatin Market Volume (Tons) Analysis and Forecast By Form, 2016-2031
Table 03: Global Pancreatin Market Value (US$ '000) Analysis and Forecast By Source, 2016-2031
Table 04: Global Pancreatin Market Volume (Tons) Analysis and Forecast By Source, 2016-2031
Table 05: Global Pancreatin Market Value (US$ '000) Analysis and Forecast By Application, 2016-2031
Table 06: Global Pancreatin Market Volume (Tons) Analysis and Forecast By Application, 2016-2031
Table 07: Global Pancreatin Market Value (US$ '000) Analysis and Forecast by Region, 2016-2031
Table 08: Global Pancreatin Market Volume (Tons) Analysis and Forecast by Region, 2016-2031
Table 09: North America Pancreatin Market Value (US$ '000) Analysis and Forecast by Form, 2016-2031
Table 10: North America Pancreatin Market Volume (Tons) Analysis and Forecast by Form, 2016-2031
Table 11: North America Pancreatin Market Value (US$ '000) Analysis and Forecast by Source, 2016-2031
Table 12: North America Pancreatin Market Volume (Tons) Analysis and Forecast by Source, 2016-2031
Table 13: North America Pancreatin Market Value (US$ '000) Analysis and Forecast by Application, 2016-2031
Table 14: North America Pancreatin Market Volume (Tons) Analysis and Forecast by Application, 2016-2031
Table 15: North America Pancreatin Market Value (US$ US$ '000) Analysis and Forecast by Country, 2016–2031
Table 16: North America Pancreatin Market Volume (Tons) Analysis and Forecast by Country, 2016–2031
Table 17: Latin America Pancreatin Market Value (US$ '000) Analysis and Forecast by Form, 2016-2031
Table 18: Latin America Pancreatin Market Volume (Tons) Analysis and Forecast by Form, 2016-2031
Table 19: Latin America Pancreatin Market Value (US$ '000) Analysis and Forecast by Source, 2016-2031
Table 20: Latin America Pancreatin Market Volume (Tons) Analysis and Forecast by Source, 2016-2031
Table 21: Latin America Pancreatin Market Value (US$ '000) Analysis and Forecast by Application, 2016-2031
Table 22: Latin America Pancreatin Market Volume (Tons) Analysis and Forecast by Application, 2016-2031
Table 23: Latin America Pancreatin Market Value (US$ US$ '000) Analysis and Forecast by Country, 2016–2031
Table 24: Latin America Pancreatin Market Volume (Tons) Analysis and Forecast by Country, 2016–2031
Table 25: Europe Pancreatin Market Value (US$ '000) Analysis and Forecast by Form, 2016-2031
Table 26: Europe Pancreatin Market Volume (Tons) Analysis and Forecast by Form, 2016-2031
Table 27: Europe Pancreatin Market Value (US$ '000) Analysis and Forecast by Source, 2016-2031
Table 28: Europe Pancreatin Market Volume (Tons) Analysis and Forecast by Source, 2016-2031
Table 29: Europe Pancreatin Market Value (US$ '000) Analysis and Forecast by Application, 2016-2031
Table 30: Europe Pancreatin Market Volume (Tons) Analysis and Forecast by Application, 2016-2031
Table 31: Europe Pancreatin Market Value (US$ US$ '000) Analysis and Forecast by Country, 2016–2031
Table 32: Europe Pancreatin Market Volume (Tons) Analysis and Forecast by Country, 2016–2031
Table 33: South Asia Pancreatin Market Value (US$ '000) Analysis and Forecast by Form, 2016-2031
Table 34: South Asia Pancreatin Market Volume (Tons) Analysis and Forecast by Form, 2016-2031
Table 35: South Asia Pancreatin Market Value (US$ '000) Analysis and Forecast by Source, 2016-2031
Table 36: South Asia Pancreatin Market Volume (Tons) Analysis and Forecast by Source, 2016-2031
Table 37: South Asia Pancreatin Market Value (US$ '000) Analysis and Forecast by Application, 2016-2031
Table 38: South Asia Pancreatin Market Volume (Tons) Analysis and Forecast by Application, 2016-2031
Table 39: South Asia Pancreatin Market Value (US$ US$ '000) Analysis and Forecast by Country, 2016–2031
Table 40: South Asia Pancreatin Market Volume (Tons) Analysis and Forecast by Country, 2016–2031
Table 41: East Asia Pancreatin Market Value (US$ '000) Analysis and Forecast by Form, 2016-2031
Table 42: East Asia Pancreatin Market Volume (Tons) Analysis and Forecast by Form, 2016-2031
Table 43: East Asia Pancreatin Market Value (US$ '000) Analysis and Forecast by Source, 2016-2031
Table 44: East Asia Pancreatin Market Volume (Tons) Analysis and Forecast by Source, 2016-2031
Table 45: East Asia Pancreatin Market Value (US$ '000) Analysis and Forecast by Application, 2016-2031
Table 46: East Asia Pancreatin Market Volume (Tons) Analysis and Forecast by Application, 2016-2031
Table 47: East Asia Pancreatin Market Value (US$ US$ '000) Analysis and Forecast by Country, 2016–2031
Table 48: East Asia Pancreatin Market Volume (Tons) Analysis and Forecast by Country, 2016–2031
Table 49: Oceania Pancreatin Market Value (US$ '000) Analysis and Forecast by Form, 2016-2031
Table 50: Oceania Pancreatin Market Volume (Tons) Analysis and Forecast by Form, 2016-2031
Table 51: Oceania Pancreatin Market Value (US$ '000) Analysis and Forecast by Source, 2016-2031
Table 52: Oceania Pancreatin Market Volume (Tons) Analysis and Forecast by Source, 2016-2031
Table 53: Oceania Pancreatin Market Value (US$ '000) Analysis and Forecast by Application, 2016-2031
Table 54: Oceania Pancreatin Market Volume (Tons) Analysis and Forecast by Application, 2016-2031
Table 55: Oceania Pancreatin Market Value (US$ US$ '000) Analysis and Forecast by Country, 2016–2031
Table 56: Oceania Pancreatin Market Volume (Tons) Analysis and Forecast by Country, 2016–2031
Table 57: Middle East & Africa Pancreatin Market Value (US$ '000) Analysis and Forecast by Form, 2016-2031
Table 58: Middle East & Africa Pancreatin Market Volume (Tons) Analysis and Forecast by Form, 2016-2031
Table 59: Middle East & Africa Pancreatin Market Value (US$ '000) Analysis and Forecast by Source, 2016-2031
Table 60: Middle East & Africa Pancreatin Market Volume (Tons) Analysis and Forecast by Source, 2016-2031
Table 61: Middle East & Africa Pancreatin Market Value (US$ '000) Analysis and Forecast by Application, 2016-2031
Table 62: Middle East & Africa Pancreatin Market Volume (Tons) Analysis and Forecast by Application, 2016-2031
Table 63: Middle East & Africa Pancreatin Market Value (US$ US$ '000) Analysis and Forecast by Country, 2016–2031
Table 64: Middle East & Africa Pancreatin Market Volume (Tons) Analysis and Forecast by Country, 2016–2031
List of Figures
Figure 01: Global Pancreatin Market Value (US$ '000) Forecast, 2021–2031
Figure 02: Global Pancreatin Market Volume (Tons) Forecast, 2021–2031
Figure 03: Global Pancreatin Market Value Share Analysis By Form, 2021 E
Figure 04: Global Pancreatin Market Y-o-Y Growth Rate By Form, 2021-2031
Figure 05: Global Pancreatin Market Value (US$ '000) Analysis & Forecast By Form, 2021–2031
Figure 06: Global Pancreatin Market Volume (Tons) Analysis & Forecast By Form, 2021–2031
Figure 07: Global Pancreatin Market Value Share Analysis By Source, 2021 E
Figure 08: Global Pancreatin Market Y-o-Y Growth Rate By Source, 2021-2031
Figure 09: Global Pancreatin Market Value (US$ '000) Analysis & Forecast By Source, 2021–2031
Figure 10: Global Pancreatin Market Volume (Tons) Analysis & Forecast By Source, 2021–2031
Figure 11: Global Pancreatin Market Value Share Analysis by Application, 2021 E
Figure 12: Global Pancreatin Market Y-o-Y Growth Rate by Application, 2021-2031
Figure 13: Global Pancreatin Market Value (US$ '000) Analysis & Forecast by Application, 2021–2031
Figure 14: Global Pancreatin Market Volume (Tons) Analysis & Forecast by Application, 2021–2031
Figure 15: Global Pancreatin Market Value Share Analysis by Region, 2021 E
Figure 16: Global Pancreatin Market Y-o-Y Growth Rate by Region, 2021-2031
Figure 17: Global Pancreatin Market Value (US$ '000) Analysis & Forecast by Region, 2021–2031
Figure 18: Global Pancreatin Market Volume (Tons) Analysis & Forecast by Region, 2021–2031
Figure 19: Global Pancreatin Market Attractiveness Analysis by Region, 2021-2031
Figure 20: Global Pancreatin Market Attractiveness Analysis by Form, 2021-2031
Figure 21: Global Pancreatin Market Attractiveness Analysis By Source, 2021-2031
Figure 22: Global Pancreatin Market Attractiveness Analysis by Application, 2021-2031
Figure 23: North America Pancreatin Market Value (US$ '000) Analysis & Forecast by Form, 2021-2031
Figure 24: North America Pancreatin Market Volume (Tons) Analysis & Forecast by Form, 2021-2031
Figure 25: North America Pancreatin Market Value (US$ '000) Analysis & Forecast by Source, 2021-2031
Figure 26: North America Pancreatin Market Volume (Tons) Analysis & Forecast by Source, 2021-2031
Figure 27: North America Pancreatin Market Value (US$ '000) Analysis & Forecast by Application, 2021-2031
Figure 28: North America Pancreatin Market Volume (Tons) Analysis & Forecast by Application, 2021-2031
Figure 29: North America Pancreatin Market Value (US$ '000) Analysis & Forecast by Country, 2021-2031
Figure 30: North America Pancreatin Market Volume (Tons) Analysis & Forecast by Country, 2021-2031
Figure 31: North America Pancreatin Market Attractiveness Analysis by Country, 2021-2031
Figure 32: North America Pancreatin Market Attractiveness Analysis by Form, 2021-2031
Figure 33: North America Pancreatin Market Attractiveness Analysis By Source, 2021-2031
Figure 34: North America Pancreatin Market Attractiveness Analysis by Application, 2021-2031
Figure 35: Latin America Pancreatin Market Value (US$ '000) Analysis & Forecast by Form, 2021-2031
Figure 36: Latin America Pancreatin Market Volume (Tons) Analysis & Forecast by Form, 2021-2031
Figure 37: Latin America Pancreatin Market Value (US$ '000) Analysis & Forecast by Source, 2021-2031
Figure 38: Latin America Pancreatin Market Volume (Tons) Analysis & Forecast by Source, 2021-2031
Figure 39: Latin America Pancreatin Market Value (US$ '000) Analysis & Forecast by Application, 2021-2031
Figure 40: Latin America Pancreatin Market Volume (Tons) Analysis & Forecast by Application, 2021-2031
Figure 41: Latin America Pancreatin Market Value (US$ '000) Analysis & Forecast by Country, 2021-2031
Figure 42: Latin America Pancreatin Market Volume (Tons) Analysis & Forecast by Country, 2021-2031
Figure 43: Latin America Pancreatin Market Attractiveness Analysis by Country, 2021-2031
Figure 44: Latin America Pancreatin Market Attractiveness Analysis by Form, 2021-2031
Figure 45: Latin America Pancreatin Market Attractiveness Analysis By Source, 2021-2031
Figure 46: Latin America Pancreatin Market Attractiveness Analysis by Application, 2021-2031
Figure 47: Europe Pancreatin Market Value (US$ '000) Analysis & Forecast by Form, 2021-2031
Figure 48: Europe Pancreatin Market Volume (Tons) Analysis & Forecast by Form, 2021-2031
Figure 49: Europe Pancreatin Market Value (US$ '000) Analysis & Forecast by Source, 2021-2031
Figure 50: Europe Pancreatin Market Volume (Tons) Analysis & Forecast by Source, 2021-2031
Figure 51: Europe Pancreatin Market Value (US$ '000) Analysis & Forecast by Application, 2021-2031
Figure 52: Europe Pancreatin Market Volume (Tons) Analysis & Forecast by Application, 2021-2031
Figure 53: Europe Pancreatin Market Value (US$ '000) Analysis & Forecast by Country, 2021-2031
Figure 54: Europe Pancreatin Market Volume (Tons) Analysis & Forecast by Country, 2021-2031
Figure 55: Europe Pancreatin Market Attractiveness Analysis by Country, 2021-2031
Figure 56: Europe Pancreatin Market Attractiveness Analysis by Form, 2021-2031
Figure 57: Europe Pancreatin Market Attractiveness Analysis By Source, 2021-2031
Figure 58: Europe Pancreatin Market Attractiveness Analysis by Application, 2021-2031
Figure 59: South Asia Pancreatin Market Value (US$ '000) Analysis & Forecast by Form, 2021-2031
Figure 60: South Asia Pancreatin Market Volume (Tons) Analysis & Forecast by Form, 2021-2031
Figure 61: South Asia Pancreatin Market Value (US$ '000) Analysis & Forecast by Source, 2021-2031
Figure 62: South Asia Pancreatin Market Volume (Tons) Analysis & Forecast by Source, 2021-2031
Figure 63: South Asia Pancreatin Market Value (US$ '000) Analysis & Forecast by Application, 2021-2031
Figure 64: South Asia Pancreatin Market Volume (Tons) Analysis & Forecast by Application, 2021-2031
Figure 65: South Asia Pancreatin Market Value (US$ '000) Analysis & Forecast by Country, 2021-2031
Figure 66: South Asia Pancreatin Market Volume (Tons) Analysis & Forecast by Country, 2021-2031
Figure 67: South Asia Pancreatin Market Attractiveness Analysis by Country, 2021-2031
Figure 68: South Asia Pancreatin Market Attractiveness Analysis by Form, 2021-2031
Figure 69: South Asia Pancreatin Market Attractiveness Analysis By Source, 2021-2031
Figure 70: South Asia Pancreatin Market Attractiveness Analysis by Application, 2021-2031
Figure 71: East Asia Pancreatin Market Value (US$ '000) Analysis & Forecast by Form, 2021-2031
Figure 72: East Asia Pancreatin Market Volume (Tons) Analysis & Forecast by Form, 2021-2031
Figure 73: East Asia Pancreatin Market Value (US$ '000) Analysis & Forecast by Source, 2021-2031
Figure 74: East Asia Pancreatin Market Volume (Tons) Analysis & Forecast by Source, 2021-2031
Figure 75: East Asia Pancreatin Market Value (US$ '000) Analysis & Forecast by Application, 2021-2031
Figure 76: East Asia Pancreatin Market Volume (Tons) Analysis & Forecast by Application, 2021-2031
Figure 77: East Asia Pancreatin Market Value (US$ '000) Analysis & Forecast by Country, 2021-2031
Figure 78: East Asia Pancreatin Market Volume (Tons) Analysis & Forecast by Country, 2021-2031
Figure 79: East Asia Pancreatin Market Attractiveness Analysis by Country, 2021-2031
Figure 80: East Asia Pancreatin Market Attractiveness Analysis by Form, 2021-2031
Figure 81: East Asia Pancreatin Market Attractiveness Analysis By Source, 2021-2031
Figure 82: East Asia Pancreatin Market Attractiveness Analysis by Application, 2021-2031
Figure 83: Oceania Pancreatin Market Value (US$ '000) Analysis & Forecast by Form, 2021-2031
Figure 84: Oceania Pancreatin Market Volume (Tons) Analysis & Forecast by Form, 2021-2031
Figure 85: Oceania Pancreatin Market Value (US$ '000) Analysis & Forecast by Source, 2021-2031
Figure 86: Oceania Pancreatin Market Volume (Tons) Analysis & Forecast by Source, 2021-2031
Figure 87: Oceania Pancreatin Market Value (US$ '000) Analysis & Forecast by Application, 2021-2031
Figure 88: Oceania Pancreatin Market Volume (Tons) Analysis & Forecast by Application, 2021-2031
Figure 89: Oceania Pancreatin Market Value (US$ '000) Analysis & Forecast by Country, 2021-2031
Figure 90: Oceania Pancreatin Market Volume (Tons) Analysis & Forecast by Country, 2021-2031
Figure 91: Oceania Pancreatin Market Attractiveness Analysis by Country, 2021-2031
Figure 92: Oceania Pancreatin Market Attractiveness Analysis by Form, 2021-2031
Figure 93: Oceania Pancreatin Market Attractiveness Analysis By Source, 2021-2031
Figure 94: Oceania Pancreatin Market Attractiveness Analysis by Application, 2021-2031
Figure 95: Middle East & Africa Pancreatin Market Value (US$ '000) Analysis & Forecast by Form, 2021-2031
Figure 96: Middle East & Africa Pancreatin Market Volume (Tons) Analysis & Forecast by Form, 2021-2031
Figure 97: Middle East & Africa Pancreatin Market Value (US$ '000) Analysis & Forecast by Source, 2021-2031
Figure 98: Middle East & Africa Pancreatin Market Volume (Tons) Analysis & Forecast by Source, 2021-2031
Figure 99: Middle East & Africa Pancreatin Market Value (US$ '000) Analysis & Forecast by Application, 2021-2031
Figure 100: Middle East & Africa Pancreatin Market Volume (Tons) Analysis & Forecast by Application, 2021-2031
Figure 101: Middle East & Africa Pancreatin Market Value (US$ '000) Analysis & Forecast by Country, 2021-2031
Figure 102: Middle East & Africa Pancreatin Market Volume (Tons) Analysis & Forecast by Country, 2021-2031
Figure 103: Middle East & Africa Pancreatin Market Attractiveness Analysis by Country, 2021-2031
Figure 104: Middle East & Africa Pancreatin Market Attractiveness Analysis by Form, 2021-2031
Figure 105: Middle East & Africa Pancreatin Market Attractiveness Analysis By Source, 2021-2031
Figure 106: Middle East & Africa Pancreatin Market Attractiveness Analysis by Application, 2021-2031
Copyright © Transparency Market Research, Inc. All Rights reserved
Trust Online

Pancreatin Market