
Reports
Reports
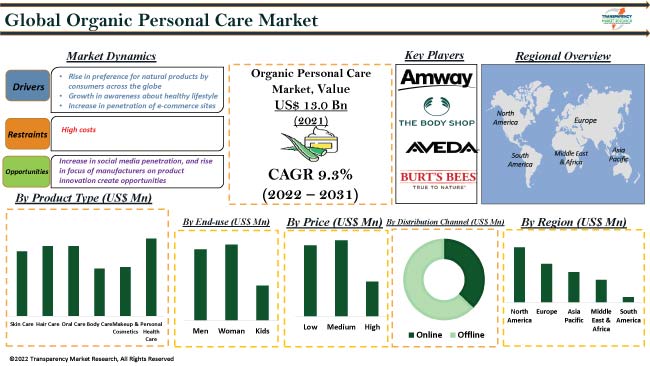
Analysts’ Viewpoint on Market Scenario
The organic personal care market is growing at a rapid pace due to the rise in awareness about natural personal care products across the globe. People are increasingly making conscious decisions while purchasing products for their skin, hair, body, and oral care owing to the rise in awareness about health and hygiene.
Non-organic personal care products contain synthetic ingredients, which can cause skin irritation, rashes, organ toxicity, and even cancer in the long run. This is significantly driving the demand for organic personal care products, as these products are less likely to cause allergic reactions, inflammations, or irritations. Key players in the global market are focusing on manufacturing innovative personal care products using natural ingredients to broaden their revenue streams.
Organic personal care products or organic self-care products are manufactured from natural sources and do not contain any chemical elements. Their contents are naturally extracted and do not include genetically engineered materials, synthetic residues, or chemicals.
Organic skin care products, organic hair care products, organic oral care products, organic body care products, organic makeup & cosmetics, and organic personal health care products are increasingly becoming popular among end-users. Natural products for acne, pigmentation, and tanning such as sunscreen, serums, face wash, and scrub are ideal for skin care.
The market for organic personal care is estimated to advance at a rapid pace owing to the availability of the best natural beauty products, rapidly rising urban population, increase in awareness about health and lifestyle, and a shift toward sustainability. Rise in demand for natural skin care products for acne and natural skin care products for dark skin tone in several regions is expected to create lucrative opportunities for personal care market players during the forecast period.
Increase in awareness about healthy lifestyle is the primary factor boosting the organic personal care market. Personal care products have become an essential element of people's lives, due to the rise in emphasis on beauty, personal hygiene, and overall well-being. Consumers of cosmetic products are increasingly opting for products with chemical-free ingredients that are eco-friendly.
Additionally, increase in awareness about hygiene is driving the demand for organic personal hygiene products. Environmental factors such as climate change and pollution; workplace stress; and poor eating habits are leading to a shift in consumer preference toward natural and organic products. Consumers are also increasingly looking more for vegan, natural, and organic ingredients in personal care products. This is expected to drive the market during the forecast period.
Demand for organic cosmetic products increased significantly during the peak of the COVID-19 pandemic, as homebound consumers used online platforms more frequently to shop for products. This has opened up lucrative opportunities for industry participants.
Appealing social media marketing strategies, such as quizzes and surveys, for product suggestions and development of digital sales channels are boosting the sale of products on e-commerce websites. For instance, Mamaearth, a brand in India, is creating appealing online content to capture the large consumer base. Rise in trend of using Korean beauty products in cosmetics and natural personal care is further expected to drive the market during the forecast period.
Based on product type, the skin care segment held the largest share of the global market in 2021. The segment is projected to maintain its dominance throughout the forecast period. Demand for skin care products is being driven by the rise in skin issues such as acne, and dry and aging skin.
Product launches in this segment by regional and multinational brands are likely to augment the overall market share. Several manufacturers are offering customization options for different skin types. This is likely to create lucrative opportunities for the organic skin care market in the next few years.
In terms of end-use, the women segment accounted for significant share of the organic personal care industry in 2021. The segment is expected to maintain its leading position in the market during the forecast period. Women are more aware and organized about their personal care routine. They use products such as cleansers, toners, moisturizers, sunscreens, etc. in their day-to-day lifestyle.
Rise in number of working women is estimated to fuel the demand for organic skin care products. Growth in skin concerns, primarily among women, is likely to boost the organic personal care market. Organic personal care products for acne are gaining traction among women due to the increase in skin issues due to hormonal imbalances, and continuous exposure to the sun and pollution. Demand for these products is also likely to increase among the male population owing to the rise in awareness about hygiene and grooming.
Europe dominated the global organic personal care market share in 2021. The region is expected to maintain its leading position during the forecast period owing to the increase in demand for organic ingredients and growth of the cosmetics market. According to the Personal Care Association in Europe, more than 500 million consumers use personal care products to protect their skin, hair, and body. Rise in importance of healthy lifestyle and growth in adoption of cosmetic products are likely to create lucrative opportunities for the market in the region.
North America is also expected to be a significant market for organic personal care during the forecast period due to the rise in consumer awareness about the benefits of organic products. The availability of a large number of key brands is also driving market growth in the region. The market in Asia Pacific is estimated to grow at a rapid pace during the forecast period due to the rise in awareness about organic products in countries such as India, China, and Japan. The benefits of using organic products and organic remedies are ingrained in the Japanese culture. Companies based in South Korea also provide the best organic skin care products. This is creating lucrative revenue opportunities for market players in the region.
The global organic personal care market is consolidated, with the presence of a few large-scale players that control majority of the share. Key players in the market are focused on expansion of product portfolios. Mergers and acquisitions are the major strategies adopted by the key players. Furthermore, market players are focusing on providing high-quality services to gain competitive advantage in the market.
Prominent players operating in the organic personal care industry are Burt’s Bees, True Botanicals, OSEA International, Aveda Corporation, Amway Corporation, The Body Shop International PLC, Herbivore Botanicals, Juice Beauty, INIKA Organic Australia, and Bare Escentuals Beauty, Inc.
Each of these companies has been summarized in the global personal care market report based on factors such as financial overview, company overview, business strategies, business segments, application portfolio, and recent developments.
|
Attribute |
Detail |
|
Market Size Value in 2021 |
US$ 13.0 Bn |
|
Market Forecast Value in 2031 |
US$ 31.4 Bn |
|
Growth Rate (CAGR) |
9.3% |
|
Forecast Period |
2022–2031 |
|
Historical Data Available for |
2017–2020 |
|
Quantitative Units |
US$ Bn for Value & Thousand Units for Volume |
|
Market Analysis |
It includes cross-segment analysis at the country level. Furthermore, the qualitative analysis includes drivers, restraints, opportunities, key trends, Porter’s Five Forces analysis, value chain analysis, and key trend analysis, COVID-19 impact analysis, and SWOT analysis. |
|
Competition Landscape |
|
|
Format |
Electronic (PDF) + Excel |
|
Market Segmentation |
|
|
Regions Covered |
|
|
Companies Profiled |
|
|
Customization Scope |
Available upon request |
|
Pricing |
Available upon request |
The market was valued at US$ 13.0 Bn in 2021
The global organic personal care market is estimated to grow at a CAGR of 9.3% during 2022-2031
Growth in awareness about healthy lifestyle, rise in preference for natural products across the globe, and increase in penetration of e-commerce sites
The skin care segment accounted for the largest share of the organic personal care business in 2021
Europe is likely to be the most lucrative market in the next few years.
Burt’s Bees, True Botanicals, OSEA International, Aveda Corporation, Amway Corporation, The Body Shop International PLC, Herbivore Botanicals, Juice Beauty, INIKA Organic Australia, and Bare Escentuals Beauty, Inc.
1. Preface
1.1. Market Definition and Scope
1.2. Market Segmentation
1.3. Key Research Objectives
1.4. Research Highlights
2. Assumptions
3. Research Methodology
4. Executive Summary
5. Market Overview
5.1. Introduction
5.2. Market Dynamics
5.2.1. Drivers
5.2.2. Restraints
5.2.3. Opportunities
5.3. Key Trends Analysis
5.3.1. Demand Side Analysis
5.3.2. Supply Side Analysis
5.4. Key Market Indicator
5.5. Porter’s Five Forces Analysis
5.6. Value Chain Analysis
5.7. Industry SWOT Analysis
5.8. COVID-19 Impact Analysis
5.9. Global Organic Personal Care Market Analysis and Forecast, 2017 - 2031
5.9.1. Market Value Projections (US$ Mn)
5.9.2. Market Volume Projections (Thousand Units)
6. Global Organic Personal Care Market Analysis and Forecast, By Product Type
6.1. Global Organic Personal Care Market Size (US$ Mn and Thousand Units) Forecast, By Product Type, 2017 – 2031
6.1.1. Skin Care
6.1.1.1. Facial Soap
6.1.1.2. Cleanser
6.1.1.3. Sun Protection Creams
6.1.1.4. Anti-aging Creams
6.1.1.5. Others (Face Wash, Face Creams, etc.)
6.1.2. Hair Care
6.1.2.1. Hair Oil
6.1.2.2. Hair Shampoo
6.1.2.3. Hair Scrub
6.1.2.4. Others (Conditioner, Hair Gel, etc.)
6.1.3. Oral Care
6.1.3.1. Toothpaste
6.1.3.2. Mouthwash
6.1.3.3. Others (Mouth Gel, Breath Mint, etc.)
6.1.4. Body Care
6.1.4.1. Body Lotion
6.1.4.2. Body Soaps
6.1.4.3. Others (Body Scrubs, Body Wash, etc.)
6.1.5. Makeup & Cosmetics
6.1.5.1. Foundation
6.1.5.2. Concealer
6.1.5.3. Others (Lipstick, Lip Balm, etc.)
6.1.6. Personal Health Care
6.1.6.1. Health Supplement
6.1.6.2. Beauty Supplement
6.1.6.3. Others (Nutrients, Proteins, etc.)
6.2. Incremental Opportunity, By Product Type
7. Global Organic Personal Care Market Analysis and Forecast, By End-use
7.1. Global Organic Personal Care Market Size (US$ Mn and Thousand Units) Forecast, By End-use, 2017 – 2031
7.1.1. Men
7.1.2. Women
7.1.3. Kids
7.2. Incremental Opportunity, By End-use
8. Global Organic Personal Care Market Analysis and Forecast, By Price
8.1. Global Organic Personal Care Market Size (US$ Mn and Thousand Units) Forecast, By Price, 2017 - 2031
8.1.1. Low
8.1.2. Medium
8.1.3. High
8.2. Incremental Opportunity, By Price
9. Global Organic Personal Care Market Analysis and Forecast, By Distribution Channel
9.1. Global Organic Personal Care Market Size (US$ Mn and Thousand Units) Forecast, By Distribution Channel, 2017 - 2031
9.1.1. Online
9.1.1.1. E-commerce Websites
9.1.1.2. Company-owned Websites
9.1.2. Offline
9.1.2.1. Supermarkets/Hypermarkets
9.1.2.2. Specialty Stores
9.1.2.3. Other Retail Stores
9.2. Incremental Opportunity, By Distribution Channel
10. Global Organic Personal Care Market Analysis and Forecast, By Region
10.1. Global Organic Personal Care Market Size (US$ Mn and Thousand Units) Forecast, By Region, 2017 - 2031
10.1.1. North America
10.1.2. Europe
10.1.3. Asia Pacific
10.1.4. Middle East & Africa
10.1.5. South America
10.2. Incremental Opportunity, By Region
11. North America Organic Personal Care Market Analysis and Forecast
11.1. Regional Snapshot
11.2. Demographic Overview
11.3. Key Trend Analysis
11.3.1. Demand Side
11.3.2. Supply Side
11.4. Brand Analysis
11.5. Consumer Buying Behavior Analysis
11.6. Price Trend Analysis
11.6.1. Weighted Average Selling Price (US$)
11.7. Organic Personal Care Market Size (US$ Mn and Thousand Units) Forecast, By Product Type, 2017 – 2031
11.7.1. Skin Care
11.7.1.1. Facial soap
11.7.1.2. Cleanser
11.7.1.3. Sun Protection Creams
11.7.1.4. Anti-aging Creams
11.7.1.5. Others (Face wash, Face Creams, etc.)
11.7.2. Hair Care
11.7.2.1. Hair Oil
11.7.2.2. Hair Shampoo
11.7.2.3. Hair Scrub
11.7.2.4. Others (Conditioner, Hair Gel, etc.)
11.7.3. Oral Care
11.7.3.1. Toothpaste
11.7.3.2. Mouthwash
11.7.3.3. Others (Mouth Gel, Breath Mint, etc.)
11.7.4. Body Care
11.7.4.1. Body Lotion
11.7.4.2. Body Soaps
11.7.4.3. Others (Body Scrubs, Body Wash, etc.)
11.7.5. Makeup & Cosmetics
11.7.5.1. Foundation
11.7.5.2. Concealer
11.7.5.3. Others (Lipstick, Lip Balm, etc.)
11.7.6. Personal Health Care
11.7.6.1. Health Supplement
11.7.6.2. Beauty Supplement
11.7.6.3. Others (Nutrients, Proteins, etc.)
11.8. Organic Personal Care Market Size (US$ Mn and Thousand Units) Forecast, By End-use, 2017 - 2031
11.8.1. Men
11.8.2. Women
11.8.3. Kids
11.9. Organic Personal Care Market Size (US$ Mn and Thousand Units) Forecast, By Price Range, 2017 – 2031
11.9.1. Low
11.9.2. Medium
11.9.3. High
11.10. Organic Personal Care Market Size (US$ Mn and Thousand Units) Forecast, By Distribution Channel, 2017 – 2031
11.10.1. Online
11.10.1.1. E-commerce Websites
11.10.1.2. Company-owned Websites
11.10.2. Offline
11.10.2.1. Supermarkets/Hypermarkets
11.10.2.2. Specialty Stores
11.10.2.3. Other Retail Stores
11.11. Organic Personal Care Market Size (US$ Mn and Thousand Units) Forecast, By Country, 2017 - 2031
11.11.1. The U.S.
11.11.2. Canada
11.11.3. Rest of North America
11.12. Incremental Opportunity Analysis
12. Europe Organic Personal Care Market Analysis and Forecast
12.1. Regional Snapshot
12.2. Demographic Overview
12.3. Key Trend Analysis
12.3.1. Demand Side
12.3.2. Supply Side
12.4. Brand Analysis
12.5. Consumer Buying Behavior Analysis
12.6. Price Trend Analysis
12.6.1. Weighted Average Selling Price (US$)
12.7. Organic Personal Care Market Size (US$ Mn and Thousand Units) Forecast, By Product Type, 2017 – 2031
12.7.1. Skin Care
12.7.1.1. Facial soap
12.7.1.2. Cleanser
12.7.1.3. Sun Protection Creams
12.7.1.4. Anti-aging Creams
12.7.1.5. Others (Face wash, Face Creams, etc.)
12.7.2. Hair Care
12.7.2.1. Hair Oil
12.7.2.2. Hair Shampoo
12.7.2.3. Hair Scrub
12.7.2.4. Others (Conditioner, Hair Gel, etc.)
12.7.3. Oral Care
12.7.3.1. Toothpaste
12.7.3.2. Mouthwash
12.7.3.3. Others (Mouth Gel, Breath Mint, etc.)
12.7.4. Body Care
12.7.4.1. Body Lotion
12.7.4.2. Body Soaps
12.7.4.3. Others (Body Scrubs, Body Wash, etc.)
12.7.5. Makeup & Cosmetics
12.7.5.1. Foundation
12.7.5.2. Concealer
12.7.5.3. Others (Lipstick, Lip Balm, etc.)
12.7.6. Personal Health Care
12.7.6.1. Health Supplement
12.7.6.2. Beauty Supplement
12.7.6.3. Others (Nutrients, Proteins, etc.)
12.8. Organic Personal Care Market Size (US$ Mn and Thousand Units) Forecast, By End-use, 2017 - 2031
12.8.1. Men
12.8.2. Women
12.8.3. Kids
12.9. Organic Personal Care Market Size (US$ Mn and Thousand Units) Forecast, By Price Range, 2017 – 2031
12.9.1. Low
12.9.2. Medium
12.9.3. High
12.10. Organic Personal Care Market Size (US$ Mn and Thousand Units) Forecast, By Distribution Channel, 2017 – 2031
12.10.1. Online
12.10.1.1. E-commerce Websites
12.10.1.2. Company-owned Websites
12.10.2. Offline
12.10.2.1. Supermarkets/Hypermarkets
12.10.2.2. Specialty Stores
12.10.2.3. Other Retail Stores
12.11. Organic Personal Care Market Size (US$ Mn and Thousand Units) Forecast, By Country, 2017 - 2031
12.11.1. U.K.
12.11.2. Germany
12.11.3. France
12.11.4. Rest of Europe
12.12. Incremental Opportunity Analysis
13. Asia Pacific Organic Personal Care Market Analysis and Forecast
13.1. Regional Snapshot
13.2. Demographic Overview
13.3. Key Trend Analysis
13.3.1. Demand Side
13.3.2. Supply Side
13.4. Brand Analysis
13.5. Consumer Buying Behavior Analysis
13.6. Price Trend Analysis
13.6.1. Weighted Average Selling Price (US$)
13.7. Organic Personal Care Market Size (US$ Mn and Thousand Units) Forecast, By Product Type, 2017 – 2031
13.7.1. Skin Care
13.7.1.1. Facial soap
13.7.1.2. Cleanser
13.7.1.3. Sun Protection Creams
13.7.1.4. Anti-aging Creams
13.7.1.5. Others (Face wash, Face Creams, etc.)
13.7.2. Hair Care
13.7.2.1. Hair Oil
13.7.2.2. Hair Shampoo
13.7.2.3. Hair Scrub
13.7.2.4. Others (Conditioner, Hair Gel, etc.)
13.7.3. Oral Care
13.7.3.1. Toothpaste
13.7.3.2. Mouthwash
13.7.3.3. Others (Mouth Gel, Breath Mint, etc.)
13.7.4. Body Care
13.7.4.1. Body Lotion
13.7.4.2. Body Soaps
13.7.4.3. Others (Body Scrubs, Body Wash, etc.)
13.7.5. Makeup & Cosmetics
13.7.5.1. Foundation
13.7.5.2. Concealer
13.7.5.3. Others (Lipstick, Lip Balm, etc.)
13.7.6. Personal Health Care
13.7.6.1. Health Supplement
13.7.6.2. Beauty Supplement
13.7.6.3. Others (Nutrients, Proteins, etc.)
13.8. Organic Personal Care Market Size (US$ Mn and Thousand Units) Forecast, By End-use, 2017 - 2031
13.8.1. Men
13.8.2. Women
13.8.3. Kids
13.9. Organic Personal Care Market Size (US$ Mn and Thousand Units) Forecast, By Price Range, 2017 – 2031
13.9.1. Low
13.9.2. Medium
13.9.3. High
13.10. Organic Personal Care Market Size (US$ Mn and Thousand Units) Forecast, By Distribution Channel, 2017 – 2031
13.10.1. Online
13.10.1.1. E-commerce Websites
13.10.1.2. Company-owned Websites
13.10.2. Offline
13.10.2.1. Supermarkets/Hypermarkets
13.10.2.2. Specialty Stores
13.10.2.3. Other Retail Stores
13.11. Organic Personal Care Market Size (US$ Mn and Thousand Units) Forecast, By Country, 2017 - 2031
13.11.1. China
13.11.2. India
13.11.3. Japan
13.11.4. South Korea
13.11.5. Rest of Asia Pacific
13.12. Incremental Opportunity Analysis
14. Middle East & Africa Organic Personal Care Market Analysis and Forecast
14.1. Regional Snapshot
14.2. Demographic Overview
14.3. Key Trend Analysis
14.3.1. Demand Side
14.3.2. Supply Side
14.4. Brand Analysis
14.5. Consumer Buying Behavior Analysis
14.6. Price Trend Analysis
14.6.1. Weighted Average Selling Price (US$)
14.7. Organic Personal Care Market Size (US$ Mn and Thousand Units) Forecast, By Product Type, 2017 – 2031
14.7.1. Skin Care
14.7.1.1. Facial soap
14.7.1.2. Cleanser
14.7.1.3. Sun Protection Creams
14.7.1.4. Anti-aging Creams
14.7.1.5. Others (Face wash, Face Creams, etc.)
14.7.2. Hair Care
14.7.2.1. Hair Oil
14.7.2.2. Hair Shampoo
14.7.2.3. Hair Scrub
14.7.2.4. Others (Conditioner, Hair Gel, etc.)
14.7.3. Oral Care
14.7.3.1. Toothpaste
14.7.3.2. Mouthwash
14.7.3.3. Others (Mouth Gel, Breath Mint, etc.)
14.7.4. Body Care
14.7.4.1. Body Lotion
14.7.4.2. Body Soaps
14.7.4.3. Others (Body Scrubs, Body Wash, etc.)
14.7.5. Makeup & Cosmetics
14.7.5.1. Foundation
14.7.5.2. Concealer
14.7.5.3. Others (Lipstick, Lip Balm, etc.)
14.7.6. Personal Health Care
14.7.6.1. Health Supplement
14.7.6.2. Beauty Supplement
14.7.6.3. Others (Nutrients, Proteins, etc.)
14.8. Organic Personal Care Market Size (US$ Mn and Thousand Units) Forecast, By End-use, 2017 - 2031
14.8.1. Men
14.8.2. Women
14.8.3. Kids
14.9. Organic Personal Care Market Size (US$ Mn and Thousand Units) Forecast, By Price Range, 2017 – 2031
14.9.1. Low
14.9.2. Medium
14.9.3. High
14.10. Organic Personal Care Market Size (US$ Mn and Thousand Units) Forecast, By Distribution Channel, 2017 – 2031
14.10.1. Online
14.10.1.1. E-commerce Websites
14.10.1.2. Company-owned Websites
14.10.2. Offline
14.10.2.1. Supermarkets/Hypermarkets
14.10.2.2. Specialty Stores
14.10.2.3. Other Retail Stores
14.11. Organic Personal Care Market Size (US$ Mn and Thousand Units) Forecast, By Country, 2017 - 2031
14.11.1. GCC
14.11.2. South Africa
14.11.3. Rest of Middle East & Africa
14.12. Incremental Opportunity Analysis
15. South America Organic Personal Care Market Analysis and Forecast
15.1. Regional Snapshot
15.2. Demographic Overview
15.3. Key Trend Analysis
15.3.1. Demand Side
15.3.2. Supply Side
15.4. Brand Analysis
15.5. Consumer Buying Behavior Analysis
15.6. Price Trend Analysis
15.6.1. Weighted Average Selling Price (US$)
15.7. Organic Personal Care Market Size (US$ Mn and Thousand Units) Forecast, By Product Type, 2017 – 2031
15.7.1. Skin Care
15.7.1.1. Facial soap
15.7.1.2. Cleanser
15.7.1.3. Sun Protection Creams
15.7.1.4. Anti-aging Creams
15.7.1.5. Others (Face wash, Face Creams, etc.)
15.7.2. Hair Care
15.7.2.1. Hair Oil
15.7.2.2. Hair Shampoo
15.7.2.3. Hair Scrub
15.7.2.4. Others (Conditioner, Hair Gel, etc.)
15.7.3. Oral Care
15.7.3.1. Toothpaste
15.7.3.2. Mouthwash
15.7.3.3. Others (Mouth Gel, Breath Mint, etc.)
15.7.4. Body Care
15.7.4.1. Body Lotion
15.7.4.2. Body Soaps
15.7.4.3. Others (Body Scrubs, Body Wash, etc.)
15.7.5. Makeup & Cosmetics
15.7.5.1. Foundation
15.7.5.2. Concealer
15.7.5.3. Others (Lipstick, Lip Balm, etc.)
15.7.6. Personal Health Care
15.7.6.1. Health Supplement
15.7.6.2. Beauty Supplement
15.7.6.3. Others (Nutrients, Proteins, etc.)
15.8. Organic Personal Care Market Size (US$ Mn and Thousand Units) Forecast, By End-use, 2017 - 2031
15.8.1. Men
15.8.2. Women
15.8.3. Kids
15.9. Organic Personal Care Market Size (US$ Mn and Thousand Units) Forecast, By Price Range, 2017 – 2031
15.9.1. Low
15.9.2. Medium
15.9.3. High
15.10. Organic Personal Care Market Size (US$ Mn and Thousand Units) Forecast, By Distribution Channel, 2017 – 2031
15.10.1. Online
15.10.1.1. E-commerce Websites
15.10.1.2. Company-owned Websites
15.10.2. Offline
15.10.2.1. Supermarkets/Hypermarkets
15.10.2.2. Specialty Stores
15.10.2.3. Other Retail Stores
15.11. Organic Personal Care Market Size (US$ Mn and Thousand Units) Forecast, By Country, 2017 - 2031
15.11.1. Brazil
15.11.2. Rest of South America
15.12. Incremental Opportunity Analysis
16. Competition Landscape
16.1. Market Player – Competition Dashboard
16.2. Market Share Analysis-2021 (%)
16.3. Company Profiles (Details – Company Overview, Sales Area/Geographical Presence, Financial/Revenue (Segmental Revenue), Strategy & Business Overview, Sales Channel Analysis, Product Portfolio & Pricing)
16.3.1. Burt’s Bees
16.3.1.1. Company Overview
16.3.1.2. Sales Area/Geographical Presence
16.3.1.3. Financial/Revenue (Segmental Revenue)
16.3.1.4. Strategy & Business Overview
16.3.1.5. Sales Channel Analysis
16.3.1.6. Product Portfolio & Pricing
16.3.2. True Botanicals
16.3.2.1. Company Overview
16.3.2.2. Sales Area/Geographical Presence
16.3.2.3. Financial/Revenue (Segmental Revenue)
16.3.2.4. Strategy & Business Overview
16.3.2.5. Sales Channel Analysis
16.3.2.6. Product Portfolio & Pricing
16.3.3. OSEA International
16.3.3.1. Company Overview
16.3.3.2. Sales Area/Geographical Presence
16.3.3.3. Financial/Revenue (Segmental Revenue)
16.3.3.4. Strategy & Business Overview
16.3.3.5. Sales Channel Analysis
16.3.3.6. Product Portfolio & Pricing
16.3.4. Aveda Corporation
16.3.4.1. Company Overview
16.3.4.2. Sales Area/Geographical Presence
16.3.4.3. Financial/Revenue (Segmental Revenue)
16.3.4.4. Strategy & Business Overview
16.3.4.5. Sales Channel Analysis
16.3.4.6. Product Portfolio & Pricing
16.3.5. Amway Corporation
16.3.5.1. Company Overview
16.3.5.2. Sales Area/Geographical Presence
16.3.5.3. Financial/Revenue (Segmental Revenue)
16.3.5.4. Strategy & Business Overview
16.3.5.5. Sales Channel Analysis
16.3.5.6. Product Portfolio & Pricing
16.3.6. The Body Shop International PLC
16.3.6.1. Company Overview
16.3.6.2. Sales Area/Geographical Presence
16.3.6.3. Financial/Revenue (Segmental Revenue)
16.3.6.4. Strategy & Business Overview
16.3.6.5. Sales Channel Analysis
16.3.6.6. Product Portfolio & Pricing
16.3.7. Herbivore Botanicals
16.3.7.1. Company Overview
16.3.7.2. Sales Area/Geographical Presence
16.3.7.3. Financial/Revenue (Segmental Revenue)
16.3.7.4. Strategy & Business Overview
16.3.7.5. Sales Channel Analysis
16.3.7.6. Product Portfolio & Pricing
16.3.8. Juice Beauty
16.3.8.1. Company Overview
16.3.8.2. Sales Area/Geographical Presence
16.3.8.3. Financial/Revenue (Segmental Revenue)
16.3.8.4. Strategy & Business Overview
16.3.8.5. Sales Channel Analysis
16.3.8.6. Product Portfolio & Pricing
16.3.9. INIKA Organic Australia.
16.3.9.1. Company Overview
16.3.9.2. Sales Area/Geographical Presence
16.3.9.3. Financial/Revenue (Segmental Revenue)
16.3.9.4. Strategy & Business Overview
16.3.9.5. Sales Channel Analysis
16.3.9.6. Product Portfolio & Pricing
16.3.10. Bare Escentuals Beauty, Inc.
16.3.10.1. Company Overview
16.3.10.2. Sales Area/Geographical Presence
16.3.10.3. Financial/Revenue (Segmental Revenue)
16.3.10.4. Strategy & Business Overview
16.3.10.5. Sales Channel Analysis
16.3.10.6. Product Portfolio & Pricing
17. Key Takeaway
17.1. Identification of Potential Market Spaces
17.1.1. Product Type
17.1.2. End-use
17.1.3. Price Range
17.1.4. Distribution Channel
17.1.5. Geography
17.2. Understanding the Buying Process of the Customers
17.3. Prevailing Market Risks
17.4. Preferred Sales & Marketing Strategy
List of Tables
Table 1: Global Organic Personal Care Market Projection, by Product Type, (Thousand Units) 2017-2031
Table 2: Global Organic Personal Care Market Projection, by Product Type, (US$ Mn) 2017-2031
Table 3: Global Organic Personal Care Market Projection, by End-use, (Thousand Units) 2017-2031
Table 4: Global Organic Personal Care Market Projection, by End-use, (US$ Mn) 2017-2031
Table 5: Global Organic Personal Care Market Projection, by Price, (Thousand Units) 2017-2031
Table 6: Global Organic Personal Care Market Projection, by Price, (US$ Mn) 2017-2031
Table 7: Global Organic Personal Care Market Projection, by Distribution Channel, (Thousand Units) 2017-2031
Table 8: Global Organic Personal Care Market Projection, by Distribution Channel, (US$ Mn) 2017-2031
Table 9: Global Organic Personal Care Market Projection, by Region, (Thousand Units) 2017-2031
Table 10: Global Organic Personal Care Market Projection, by Region, (US$ Mn) 2017-2031
Table 11: North America Organic Personal Care Market Projection, by Product Type, (Thousand Units) 2017-2031
Table 12: North America Organic Personal Care Market Projection, by Product Type, (US$ Mn) 2017-2031
Table 13: North America Organic Personal Care Market Projection, by End-use, (Thousand Units) 2017-2031
Table 14: North America Organic Personal Care Market Projection, by End-use, (US$ Mn) 2017-2031
Table 15: North America Organic Personal Care Market Projection, by Price, (Thousand Units) 2017-2031
Table 16: North America Organic Personal Care Market Projection, by Price, (US$ Mn) 2017-2031
Table 17: North America Organic Personal Care Market Projection, by Distribution Channel, (Thousand Units) 2017-2031
Table 18: North America Organic Personal Care Market Projection, by Distribution Channel, (US$ Mn) 2017-2031
Table 19: North America Organic Personal Care Market Projection, by Country, (Thousand Units) 2017-2031
Table 20: North America Organic Personal Care Market Projection, by Country, (US$ Mn) 2017-2031
Table 21: Europe Organic Personal Care Market Projection, by Product Type, (Thousand Units) 2017-2031
Table 22: Europe Organic Personal Care Market Projection, by Product Type, (US$ Mn) 2017-2031
Table 23: Europe Organic Personal Care Market Projection, by End-use, (Thousand Units) 2017-2031
Table 24: Europe Organic Personal Care Market Projection, by End-use, (US$ Mn) 2017-2031
Table 25: Europe Organic Personal Care Market Projection, by Price, (Thousand Units) 2017-2031
Table 26: Europe Organic Personal Care Market Projection, by Price, (US$ Mn) 2017-2031
Table 27: Europe Organic Personal Care Market Projection, by Distribution Channel, (Thousand Units) 2017-2031
Table 28: Europe Organic Personal Care Market Projection, by Distribution Channel, (US$ Mn) 2017-2031
Table 29: Europe Organic Personal Care Market Projection, by Country, (Thousand Units) 2017-2031
Table 30: Europe Organic Personal Care Market Projection, by Country, (US$ Mn) 2017-2031
Table 31: Asia Pacific Organic Personal Care Market Projection, by Product Type, (Thousand Units) 2017-2031
Table 32: Asia Pacific Organic Personal Care Market Projection, by Product Type, (US$ Mn) 2017-2031
Table 33: Asia Pacific Organic Personal Care Market Projection, by End-use, (Thousand Units) 2017-2031
Table 34: Asia Pacific Organic Personal Care Market Projection, by End-use, (US$ Mn) 2017-2031
Table 35: Asia Pacific Organic Personal Care Market Projection, by Price, (Thousand Units) 2017-2031
Table 36: Asia Pacific Organic Personal Care Market Projection, by Price, (US$ Mn) 2017-2031
Table 37: Asia Pacific Organic Personal Care Market Projection, by Distribution Channel, (Thousand Units) 2017-2031
Table 38: Asia Pacific Organic Personal Care Market Projection, by Distribution Channel, (US$ Mn) 2017-2031
Table 39: Asia Pacific Organic Personal Care Market Projection, by Country, (Thousand Units) 2017-2031
Table 40: Asia Pacific Organic Personal Care Market Projection, by Country, (US$ Mn) 2017-2031
Table 41: Middle East & Africa Organic Personal Care Market Projection, by Product Type, (Thousand Units) 2017-2031
Table 42: Middle East & Africa Organic Personal Care Market Projection, by Product Type, (US$ Mn) 2017-2031
Table 43: Middle East & Africa Organic Personal Care Market Projection, by End-use, (Thousand Units) 2017-2031
Table 44: Middle East & Africa Organic Personal Care Market Projection, by End-use, (US$ Mn) 2017-2031
Table 45: Middle East & Africa Organic Personal Care Market Projection, by Price, (Thousand Units) 2017-2031
Table 46: Middle East & Africa Organic Personal Care Market Projection, by Price, (US$ Mn) 2017-2031
Table 47: Middle East & Africa Organic Personal Care Market Projection, by Distribution Channel, (Thousand Units) 2017-2031
Table 48: Middle East & Africa Organic Personal Care Market Projection, by Distribution Channel, (US$ Mn) 2017-2031
Table 49: Middle East & Africa Organic Personal Care Market Projection, by Country, (Thousand Units) 2017-2031
Table 50: Middle East & Africa Organic Personal Care Market Projection, by Country, (US$ Mn) 2017-2031
Table 51: South America Organic Personal Care Market Projection, by Product Type, (Thousand Units) 2017-2031
Table 52: South America Organic Personal Care Market Projection, by Product Type, (US$ Mn) 2017-2031
Table 53: South America Organic Personal Care Market Projection, by End-use, (Thousand Units) 2017-2031
Table 54: South America Organic Personal Care Market Projection, by End-use, (US$ Mn) 2017-2031
Table 55: South America Organic Personal Care Market Projection, by Price, (Thousand Units) 2017-2031
Table 56: South America Organic Personal Care Market Projection, by Price, (US$ Mn) 2017-2031
Table 57: South America Organic Personal Care Market Projection, by Distribution Channel, (Thousand Units) 2017-2031
Table 58: South America Organic Personal Care Market Projection, by Distribution Channel, (US$ Mn) 2017-2031
Table 59: South America Organic Personal Care Market Projection, by Country, (Thousand Units) 2017-2031
Table 60: South America Organic Personal Care Market Projection, by Country, (US$ Mn) 2017-2031
List of Figures
Figure 1: Global Organic Personal Care Market Projection, by Product Type, (Thousand Units) 2017-2031
Figure 2: Global Organic Personal Care Market Projection, by Product Type, (US$ Mn) 2017-2031
Figure 3: Global Organic Personal Care Market Incremental Opportunity by Product Type, (US$ Mn) 2022-2031
Figure 4: Global Organic Personal Care Market Projection, by End-use, (Thousand Units) 2017-2031
Figure 5: Global Organic Personal Care Market Projection, by End-use, (US$ Mn) 2017-2031
Figure 6: Global Organic Personal Care Market Incremental Opportunity by End-use, (US$ Mn) 2022-2031
Figure 7: Global Organic Personal Care Market Projection, by Price, (Thousand Units) 2017-2031
Figure 8: Global Organic Personal Care Market Projection, by Price, (US$ Mn) 2017-2031
Figure 9: Global Organic Personal Care Market Incremental Opportunity by Price, (US$ Mn) 2022-2031
Figure 10: Global Organic Personal Care Market Projection, by Distribution Channel, (Thousand Units) 2017-2031
Figure 11: Global Organic Personal Care Market Projection, by Distribution Channel, (US$ Mn) 2017-2031
Figure 12: Global Organic Personal Care Market Incremental Opportunity by Distribution Channel, (US$ Mn) 2022-2031
Figure 13: Global Organic Personal Care Market Projection, by Region, (Thousand Units) 2017-2031
Figure 14: Global Organic Personal Care Market Projection, by Region, (US$ Mn) 2017-2031
Figure 15: Global Organic Personal Care Market Incremental Opportunity by Region, (US$ Mn) 2022-2031
Figure 16: North America Organic Personal Care Market Projection, by Product Type, (Thousand Units) 2017-2031
Figure 17: North America Organic Personal Care Market Projection, by Product Type, (US$ Mn) 2017-2031
Figure 18: North America Organic Personal Care Market Incremental Opportunity by Product Type, (US$ Mn) 2022-2031
Figure 19: North America Organic Personal Care Market Projection, by End-use, (Thousand Units) 2017-2031
Figure 20: North America Organic Personal Care Market Projection, by End-use, (US$ Mn) 2017-2031
Figure 21: North America Organic Personal Care Market Incremental Opportunity by End-use, (US$ Mn) 2022-2031
Figure 22: North America Organic Personal Care Market Projection, by Price, (Thousand Units) 2017-2031
Figure 23: North America Organic Personal Care Market Projection, by Price, (US$ Mn) 2017-2031
Figure 24: North America Organic Personal Care Market Incremental Opportunity by Price, (US$ Mn) 2022-2031
Figure 25: North America Organic Personal Care Market Projection, by Distribution Channel, (Thousand Units) 2017-2031
Figure 26: North America Organic Personal Care Market Projection, by Distribution Channel, (US$ Mn) 2017-2031
Figure 27: North America Organic Personal Care Market Incremental Opportunity by Distribution Channel, (US$ Mn) 2022-2031
Figure 28: North America Organic Personal Care Market Projection, by Country, (Thousand Units) 2017-2031
Figure 29: North America Organic Personal Care Market Projection, by Country, (US$ Mn) 2017-2031
Figure 30: North America Organic Personal Care Market Incremental Opportunity by Country, (US$ Mn) 2022-2031
Figure 31: Europe Organic Personal Care Market Projection, by Product Type, (Thousand Units) 2017-2031
Figure 32: Europe Organic Personal Care Market Projection, by Product Type, (US$ Mn) 2017-2031
Figure 33: Europe Organic Personal Care Market Incremental Opportunity by Product Type, (US$ Mn) 2022-2031
Figure 34: Europe Organic Personal Care Market Projection, by End-use, (Thousand Units) 2017-2031
Figure 35: Europe Organic Personal Care Market Projection, by End-use, (US$ Mn) 2017-2031
Figure 36: Europe Organic Personal Care Market Incremental Opportunity by End-use, (US$ Mn) 2022-2031
Figure 37: Europe Organic Personal Care Market Projection, by Price, (Thousand Units) 2017-2031
Figure 38: Europe Organic Personal Care Market Projection, by Price, (US$ Mn) 2017-2031
Figure 39: Europe Organic Personal Care Market Incremental Opportunity by Price, (US$ Mn) 2022-2031
Figure 40: Europe Organic Personal Care Market Projection, by Distribution Channel, (Thousand Units) 2017-2031
Figure 41: Europe Organic Personal Care Market Projection, by Distribution Channel, (US$ Mn) 2017-2031
Figure 42: Europe Organic Personal Care Market Incremental Opportunity by Distribution Channel, (US$ Mn) 2022-2031
Figure 43: Europe Organic Personal Care Market Projection, by Country, (Thousand Units) 2017-2031
Figure 44: Europe Organic Personal Care Market Projection, by Country, (US$ Mn) 2017-2031
Figure 45: Europe Organic Personal Care Market Incremental Opportunity by Country, (US$ Mn) 2022-2031
Figure 46: Asia Pacific Organic Personal Care Market Projection, by Product Type, (Thousand Units) 2017-2031
Figure 47: Asia Pacific Organic Personal Care Market Projection, by Product Type, (US$ Mn) 2017-2031
Figure 48: Asia Pacific Organic Personal Care Market Incremental Opportunity by Product Type, (US$ Mn) 2022-2031
Figure 49: Asia Pacific Organic Personal Care Market Projection, by End-use, (Thousand Units) 2017-2031
Figure 50: Asia Pacific Organic Personal Care Market Projection, by End-use, (US$ Mn) 2017-2031
Figure 51: Asia Pacific Organic Personal Care Market Incremental Opportunity by End-use, (US$ Mn) 2022-2031
Figure 52: Asia Pacific Organic Personal Care Market Projection, by Price, (Thousand Units) 2017-2031
Figure 53: Asia Pacific Organic Personal Care Market Projection, by Price, (US$ Mn) 2017-2031
Figure 54: Asia Pacific Organic Personal Care Market Incremental Opportunity by Price, (US$ Mn) 2022-2031
Figure 55: Asia Pacific Organic Personal Care Market Projection, by Distribution Channel, (Thousand Units) 2017-2031
Figure 56: Asia Pacific Organic Personal Care Market Projection, by Distribution Channel, (US$ Mn) 2017-2031
Figure 57: Asia Pacific Organic Personal Care Market Incremental Opportunity by Distribution Channel, (US$ Mn) 2022-2031
Figure 58: Asia Pacific Organic Personal Care Market Projection, by Country, (Thousand Units) 2017-2031
Figure 59: Asia Pacific Organic Personal Care Market Projection, by Country, (US$ Mn) 2017-2031
Figure 60: Asia Pacific Organic Personal Care Market Incremental Opportunity by Country, (US$ Mn) 2022-2031
Figure 61: Middle East & Africa Organic Personal Care Market Projection, by Product Type, (Thousand Units) 2017-2031
Figure 62: Middle East & Africa Organic Personal Care Market Projection, by Product Type, (US$ Mn) 2017-2031
Figure 63: Middle East & Africa Organic Personal Care Market Incremental Opportunity by Product Type, (US$ Mn) 2022-2031
Figure 64: Middle East & Africa Organic Personal Care Market Projection, by End-use, (Thousand Units) 2017-2031
Figure 65: Middle East & Africa Organic Personal Care Market Projection, by End-use, (US$ Mn) 2017-2031
Figure 66: Middle East & Africa Organic Personal Care Market Incremental Opportunity by End-use, (US$ Mn) 2022-2031
Figure 67: Middle East & Africa Organic Personal Care Market Projection, by Price, (Thousand Units) 2017-2031
Figure 68: Middle East & Africa Organic Personal Care Market Projection, by Price, (US$ Mn) 2017-2031
Figure 69: Middle East & Africa Organic Personal Care Market Incremental Opportunity by Price, (US$ Mn) 2022-2031
Figure 70: Middle East & Africa Organic Personal Care Market Projection, by Distribution Channel, (Thousand Units) 2017-2031
Figure 71: Middle East & Africa Organic Personal Care Market Projection, by Distribution Channel, (US$ Mn) 2017-2031
Figure 72: Middle East & Africa Organic Personal Care Market Incremental Opportunity by Distribution Channel, (US$ Mn) 2022-2031
Figure 73: Middle East & Africa Organic Personal Care Market Projection, by Country, (Thousand Units) 2017-2031
Figure 74: Middle East & Africa Organic Personal Care Market Projection, by Country, (US$ Mn) 2017-2031
Figure 75: Middle East & Africa Organic Personal Care Market Incremental Opportunity by Country, (US$ Mn) 2022-2031
Figure 76: South America Organic Personal Care Market Projection, by Product Type, (Thousand Units) 2017-2031
Figure 77: South America Organic Personal Care Market Projection, by Product Type, (US$ Mn) 2017-2031
Figure 78: South America Organic Personal Care Market Incremental Opportunity by Product Type, (US$ Mn) 2022-2031
Figure 79: South America Organic Personal Care Market Projection, by End-use, (Thousand Units) 2017-2031
Figure 80: South America Organic Personal Care Market Projection, by End-use, (US$ Mn) 2017-2031
Figure 81: South America Organic Personal Care Market Incremental Opportunity by End-use, (US$ Mn) 2022-2031
Figure 82: South America Organic Personal Care Market Projection, by Price, (Thousand Units) 2017-2031
Figure 83: South America Organic Personal Care Market Projection, by Price, (US$ Mn) 2017-2031
Figure 84: South America Organic Personal Care Market Incremental Opportunity by Price, (US$ Mn) 2022-2031
Figure 85: South America Organic Personal Care Market Projection, by Distribution Channel, (Thousand Units) 2017-2031
Figure 86: South America Organic Personal Care Market Projection, by Distribution Channel, (US$ Mn) 2017-2031
Figure 87: South America Organic Personal Care Market Incremental Opportunity by Distribution Channel, (US$ Mn) 2022-2031
Figure 88: South America Organic Personal Care Market Projection, by Country, (Thousand Units) 2017-2031
Figure 89: South America Organic Personal Care Market Projection, by Country, (US$ Mn) 2017-2031
Figure 90: South America Organic Personal Care Market Incremental Opportunity by Country, (US$ Mn) 2022-2031
Copyright © Transparency Market Research, Inc. All Rights reserved
Trust Online

Organic Personal Care Market