
Reports
Reports
Analysts’ Viewpoint on Optical Sensor Market Scenario
Penetration of technologies such as Industry 4.0, artificial intelligence (AI), cloud computing, big data analytics, IoT, 5G, and cyber security is driving the global optical sensor market. Adoption of optical sensors is rising in consumer electronic, healthcare, lighting, crop management, and road signaling devices due to their flexibility and reliability. This is also augmenting the global optical sensor market size. Furthermore, optical sensors are being used increasingly in display management, automotive cleaning system, access control and security, and smart surfaces. This is expected to fuel the global optical sensor market in the near future. Key players operating in the market are striving to introduce novel and innovative technologies such as smart/intelligent sensors in automation, precision, and electronics industry verticals to broaden their revenue streams.
Optical sensor is used in diverse applications across industries such as consumer electronics, aerospace & defense, automotive, healthcare, oil & gas, food & beverage, and media & entertainment due to its prominent features such as contactless installation, high spatial resolution, and relatively easier detection. Optical sensors have been broadly segmented into five types: fiber optic sensors, image sensors (CMOS and CC), photoelectric sensors, ambient light sensors, and others (infrared sensors, optical proximity sensors, etc.) The usage of fiber optic sensors has been rising in various applications such as measurement of chemical parameters, liquid flow and level, and gas detection owing to their compact form and immunity to electromagnetic interference. Expansion in fiber network across the globe is expected to create lucrative opportunities for manufacturers of fiber optic sensors. Rise in penetration of consumer electronic devices such as smartphones, tablets, smart wearables, and cameras is the primary factor driving the demand for different types of optical sensors and applications.
Of late, demand for photoelectric sensors has been rising in industries such as life sciences, pharmaceutical, food and beverage, and household and personal care due to the increase in need for high image resolution sensors and easy-to-apply sensing solutions. The photoelectric line of sensor offers features such as high-performance and adaptability to deliver excellent detection capabilities. These sensors offer a full range of sensing modes in a sealed, compact, cavity-free housing that minimizes the collection of dust and debris while allowing for easy sensor cleanup. Manufacturers of photoelectric sensor are focusing on the development of cost-effective products with wide range of features. For instance, in August 2022, Rockwell Automation released the new Allen-Bradley 42EA RightSight S18 and 42JA VisiSight M20A photoelectric sensors, which are economical and easy-to-apply sensing solutions that offer a wide range of sensing modes and mounting options.
Fiber optical sensors, also known as optical fiber sensors, are employed to sense parameters such as pressure, vibration, temperature, displacement, rotation, and concentration of chemical species. Extrinsic type of fiber optical sensor is used to measure vibrations. The fiber optical sensing technology is based on white light polarization interferometry (WLPI). The technology offers higher benefits over the fiber optics technology. Fiber optical sensors offer various advantages such as easy deployment and adoption, increased stability, enhanced safety for data transmission, high reliability, low maintenance, light weight, small size, and resistance to high voltages. Therefore, demand for fiber optical sensors is expected to increase significantly in the near future. Manufacturers are focusing on research and development activities to come up with innovative products in fiber optics. For instance, in February 2021, Scientific Bioprocessing, Inc. (SBI), a subsidiary of publicly-owned Scientific Industries, Inc., launched Intelligent Dynamic (ID) Fiber Optic Kit, which is an all-in-one pH and dissolved oxygen sensing solution that delivers real-time, non-invasive, and highly adaptable data from the smallest cell culture systems.
North America is expected to hold prominent share of the global optical sensor market during the forecast period due to the increase in demand for optical sensors in medical imaging, material processing, indoor & outdoor lighting, dynamic & static signaling, testing & measurement, and authentication & visualization applications in the region. Rise in urbanization & digitalization; increase in penetration of the Internet of Things (IoT); running investment in 4G & 5G communication & advanced factory automation; and dependence of research labs and businesses on fiber optic communication for simulation and modeling in diverse applications are some of the other factors boosting the optical sensor market in North America.
The optical sensor market in Asia Pacific and Europe is expected to grow at a significant pace during the forecast period due to the rise in adoption for online education, remote working, cloud technology, big data, artificial intelligence-driven mechanisms, and enterprise-grade networks in the region. Germany, Spain, Italy, the U.K., China, India, South Korea, Singapore, and Japan are the leading countries of the market in Europe and Asia Pacific.
The global optical sensor is fragmented, with the presence of large numbers of players. Market players are adopting various organic and inorganic strategies such as collaborations, partnerships, product launches, and mergers & acquisitions to enhance their market share. Top optical sensor manufacturers include ams-OSRAM AG, Analog Devices, Inc., Hamamatsu Photonics K.K., KEYENCE CORPORATION, OMRON Corporation, Opsens Solutions, Panasonic Corporation, Renesas Electronics Corporation, and ROHM CO., LTD.
Key players have been profiled in the optical sensor market report based on parameters such as company overview, financial overview, business strategies, product portfolio, business segments, and recent developments.
|
Attribute |
Detail |
|
Market Size Value in 2021 |
US$ 24.2 Bn |
|
Market Forecast Value in 2031 |
US$ 53.2 Bn |
|
Growth Rate (CAGR) |
8.3% |
|
Forecast Period |
2022–2031 |
|
Historical Data Available for |
2017–2020 |
|
Quantitative Units |
US$ Bn for Value & Million Units for Volume |
|
Market Analysis |
It includes cross segment analysis at global as well as regional level. Furthermore, qualitative analysis includes drivers, restraints, opportunities, key trends, Porter’s Five Forces analysis, value chain analysis, and key trend analysis. |
|
Competition Landscape |
|
|
Format |
Electronic (PDF) + Excel |
|
Market Segmentation |
|
|
Regions Covered |
|
|
Countries Covered |
|
|
Companies Profiled |
|
|
Customization Scope |
Available upon request |
|
Pricing |
Available upon request |
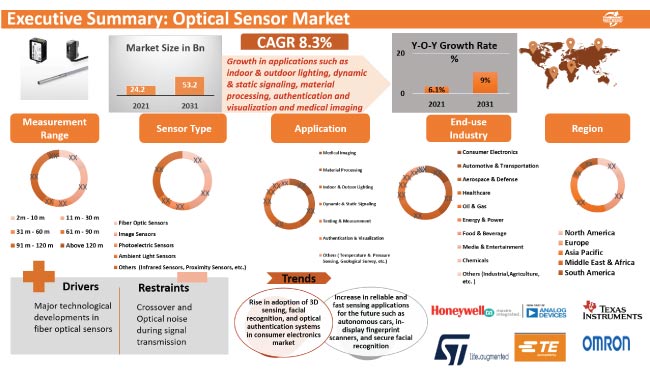
The optical sensor market stood at US$ 24.2 Bn in 2021.
The optical sensor is expected to grow at a CAGR of 8.3% from 2022 to 2031.
The optical sensor market is likely to reach US$ 53.2 Bn by 2031.
Rise in adoption of 3D sensing, facial recognition, and optical authentication systems in consumer electronics market; and increase in reliable and fast sensing applications for the future such as autonomous cars, in-display fingerprint scanners, and secure facial recognition.
Europe is a more lucrative region of the global optical sensor market.
ams-OSRAM AG, Analog Devices, Inc., Hamamatsu Photonics K.K., Honeywell, KEYENCE CORPORATION, OMRON Corporation, Opsens Solutions, and Panasonic Corporation.
1. Preface
1.1. Market Introduction
1.2. Market and Segments Definition
1.3. Market Taxonomy
1.4. Research Methodology
1.5. Assumption and Acronyms
2. Executive Summary
2.1. Global Optical Sensor Market Overview
2.2. Regional Outline
2.3. Industry Outline
2.4. Market Dynamics Snapshot
2.5. Competition Blueprint
3. Market Dynamics
3.1. Macroeconomic Factors
3.2. Drivers
3.3. Restraints
3.4. Opportunities
3.5. Key Trends
3.6. Regulatory Framework
4. Associated Industry and Key Indicator Assessment
4.1. Parent Industry Overview – Global Optical Sensing Industry Overview
4.2. Supply Chain Analysis
4.3. Pricing Analysis
4.4. Sensor Type Roadmap Analysis
4.5. Industry SWOT Analysis
4.6. Porter Five Forces Analysis
4.7. Covid-19 Impact and Recovery Analysis
5. Global Optical Sensor Market Analysis By Measurement Range
5.1. Optical Sensor Market Size (US$ Mn) and Volume (Million Units) Analysis & Forecast, By Measurement Range, 2017–2031
5.1.1. 2m - 10 m
5.1.2. 11 m - 30 m
5.1.3. 31 m - 60 m
5.1.4. 61 m -90 m
5.1.5. 91 m -120 m
5.1.6. Above 120 m
5.2. Market Attractiveness Analysis, By Measurement Range
6. Global Optical Sensor Market Analysis By Sensor Type
6.1. Optical Sensor Market Size (US$ Mn) Analysis & Forecast, By Sensor Type, 2017–2031
6.1.1. Fiber Optic Sensors
6.1.2. Image Sensors
6.1.2.1. CMOS
6.1.2.2. CCD
6.1.3. Photoelectric Sensors
6.1.4. Ambient Light Sensors
6.1.5. Others
6.2. Market Attractiveness Analysis, By Sensor Type
7. Global Optical Sensor Market Analysis By Application
7.1. Optical Sensor Market Size (US$ Mn) Analysis & Forecast, By Application, 2017–2031
7.1.1. Medical Imaging
7.1.2. Material Processing
7.1.3. Indoor & Outdoor Lighting
7.1.4. Dynamic & Static Signaling
7.1.5. Testing & Measurement
7.1.6. Authentication & Visualization
7.1.7. Others
7.2. Market Attractiveness Analysis, By Application
8. Global Optical Sensor Market Analysis By End-use Industry
8.1. Optical Sensor Market Size (US$ Mn) Analysis & Forecast, By End-use Industry, 2017–2031
8.1.1. Consumer Electronics
8.1.2. Automotive & Transportation
8.1.3. Aerospace & Defense
8.1.4. Healthcare
8.1.5. Oil & Gas
8.1.6. Energy & Power
8.1.7. Food & Beverage
8.1.8. Media & Entertainment
8.1.9. Chemicals
8.1.10. Others
8.2. Market Attractiveness Analysis, By End-use Industry
9. Global Optical Sensor Market Analysis and Forecast, By Region
9.1. Optical Sensor Market Size (US$ Mn) and Volume (Million Units) Analysis & Forecast, By Region, 2017–2031
9.1.1. North America
9.1.2. Europe
9.1.3. Asia Pacific
9.1.4. Middle East & Africa
9.1.5. South America
9.2. Market Attractiveness Analysis, By Region
10. North America Optical Sensor Market Analysis and Forecast
10.1. Market Snapshot
10.2. Drivers and Restraints: Impact Analysis
10.3. Optical Sensor Market Size (US$ Mn) and Volume (Million Units) Analysis & Forecast, By Measurement Range, 2017–2031
10.3.1. 2m - 10 m
10.3.2. 11 m - 30 m
10.3.3. 31 m - 60 m
10.3.4. 61 m -90 m
10.3.5. 91 m -120 m
10.3.6. Above 120 m
10.4. Optical Sensor Market Size (US$ Mn) Analysis & Forecast, By Sensor Type, 2017–2031
10.4.1. Fiber Optic Sensors
10.4.2. Image Sensors
10.4.2.1. CMOS
10.4.2.2. CCD
10.4.3. Photoelectric Sensors
10.4.4. Ambient Light Sensors
10.4.5. Others
10.5. Optical Sensor Market Size (US$ Mn) Analysis & Forecast, By Application, 2017–2031
10.5.1. Medical Imaging
10.5.2. Material Processing
10.5.3. Indoor & Outdoor Lighting
10.5.4. Dynamic & Static Signaling
10.5.5. Testing & Measurement
10.5.6. Authentication & Visualization
10.5.7. Others
10.6. Optical Sensor Market Size (US$ Mn) Analysis & Forecast, By End-use Industry, 2017–2031
10.6.1. Consumer Electronics
10.6.2. Automotive & Transportation
10.6.3. Aerospace & Defense
10.6.4. Healthcare
10.6.5. Oil & Gas
10.6.6. Energy & Power
10.6.7. Food & Beverage
10.6.8. Media & Entertainment
10.6.9. Chemicals
10.6.10. Others
10.7. Optical Sensor Market Size (US$ Mn) and Volume (Million Units) Analysis & Forecast, By Country and Sub-region, 2017–2031
10.7.1. The U.S.
10.7.2. Canada
10.7.3. Rest of North America
10.8. Market Attractiveness Analysis
10.8.1. By Measurement Range
10.8.2. By Sensor Type
10.8.3. By Application
10.8.4. By End-use Industry
10.8.5. By Country/Sub-region
11. Europe Optical Sensor Market Analysis and Forecast
11.1. Market Snapshot
11.2. Drivers and Restraints: Impact Analysis
11.3. Optical Sensor Market Size (US$ Mn) and Volume (Million Units) Analysis & Forecast, By Measurement Range, 2017–2031
11.3.1. 2m - 10 m
11.3.2. 11 m - 30 m
11.3.3. 31 m - 60 m
11.3.4. 61 m -90 m
11.3.5. 91 m -120 m
11.3.6. Above 120 m
11.4. Optical Sensor Market Size (US$ Mn) Analysis & Forecast, By Sensor Type, 2017–2031
11.4.1. Fiber Optic Sensors
11.4.2. Image Sensors
11.4.2.1. CMOS
11.4.2.2. CCD
11.4.3. Photoelectric Sensors
11.4.4. Ambient Light Sensors
11.4.5. Others
11.5. Optical Sensor Market Size (US$ Mn) Analysis & Forecast, By Application, 2017–2031
11.5.1. Medical Imaging
11.5.2. Material Processing
11.5.3. Indoor & Outdoor Lighting
11.5.4. Dynamic & Static Signaling
11.5.5. Testing & Measurement
11.5.6. Authentication & Visualization
11.5.7. Others
11.6. Optical Sensor Market Size (US$ Mn) Analysis & Forecast, By End-use Industry, 2017–2031
11.6.1. Consumer Electronics
11.6.2. Automotive & Transportation
11.6.3. Aerospace & Defense
11.6.4. Healthcare
11.6.5. Oil & Gas
11.6.6. Energy & Power
11.6.7. Food & Beverage
11.6.8. Media & Entertainment
11.6.9. Chemicals
11.6.10. Others
11.7. Optical Sensor Market Size (US$ Mn) and Volume (Million Units) Analysis & Forecast, By Country and Sub-region, 2017–2031
11.7.1. The U.K.
11.7.2. Germany
11.7.3. France
11.7.4. Rest of Europe
11.8. Market Attractiveness Analysis
11.8.1. By Measurement Range
11.8.2. By Sensor Type
11.8.3. By Application
11.8.4. By End-use Industry
11.8.5. By Country/Sub-region
12. Asia Pacific Optical Sensor Market Analysis and Forecast
12.1. Market Snapshot
12.2. Drivers and Restraints: Impact Analysis
12.3. Optical Sensor Market Size (US$ Mn) and Volume (Million Units) Analysis & Forecast, By Measurement Range, 2017–2031
12.3.1. 2m - 10 m
12.3.2. 11 m - 30 m
12.3.3. 31 m - 60 m
12.3.4. 61 m -90 m
12.3.5. 91 m -120 m
12.3.6. Above 120 m
12.4. Optical Sensor Market Size (US$ Mn) Analysis & Forecast, By Sensor Type, 2017–2031
12.4.1. Fiber Optic Sensors
12.4.2. Image Sensors
12.4.2.1. CMOS
12.4.2.2. CCD
12.4.3. Photoelectric Sensors
12.4.4. Ambient Light Sensors
12.4.5. Others
12.5. Optical Sensor Market Size (US$ Mn) Analysis & Forecast, By Application, 2017–2031
12.5.1. Medical Imaging
12.5.2. Material Processing
12.5.3. Indoor & Outdoor Lighting
12.5.4. Dynamic & Static Signaling
12.5.5. Testing & Measurement
12.5.6. Authentication & Visualization
12.5.7. Others
12.6. Optical Sensor Market Size (US$ Mn) Analysis & Forecast, By End-use Industry, 2017–2031
12.6.1. Consumer Electronics
12.6.2. Automotive & Transportation
12.6.3. Aerospace & Defense
12.6.4. Healthcare
12.6.5. Oil & Gas
12.6.6. Energy & Power
12.6.7. Food & Beverage
12.6.8. Media & Entertainment
12.6.9. Chemicals
12.6.10. Others
12.7. Optical Sensor Market Size (US$ Mn) and Volume (Million Units) Analysis & Forecast, By Country and Sub-region, 2017–2031
12.7.1. China
12.7.2. Japan
12.7.3. India
12.7.4. South Korea
12.7.5. ASEAN
12.7.6. Rest of Asia Pacific
12.8. Market Attractiveness Analysis
12.8.1. By Measurement Range
12.8.2. By Sensor Type
12.8.3. By Application
12.8.4. By End-use Industry
12.8.5. By Country/Sub-region
13. Middle East & Africa Optical Sensor Market Analysis and Forecast
13.1. Market Snapshot
13.2. Drivers and Restraints: Impact Analysis
13.3. Optical Sensor Market Size (US$ Mn) and Volume (Million Units) Analysis & Forecast, By Measurement Range, 2017–2031
13.3.1. 2m - 10 m
13.3.2. 11 m - 30 m
13.3.3. 31 m - 60 m
13.3.4. 61 m -90 m
13.3.5. 91 m -120 m
13.3.6. Above 120 m
13.4. Optical Sensor Market Size (US$ Mn) Analysis & Forecast, By Sensor Type, 2017–2031
13.4.1. Fiber Optic Sensors
13.4.2. Image Sensors
13.4.2.1. CMOS
13.4.2.2. CCD
13.4.3. Photoelectric Sensors
13.4.4. Ambient Light Sensors
13.4.5. Others
13.5. Optical Sensor Market Size (US$ Mn) Analysis & Forecast, By Application, 2017–2031
13.5.1. Medical Imaging
13.5.2. Material Processing
13.5.3. Indoor & Outdoor Lighting
13.5.4. Dynamic & Static Signaling
13.5.5. Testing & Measurement
13.5.6. Authentication & Visualization
13.5.7. Others
13.6. Optical Sensor Market Size (US$ Mn) Analysis & Forecast, By End-use Industry, 2017–2031
13.6.1. Consumer Electronics
13.6.2. Automotive & Transportation
13.6.3. Aerospace & Defense
13.6.4. Healthcare
13.6.5. Oil & Gas
13.6.6. Energy & Power
13.6.7. Food & Beverage
13.6.8. Media & Entertainment
13.6.9. Chemicals
13.6.10. Others
13.7. Optical Sensor Market Size (US$ Mn) and Volume (Million Units) Analysis & Forecast, By Country and Sub-region, 2017–2031
13.7.1. GCC
13.7.2. South Africa
13.7.3. Rest of Middle East & Africa
13.8. Market Attractiveness Analysis
13.8.1. By Measurement Range
13.8.2. By Sensor Type
13.8.3. By Application
13.8.4. By End-use Industry
13.8.5. By Country/Sub-region
14. South America Optical Sensor Market Analysis and Forecast
14.1. Market Snapshot
14.2. Drivers and Restraints: Impact Analysis
14.3. Optical Sensor Market Size (US$ Mn) and Volume (Million Units) Analysis & Forecast, By Measurement Range, 2017–2031
14.3.1. 2m - 10 m
14.3.2. 11 m - 30 m
14.3.3. 31 m - 60 m
14.3.4. 61 m -90 m
14.3.5. 91 m -120 m
14.3.6. Above 120 m
14.4. Optical Sensor Market Size (US$ Mn) Analysis & Forecast, By Sensor Type, 2017–2031
14.4.1. Fiber Optic Sensors
14.4.2. Image Sensors
14.4.2.1. CMOS
14.4.2.2. CCD
14.4.3. Photoelectric Sensors
14.4.4. Ambient Light Sensors
14.4.5. Others
14.5. Optical Sensor Market Size (US$ Mn) Analysis & Forecast, By Application, 2017–2031
14.5.1. Medical Imaging
14.5.2. Material Processing
14.5.3. Indoor & Outdoor Lighting
14.5.4. Dynamic & Static Signaling
14.5.5. Testing & Measurement
14.5.6. Authentication & Visualization
14.5.7. Others
14.6. Optical Sensor Market Size (US$ Mn) Analysis & Forecast, By End-use Industry, 2017–2031
14.6.1. Consumer Electronics
14.6.2. Automotive & Transportation
14.6.3. Aerospace & Defense
14.6.4. Healthcare
14.6.5. Oil & Gas
14.6.6. Energy & Power
14.6.7. Food & Beverage
14.6.8. Media & Entertainment
14.6.9. Chemicals
14.6.10. Others
14.7. Optical Sensor Market Size (US$ Mn) and Volume (Million Units) Analysis & Forecast, By Country and Sub-region, 2017–2031
14.7.1. Brazil
14.7.2. Rest of South America
14.8. Market Attractiveness Analysis
14.8.1. By Measurement Range
14.8.2. By Sensor Type
14.8.3. By Application
14.8.4. By End-use Industry
14.8.5. By Country/Sub-region
15. Competition Assessment
15.1. Global Optical Sensor Market Competition Matrix - a Dashboard View
15.1.1. Global Optical Sensor Market Company Share Analysis, by Value (2021)
15.1.2. Technological Differentiator
16. Company Profiles (Global Manufacturers/Suppliers)
16.1. 3M Company
16.1.1. Overview
16.1.2. Product Portfolio
16.1.3. Sales Footprint
16.1.4. Key Subsidiaries or Distributors
16.1.5. Strategy and Recent Developments
16.1.6. Key Financials
16.2. Amphenol Corporation
16.2.1. Overview
16.2.2. Product Portfolio
16.2.3. Sales Footprint
16.2.4. Key Subsidiaries or Distributors
16.2.5. Strategy and Recent Developments
16.2.6. Key Financials
16.3. BizLink Group
16.3.1. Overview
16.3.2. Product Portfolio
16.3.3. Sales Footprint
16.3.4. Key Subsidiaries or Distributors
16.3.5. Strategy and Recent Developments
16.3.6. Key Financials
16.4. Broadcom Inc.
16.4.1. Overview
16.4.2. Product Portfolio
16.4.3. Sales Footprint
16.4.4. Key Subsidiaries or Distributors
16.4.5. Strategy and Recent Developments
16.4.6. Key Financials
16.5. Cisco Systems, Inc.
16.5.1. Overview
16.5.2. Product Portfolio
16.5.3. Sales Footprint
16.5.4. Key Subsidiaries or Distributors
16.5.5. Strategy and Recent Developments
16.5.6. Key Financials
16.6. Coherent Corp. ((II-VI Incorporated)
16.6.1. Overview
16.6.2. Product Portfolio
16.6.3. Sales Footprint
16.6.4. Key Subsidiaries or Distributors
16.6.5. Strategy and Recent Developments
16.6.6. Key Financials
16.7. Datatronix
16.7.1. Overview
16.7.2. Product Portfolio
16.7.3. Sales Footprint
16.7.4. Key Subsidiaries or Distributors
16.7.5. Strategy and Recent Developments
16.7.6. Key Financials
16.8. Dell Inc
16.8.1. Overview
16.8.2. Product Portfolio
16.8.3. Sales Footprint
16.8.4. Key Subsidiaries or Distributors
16.8.5. Strategy and Recent Developments
16.8.6. Key Financials
16.9. Eaton Corporation plc
16.9.1. Overview
16.9.2. Product Portfolio
16.9.3. Sales Footprint
16.9.4. Key Subsidiaries or Distributors
16.9.5. Strategy and Recent Developments
16.9.6. Key Financials
16.10. FS.COM Inc.
16.10.1. Overview
16.10.2. Product Portfolio
16.10.3. Sales Footprint
16.10.4. Key Subsidiaries or Distributors
16.10.5. Strategy and Recent Developments
16.10.6. Key Financials
16.11. Hitachi Cable, Ltd
16.11.1. Overview
16.11.2. Product Portfolio
16.11.3. Sales Footprint
16.11.4. Key Subsidiaries or Distributors
16.11.5. Strategy and Recent Developments
16.11.6. Key Financials
16.12. Molex, LLC
16.12.1. Overview
16.12.2. Product Portfolio
16.12.3. Sales Footprint
16.12.4. Key Subsidiaries or Distributors
16.12.5. Strategy and Recent Developments
16.12.6. Key Financials
16.13. NVIDIA Corporation
16.13.1. Overview
16.13.2. Product Portfolio
16.13.3. Sales Footprint
16.13.4. Key Subsidiaries or Distributors
16.13.5. Strategy and Recent Developments
16.13.6. Key Financials
16.14. Samtec
16.14.1. Overview
16.14.2. Product Portfolio
16.14.3. Sales Footprint
16.14.4. Key Subsidiaries or Distributors
16.14.5. Strategy and Recent Developments
16.14.6. Key Financials
16.15. Siemon Company
16.15.1. Overview
16.15.2. Product Portfolio
16.15.3. Sales Footprint
16.15.4. Key Subsidiaries or Distributors
16.15.5. Strategy and Recent Developments
16.15.6. Key Financials
16.16. Sumitomo Electric Industries, Ltd (Sumitomo Electric Group)
16.16.1. Overview
16.16.2. Product Portfolio
16.16.3. Sales Footprint
16.16.4. Key Subsidiaries or Distributors
16.16.5. Strategy and Recent Developments
16.16.6. Key Financials
16.17. T&S Communication Co, Ltd.
16.17.1. Overview
16.17.2. Product Portfolio
16.17.3. Sales Footprint
16.17.4. Key Subsidiaries or Distributors
16.17.5. Strategy and Recent Developments
16.17.6. Key Financials
16.18. Tyco Electronics Corporation (TE Connectivity Ltd)
16.18.1. Overview
16.18.2. Product Portfolio
16.18.3. Sales Footprint
16.18.4. Key Subsidiaries or Distributors
16.18.5. Strategy and Recent Developments
16.18.6. Key Financials
17. Recommendation
17.1. Opportunity Assessment
17.1.1. By Bit Rate
17.1.2. By Form Factor
17.1.3. By Application
17.1.4. By End-use Industry
17.1.5. By Country/Sub-region
List of Tables
Table 01: Global Optical Sensor Market Size & Forecast, by Measurement Range, Value (US$ Mn), 2017–2031
Table 02: Global Optical Sensor Market Size & Forecast, by Measurement Range, Volume (Million Units), 2017–2031
Table 03: Global Optical Sensor Market Size & Forecast, by Sensor Type (US$ Mn), 2017–2031
Table 04: Global Optical Sensor Market Size & Forecast, by Application, Value (US$ Mn), 2017–2031
Table 05: Global Optical Sensor Market Size & Forecast, by End-use Industry, Value (US$ Mn), 2017–2031
Table 06: Global Optical Sensor Market Size & Forecast, by Region, Value (US$ Mn), 2017–2031
Table 07: North America Optical Sensor Market Size & Forecast, by Measurement Range, Volume (Million Units), 2017–2031
Table 08: North America Optical Sensor Market Size & Forecast, by Sensor Type (US$ Mn), 2017–2031
Table 09: North America Optical Sensor Market Size & Forecast, by Application, Value (US$ Mn), 2017–2031
Table 10: North America Optical Sensor Market Size & Forecast, by End-use Industry, Value (US$ Mn), 2017–2031
Table 11: North America Optical Sensor Market Size & Forecast, by Country, Value (USD Million), 2017–2031
Table 12: Europe Optical Sensor Market Size & Forecast, by Measurement Range, Value (US$ Mn), 2017–2031
Table 13: Europe Optical Sensor Market Size & Forecast, by Measurement Range, Volume (Million Units), 2017–2031
Table 14: Europe Optical Sensor Market Size & Forecast, by Sensor Type (US$ Mn), 2017–2031
Table 15: Europe Optical Sensor Market Size & Forecast, by Application, Value (US$ Mn), 2017–2031
Table 16: Europe Optical Sensor Market Size & Forecast, by End-use Industry, Value (US$ Mn), 2017–2031
Table 17: Europe Optical Sensor Market Size & Forecast, by Country & Sub-region, Value (US$ Mn), 2017–2031
Table 18: Asia Pacific Optical Sensor Market Size & Forecast, by Measurement Range, Value (US$ Mn), 2017–2031
Table 19: Asia Pacific Optical Sensor Market Size & Forecast, by Measurement Range, Volume (Million Units), 2017–2031
Table 20: Asia Pacific Optical Sensor Market Size & Forecast, by Sensor Type (US$ Mn), 2017–2031
Table 21: Asia Pacific Optical Sensor Market Size & Forecast, by Application, Value (US$ Mn), 2017–2031
Table 22: Asia Pacific Optical Sensor Market Size & Forecast, by End-use Industry, Value (US$ Mn), 2017–2031
Table 23: Asia Pacific Optical Sensor Market Size & Forecast, by Country & Sub-region, Value (US$ Mn), 2017–2031
Table 24: Middle East & Africa Optical Sensor Market Size & Forecast, by Measurement Range, Value (US$ Mn), 2017–2031
Table 25: Middle East & Africa Optical Sensor Market Size & Forecast, by Measurement Range, Volume (Million Units), 2017–2031
Table 26: Middle East & Africa Optical Sensor Market Size & Forecast, by Sensor Type (US$ Mn), 2017–2031
Table 27: Middle East & Africa Optical Sensor Market Size & Forecast, by Application, Value (US$ Mn), 2017–2031
Table 28: Middle East & Africa Optical Sensor Market Size & Forecast, by End-use Industry, Value (US$ Mn), 2017–2031
Table 29: Middle East & Africa (MEA) Optical Sensor Market Size & Forecast, by Country & Sub-region, Value (US$ Mn), 2017–2031
Table 30: South America Optical Sensor Market Size & Forecast, by Measurement Range, Value (US$ Mn), 2017–2031
Table 31: South America Optical Sensor Market Size & Forecast, by Measurement Range, Volume (Million Units), 2017–2031
Table 32: South America Optical Sensor Market Size & Forecast, by Sensor Type (US$ Mn), 2017–2031
Table 33: South America Optical Sensor Market Size & Forecast, by Application, Value (US$ Mn), 2017–2031
Table 34: South America Optical Sensor Market Size & Forecast, by End-use Industry, Value (US$ Mn), 2017–2031
Table 35: South America Optical Sensor Market Size & Forecast, by Country & Sub-region, Value (US$ Mn), 2017–2031
List of Figures
Figure 01: Global Optical Sensor Price Trend Analysis (Average Price, US$) (Million Dollars)
Figure 02: Global Optical Sensor Market, Y-O-Y Growth 2017–2031
Figure 03: Global Optical Sensor Market, Value (US$ Mn), 2017–2031
Figure 04: Global Optical Sensor Market, Volume (Million Units), 2017–2031
Figure 05: Global Optical Sensor Market Projections, by Measurement Range, Value (US$ Mn), 2017–2031
Figure 06: Global Optical Sensor Market, Incremental Opportunity, by Measurement Range, Value (US$ Mn), 2022 – 2031
Figure 07: Global Optical Sensor Market Share, by Measurement Range, Value (US$ Mn), 2022 – 2031
Figure 08: Global Optical Sensor Market Projections, by Sensor Type, Value (US$ Mn), 2017–2031
Figure 09: Global Optical Sensor Market, Incremental Opportunity, by Sensor Type, Value (US$ Mn), 2022 – 2031
Figure 10: Global Optical Sensor Market Share, by Sensor Type, Value (US$ Mn), 2022 – 2031
Figure 11: Global Optical Sensor Market Size & Forecast, by Application, Revenue (US$ Mn), 2017–2031
Figure 12: Global Optical Sensor Market Attractiveness, by Application, Value (US$ Mn), 2022 – 2031
Figure 13: Global Optical Sensor Market Size & Forecast, by Application, Value (US$ Mn), 2022 – 2031
Figure 14: Global Optical Sensor Market Size & Forecast, by End-use Industry, Revenue (US$ Mn), 2017–2031
Figure 15: Global Optical Sensor Market Attractiveness, by End-use Industry, Value (US$ Mn), 2022 – 2031
Figure 16: Global Optical Sensor Market Share Analysis, by End-use Industry, 2021 and 2031
Figure 17: Global Optical Sensor Market Size & Forecast, by Region, Revenue (US$ Mn), 2017–2031
Figure 18: Global Optical Sensor Market Attractiveness, by Region, Value (US$ Mn), 2022 – 2031
Figure 19: Global Optical Sensor Market Size & Forecast, by Region, Value (US$ Mn), 2022 – 2031
Figure 20: North America Optical Sensor Market, Y-O-Y Growth, 2017–2031
Figure 21: North America Optical Sensor Market, Value (US$ Mn), 2017–2031
Figure 22: North America Optical Sensor Market, Volume (Million Units), 2017–2031
Figure 23: North America Optical Sensor Market, Price Trend, 2017–2031
Figure 24: North America Optical Sensor Market Projections, by Measurement Range, Value (US$ Mn), 2017–2031
Figure 25: North America Optical Sensor Market, Incremental Opportunity, by Measurement Range, Value (US$ Mn), 2022 – 2031
Figure 26: North America Optical Sensor Market Share, by Measurement Range, Value (US$ Mn), 2022 – 2031
Figure 27: North America Optical Sensor Market Projections, by Sensor Type, Value (US$ Mn), 2017–2031
Figure 28: North America Optical Sensor Market, Incremental Opportunity, by Sensor Type, Value (US$ Mn), 2022 – 2031
Figure 29: North America Optical Sensor Market Share, by Sensor Type, Value (US$ Mn), 2022 – 2031
Figure 30: North America Optical Sensor Market Size & Forecast, by Application, Revenue (US$ Mn), 2017–2031
Figure 31: North America Optical Sensor Market Attractiveness, by Application, Value (US$ Mn), 2022 – 2031
Figure 32: North America Optical Sensor Market Size & Forecast, by Application, Value (US$ Mn), 2022 – 2031
Figure 33: North America Optical Sensor Market Size & Forecast, by End-use Industry, Revenue (US$ Mn), 2017–2031
Figure 34: North America Optical Sensor Market Attractiveness, by End-use Industry, Value (US$ Mn), 2022 – 2031
Figure 35: North America Optical Sensor Market Share Analysis, by End-use Industry, 2021 and 2031
Figure 36: North America Optical Sensor Market Size & Forecast, by Country, Revenue (US$ Mn), 2017–2031
Figure 37: North America Optical Sensor Market Attractiveness, by Country, Value (US$ Mn), 2022 – 2031
Figure 38: North America Optical Sensor Market Size & Forecast, by Country, Value (US$ Mn), 2022 – 2031
Figure 39: Europe Optical Sensor Market, Y-O-Y Growth, 2017–2031
Figure 40: Europe Optical Sensor Market, Value (US$ Mn), 2017–2031
Figure 41: Europe Optical Sensor Market, Volume (Million Units), 2017–2031
Figure 42: Europe Optical Sensor Market, Price Trend
Figure 43: Europe Optical Sensor Market Projections, by Measurement Range, Value (US$ Mn), 2017–2031
Figure 44: Europe Optical Sensor Market, Incremental Opportunity, by Measurement Range, Value (US$ Mn), 2022 – 2031
Figure 45: Europe Optical Sensor Market Share, by Measurement Range, Value (US$ Mn), 2022 – 2031
Figure 46: Europe Optical Sensor Market Projections, by Sensor Type, Value (US$ Mn), 2017–2031
Figure 47: Europe Optical Sensor Market, Incremental Opportunity, by Sensor Type, Value (US$ Mn), 2022 – 2031
Figure 48: Europe Optical Sensor Market Share, by Sensor Type, Value (US$ Mn), 2022 – 2031
Figure 49: Europe Optical Sensor Market Size & Forecast, by Application, Revenue (US$ Mn), 2017–2031
Figure 50: Europe Optical Sensor Market Attractiveness, by Application, Value (US$ Mn), 2022 – 2031
Figure 51: Europe Optical Sensor Market Size & Forecast, by Application, Value (US$ Mn), 2022 – 2031
Figure 52: Europe Optical Sensor Market Size & Forecast, by End-use Industry, Revenue (US$ Mn), 2017–2031
Figure 53: Europe Optical Sensor Market Attractiveness, by End-use Industry, Value (US$ Mn), 2022 – 2031
Figure 54: Europe Optical Sensor Market Share Analysis, by End-use Industry, 2021 and 2031
Figure 55: Europe Optical Sensor Market Size & Forecast, by Country & Sub-region, Revenue (US$ Mn), 2017–2031
Figure 56: Europe Optical Sensor Market Attractiveness, by Country & Sub-region, Value (US$ Mn), 2022 – 2031
Figure 57: Europe Optical Sensor Market Size & Forecast, by Country & Sub-region, Value (US$ Mn), 2022 – 2031
Figure 58: Asia Pacific Optical Sensor Market, Y-O-Y Growth, 2017–2031
Figure 59: Asia Pacific Optical Sensor Market, Value (US$ Mn), 2017–2031
Figure 60: Asia Pacific Optical Sensor Market, Volume (Million Units), 2017–2031
Figure 61: Asia Pacific Optical Sensor Market, Price Trend
Figure 62: Asia Pacific Optical Sensor Market Projections, by Measurement Range, Value (US$ Mn), 2017–2031
Figure 63: Asia Pacific Optical Sensor Market, Incremental Opportunity, by Measurement Range, Value (US$ Mn), 2022 – 2031
Figure 64: Asia Pacific Optical Sensor Market Share, by Measurement Range, Value (US$ Mn), 2022 – 2031
Figure 65: Asia Pacific Optical Sensor Market Projections, by Sensor Type, Value (US$ Mn), 2017–2031
Figure 66: Asia Pacific Optical Sensor Market, Incremental Opportunity, by Sensor Type, Value (US$ Mn), 2022 – 2031
Figure 67: Asia Pacific Optical Sensor Market Share, by Sensor Type, Value (US$ Mn), 2022 – 2031
Figure 68: Asia Pacific Optical Sensor Market Size & Forecast, by Application, Revenue (US$ Mn), 2017–2031
Figure 69: Asia Pacific Optical Sensor Market Attractiveness, by Application, Value (US$ Mn), 2022 – 2031
Figure 70: Asia Pacific Optical Sensor Market Size & Forecast, by Application, Value (US$ Mn), 2022 – 2031
Figure 71: Asia Pacific Optical Sensor Market Size & Forecast, by End-use Industry, Revenue (US$ Mn), 2017–2031
Figure 72: Asia Pacific Optical Sensor Market Attractiveness, by End-use Industry, Value (US$ Mn), 2022 – 2031
Figure 73: Asia Pacific Optical Sensor Market Share Analysis, by End-use Industry, 2021 and 2031
Figure 74: Asia Pacific Optical Sensor Market Size & Forecast, by Country & Sub-region, Revenue (US$ Mn), 2017–2031
Figure 75: Asia Pacific Optical Sensor Market Attractiveness, by Country & Sub-region, Value (US$ Mn), 2022 – 2031
Figure 76: Asia Pacific Optical Sensor Market Size & Forecast, by Country & Sub-region, Value (US$ Mn), 2022 – 2031
Figure 77: Middle East & Africa Optical Sensor Market, Y-O-Y Growth, 2017–2031
Figure 78: Middle East & Africa Optical Sensor Market, Value (US$ Mn), 2017–2031
Figure 79: Middle East & Africa Optical Sensor Market, Volume (Million Units), 2017–2031
Figure 80: Middle East & Africa Optical Sensor Market, Price Trend
Figure 81: Middle East & Africa Optical Sensor Market Projections, by Measurement Range, Value (US$ Mn), 2017–2031
Figure 82: Middle East & Africa Optical Sensor Market, Incremental Opportunity, by Measurement Range, Value (US$ Mn), 2022 – 2031
Figure 83: Middle East & Africa Optical Sensor Market Share, by Measurement Range, Value (US$ Mn), 2022 – 2031
Figure 84: Middle East & Africa Optical Sensor Market Projections, by Sensor Type, Value (US$ Mn), 2017–2031
Figure 85: Middle East & Africa Optical Sensor Market, Incremental Opportunity, by Sensor Type, Value (US$ Mn), 2022 – 2031
Figure 86: Middle East & Africa Optical Sensor Market Share, by Sensor Type, Value (US$ Mn), 2022 – 2031
Figure 87: Middle East & Africa Optical Sensor Market Size & Forecast, by Application, Revenue (US$ Mn), 2017–2031
Figure 88: Middle East & Africa Optical Sensor Market Attractiveness, by Application, Value (US$ Mn), 2022 – 2031
Figure 89: Middle East & Africa Optical Sensor Market Size & Forecast, by Application, Value (US$ Mn), 2022 – 2031
Figure 90: Middle East & Africa Optical Sensor Market Size & Forecast, by End-use Industry, Revenue (US$ Mn), 2017–2031
Figure 91: Middle East & Africa Optical Sensor Market Attractiveness, by End-use Industry, Value (US$ Mn), 2022 – 2031
Figure 92: Middle East & Africa Optical Sensor Market Share Analysis, by End-use Industry, 2021 and 2031
Figure 93: Middle East & Africa (MEA) Optical Sensor Market Size & Forecast, by Country & Sub-region, Revenue (US$ Mn), 2017–2031
Figure 94: Middle East & Africa (MEA)Optical Sensor Market Attractiveness, by Country & Sub-region, Value (US$ Mn), 2022 – 2031
Figure 95: Middle East & Africa (MEA) Optical Sensor Market Size & Forecast, by Country & Sub-region, Value (US$ Mn), 2022 – 2031
Figure 96: South America Optical Sensor Market, Y-O-Y Growth, 2017–2031
Figure 97: South America Optical Sensor Market, Value (US$ Mn), 2017–2031
Figure 98: South America Optical Sensor Market, Volume (Million Units), 2017–2031
Figure 99: South America Optical Sensor Market, Price Trend
Figure 100: South America Optical Sensor Market Projections, by Measurement Range, Value (US$ Mn), 2017–2031
Figure 101: South America Optical Sensor Market, Incremental Opportunity, by Measurement Range, Value (US$ Mn), 2022 – 2031
Figure 102: South America Optical Sensor Market Share, by Measurement Range, Value (US$ Mn), 2022 – 2031
Figure 103: South America Optical Sensor Market Projections, by Sensor Type, Value (US$ Mn), 2017–2031
Figure 104: South America Optical Sensor Market, Incremental Opportunity, by Sensor Type, Value (US$ Mn), 2022 – 2031
Figure 105: South America Optical Sensor Market Share, by Sensor Type, Value (US$ Mn), 2022 – 2031
Figure 106: South America Optical Sensor Market Size & Forecast, by Application, Revenue (US$ Mn), 2017–2031
Figure 107: South America Optical Sensor Market Attractiveness, by Application, Value (US$ Mn), 2022 – 2031
Figure 108: South America Optical Sensor Market Size & Forecast, by Application, Value (US$ Mn), 2022 – 2031
Figure 109: South America Optical Sensor Market Size & Forecast, by End-use Industry, Revenue (US$ Mn), 2017–2031
Figure 110: South America Optical Sensor Market Attractiveness, by End-use Industry, Value (US$ Mn), 2022 – 2031
Figure 111: South America Optical Sensor Market Share Analysis, by End-use Industry, 2021 and 2031
Figure 112: South America Optical Sensor Market Size & Forecast, by Country & Sub-region, Revenue (US$ Mn), 2017–2031
Figure 113: South America Optical Sensor Market Attractiveness, by Country & Sub-region, Value (US$ Mn), 2022 – 2031
Figure 114: South America Optical Sensor Market Size & Forecast, by Country & Sub-region, Value (US$ Mn), 2022 – 2031
Copyright © Transparency Market Research, Inc. All Rights reserved
Trust Online

Optical Sensor Market