
Reports
Reports
The energy sector around the world is witnessing a significant transformation due to advancements in technology, evolving regulations, and shift toward sustainability. The oil & gas sector in particular is also undergoing notable changes in terms of how onshore as well as offshore applications are carried out. The need to modernize cable systems and communication infrastructure in the oil & gas sector has played an important role in inflating the demand for oil & gas downhole cables in recent years. Oil & gas companies are continually finding new ways to smoothen drilling, communications, and other applications. Companies in the oil & gas sector are increasingly leveraging automation/control architecture, IPTV/CCTV/CATV networks, and other advanced systems for an array of applications.
For several decades in the past, the oil & gas industry is finding new solutions that withstand hostile conditions and provide an efficient end-to-end communication. Stakeholders in the oil & gas downhole cables market are primarily focusing on improving quality, reliability, and data integrity of their products to meet the requirement of end users. In addition, participants in the oil & gas downhole cables market are also inclined toward reducing the weight and improving the overall flexibility of their cables. The significant growth in the production of unconventional oil & gas, discovery of new oil & gas fields, and advancements in technology are some of the major factors that are expected to drive the global oil & gas downhole cables market past ~US$ 2.1 Bn mark by the end of 2027.
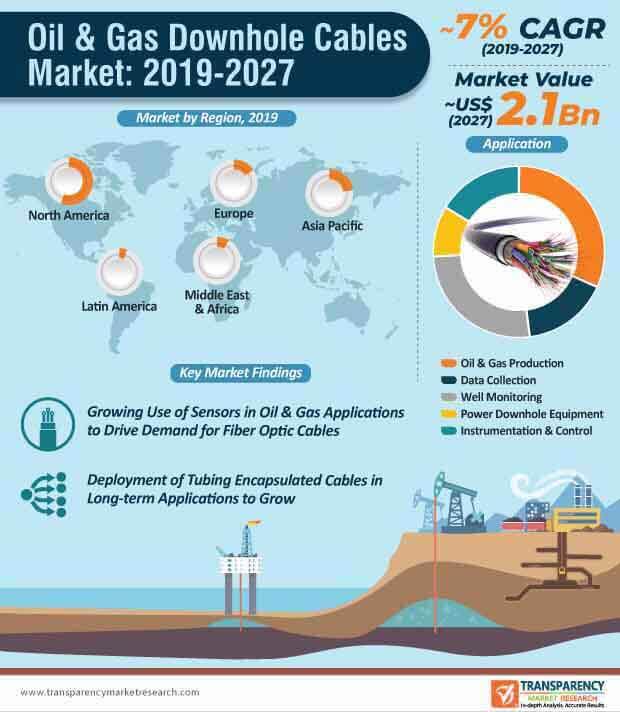
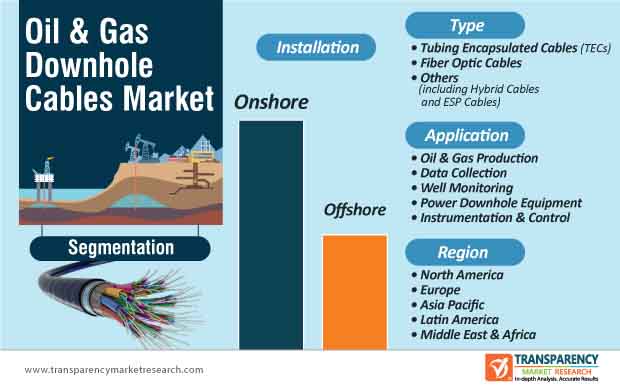
The demand for tubing encapsulated cables is projected to remain higher than that of fiber optic cables during the forecast period. Tubing encapsulated cables are extensively being used across the global oil & gas sector worldwide for a range of applications, including monitoring the pressure, temperature, and multiple other parameters in oil wells. In addition, tubing encapsulated cables are primarily deployed in long-term applications wherein durability is critical. In the current scenario, tubing encapsulated cables made from polypropylene have gained a significant amount of popularity due to the exceptional survivability of the cable. Stakeholders in the oil & gas downhole cables market are more inclined toward the production of round encapsulated cables in comparison to the square counterpart to reduce weight and wastage of raw materials. Participants in the oil & gas downhole cables market are also expected to focus on an array of other parameters, including crush strength, dynamic friction, cross-sectional twisting, and deployment & retrieval, among others.
While the demand for tubing encapsulated cables is set to witness healthy growth during the forecast period, the demand for fiber optic cables is set to grow at a faster pace. Deployment of fiber optic cables across the oil & gas industry has gained significant momentum in the past few years and the trend is set to continue over the course of the forecast period. Stakeholders in the current market landscape are increasingly offering customized fiber optic cables to fulfill specific applications of end users. The deployment of fiber optic cables is witnessing a considerable surge, particularly for application in hostile environmental and working conditions.
Moreover, oil & gas companies are inclining toward the use of fiber optic cables in oil wells and pipelines for various applications, including temperature sensing and strain sensing. Stakeholders are also focusing on improving the physical and functional aspects of their products for deployment in corrosive, high pressure, high-temperature environments. The ascending demand for sensors in the oil & gas industry has played an important role in increasing the demand for oil & gas downhole cables such as fiber optic cables. The different types of sensors, including distributed strain sensors, distributed acoustic sensors, distributed pressure sensors, distributed temperature sensors, and ocean bottom seismic make use of fiber optic cables. In addition, increasing number of oil & gas companies are inclined toward leveraging the benefits of optic installation to enhance their operational performance and accuracy.
Analysts’ Viewpoint
The global oil & gas downhole cables market is expected to grow at a CAGR of ~7% during the forecast period. The booming oil & gas sector, discovery of new oil & gas wells, and rise in the overall production of oil & gas are some of the leading factors that are anticipated to propel the growth of the oil & gas downhole cables market. In addition, the growing usage of cables in the oil & gas sector, which require high-quality, durable, and high-performing cables will further influence the demand for oil & gas downhole cables during the forecast period. Moreover, advancements in sensor technology have opened up new avenues for stakeholders in the oil & gas downhole cables market landscape due to which, the demand for fiber optic cables will witness healthy growth.
Oil & Gas Downhole Cables Market: Overview
Rise in Unconventional Oil and Gas Production to Drive Oil & Gas Downhole Cables Market
Volatility in Prices of Crude Oil Likely to Hamper Oil & Gas Downhole Cables Market
Rise in Deep-water and Ultra-deep-water Activities across Globe to Provide Opportunities to Oil & Gas Downhole Cables Market
Recent Developments, Expansions, Acquisitions, and New Contracts in Oil & Gas Downhole Cables Market
North America to be a Highly Lucrative Region of Oil & Gas Downhole Cables Market
Oil & Gas Downhole Cables Market is Highly Competitive
Oil & Gas Downhole Cables Market is expected to reach US$ 2.1 Bn By 2027
Oil & Gas Downhole Cables Market is estimated to rise at a CAGR of 7% during forecast period
Increase in discovery of oil and gas fields/wells/blocks is boosting the global oil & gas downhole cables market
North America is more attractive region for vendors in the Oil & Gas Downhole Cables Market
Prominent players operating in the global oil & gas downhole cables market include Prysmian Group, ElandCables, Nexans Group, NKT A/S, ABB Ltd., Marmon Group, GalaxyWire.com, W. L. Gore & Associates, Inc., Belden Inc., LS Cable & System Ltd., AFL, ZTT, Tratos, and TEXCAN Division of Sonepar Canada Inc.
1. Preface
1.1. Report Scope and Market Segmentation
1.2. Research Highlights
2. Assumptions and Research Methodology
2.1. Assumptions and Acronyms Used
2.2. Research Methodology
3. Executive Summary: Global Oil & Gas Downhole Cables Market
3.1. Market Snapshot
3.2. Top Three Trends
4. Market Overview
4.1. Product Overview
4.2. Key Market Developments
4.3. Market Indicators
5. Market Dynamics
5.1. Drivers and Restraints Snapshot Analysis
5.1.1.1. Drivers
5.1.1.2. Restraints
5.1.1.3. Opportunities
5.2. Porter’s Five Forces Analysis
5.2.1. Threat of Substitutes
5.2.2. Bargaining Power of Buyers
5.2.3. Bargaining Power of Suppliers
5.2.4. Threat of New Entrants
5.2.5. Degree of Competition
5.3. Regulatory Scenario
5.4. Value Chain Analysis
5.5. Global Oil & Gas Downhole Cables Market: Pricing, by Region, 2018
6. Global Oil & Gas Downhole Cables Market Volume (Kilometers) and Value (US$ Mn) Analysis, by Type
6.1. Key Findings and Introduction
6.2. Global Oil & Gas Downhole Cables Market Volume (Kilometers) and Value (US$ Mn) Forecast, by Type, 2018–2027
6.2.1. Global Oil & Gas Downhole Cables Market Volume (Kilometers) and Value (US$ Mn) Forecast, by Tubing Encapsulated Cables (TECs), 2018–2027
6.2.2. Global Oil & Gas Downhole Cables Market Volume (Kilometers) and Value (US$ Mn) Forecast, by Fiber Optic Cables, 2018–2027
6.2.3. Global Oil & Gas Downhole Cables Market Volume (Kilometers) and Value (US$ Mn) Forecast, by Others, 2018–2027
6.3. Global Oil & Gas Downhole Cables Market Attractiveness Analysis, by Type
7. Global Oil & Gas Downhole Cables Market Volume (Kilometers) and Value (US$ Mn) Analysis, by Installation
7.1. Key Findings and Introduction
7.2. Global Oil & Gas Downhole Cables Market Volume (Kilometers) and Value (US$ Mn) Forecast, by Installation, 2018–2027
7.2.1. Global Oil & Gas Downhole Cables Market Volume (Kilometers) and Value (US$ Mn) Forecast, by Onshore, 2018–2027
7.2.2. Global Oil & Gas Downhole Cables Market Volume (Kilometers) and Value (US$ Mn) Forecast, by Offshore, 2018–2027
7.3. Global Oil & Gas Downhole Cables Market Attractiveness Analysis, by Installation
8. Global Oil & Gas Downhole Cables Market Volume (Kilometers) and Value (US$ Mn) Analysis, by Application
8.1. Key Findings and Introduction
8.2. Global Oil & Gas Downhole Cables Market Volume (Kilometers) and Value (US$ Mn) Forecast, by Application, 2018–2027
8.2.1. Global Oil & Gas Downhole Cables Market Volume (Kilometers) and Value (US$ Mn) Forecast, by Oil & Gas Production, 2018–2027
8.2.2. Global Oil & Gas Downhole Cables Market Volume (Kilometers) and Value (US$ Mn) Forecast, by Data Collection, 2018–2027
8.2.3. Global Oil & Gas Downhole Cables Market Volume (Kilometers) and Value (US$ Mn) Forecast, by Well Monitoring, 2018–2027
8.2.4. Global Oil & Gas Downhole Cables Market Volume (Kilometers) and Value (US$ Mn) Forecast, by Power Downhole Equipment, 2018–2027
8.2.5. Global Oil & Gas Downhole Cables Market Volume (Kilometers) and Value (US$ Mn) Forecast, by Instrumentation & Control, 2018–2027
8.3. Global Oil & Gas Downhole Cables Market Attractiveness Analysis, by Application
9. Global Oil & Gas Downhole Cables Market Analysis, by Region
9.1. Key Findings
9.2. Global Oil & Gas Downhole Cables Market Volume (Kilometers) and Value (US$ Mn) Forecast, by Region
9.2.1. North America
9.2.2. Europe
9.2.3. Asia Pacific
9.2.4. Latin America
9.2.5. Middle East & Africa
9.3. Global Oil & Gas Downhole Cables Market Attractiveness Analysis, by Region
10. North America Oil & Gas Downhole Cables Market Overview
10.1. Key Findings
10.2. Key Drivers of North America Market
10.3. North America Oil & Gas Downhole Cables Market Volume (Kilometers) and Value (US$ Mn) Forecast, by Type, 2018–2027
10.4. North America Oil & Gas Downhole Cables Market Volume (Kilometers) and Value (US$ Mn) Forecast, by Installation, 2018–2027
10.5. North America Oil & Gas Downhole Cables Market Volume (Kilometers) and Value (US$ Mn) Forecast, by Application, 2018–2027
10.6. North America Oil & Gas Downhole Cables Market Volume (Kilometers) and Value (US$ Mn) Forecast, by Country
10.6.1. U.S. Oil & Gas Downhole Cables Market Volume (Kilometers) and Value (US$ Mn) Forecast, by Type, 2018–2027
10.6.2. U.S. Oil & Gas Downhole Cables Market Volume (Kilometers) and Value (US$ Mn) Forecast, by Installation, 2018–2027
10.6.3. U.S. Oil & Gas Downhole Cables Market Volume (Kilometers) and Value (US$ Mn) Forecast, by Application, 2018–2027
10.6.4. Canada Oil & Gas Downhole Cables Market Volume (Kilometers) and Value (US$ Mn) Forecast, by Type, 2018–2027
10.6.5. Canada Oil & Gas Downhole Cables Market Volume (Kilometers) and Value (US$ Mn) Forecast, by Installation, 2018–2027
10.6.6. Canada Oil & Gas Downhole Cables Market Volume (Kilometers) and Value (US$ Mn) Forecast, by Application, 2018–2027
10.7. North America Oil & Gas Downhole Cables Market Attractiveness Analysis, by Type
10.8. North America Oil & Gas Downhole Cables Market Attractiveness Analysis, by Installation
10.9. North America Oil & Gas Downhole Cables Market Attractiveness Analysis, by Application
10.10. North America Oil & Gas Downhole Cables Market Attractiveness Analysis, by Country
11. Europe Oil & Gas Downhole Cables Market Overview
11.1. Key Findings
11.2. Key Drivers of Europe Market
11.3. Europe Oil & Gas Downhole Cables Market Volume (Kilometers) and Value (US$ Mn) Forecast, by Type, 2018–2027
11.4. Europe Oil & Gas Downhole Cables Market Volume (Kilometers) and Value (US$ Mn) Forecast, by Installation, 2018–2027
11.5. Europe Oil & Gas Downhole Cables Market Volume (Kilometers) and Value (US$ Mn) Forecast, by Application, 2018–2027
11.6. Europe Oil & Gas Downhole Cables Market Volume (Kilometers) and Value (US$ Mn) Forecast, by Country and Sub-region
11.6.1. U.K. Oil & Gas Downhole Cables Market Volume (Kilometers) and Value (US$ Mn) Forecast, by Type, 2018–2027
11.6.2. U.K. Oil & Gas Downhole Cables Market Volume (Kilometers) and Value (US$ Mn) Forecast, by Application, 2018–2027
11.6.3. U.K. Oil & Gas Downhole Cables Market Volume (Kilometers) and Value (US$ Mn) Forecast, by Application, 2018–2027
11.6.4. Norway Oil & Gas Downhole Cables Market Volume (Kilometers) and Value (US$ Mn) Forecast, by Type, 2018–2027
11.6.5. Norway Oil & Gas Downhole Cables Market Volume (Kilometers) and Value (US$ Mn) Forecast, by Installation, 2018–2027
11.6.6. Norway Oil & Gas Downhole Cables Market Volume (Kilometers) and Value (US$ Mn) Forecast, by Application, 2018–2027
11.6.7. Russia & CIS Oil & Gas Downhole Cables Market Volume (Kilometers) and Value (US$ Mn) Forecast, by Type, 2018–2027
11.6.8. Russia & CIS Oil & Gas Downhole Cables Market Volume (Kilometers) and Value (US$ Mn) Forecast, by Installation, 2018–2027
11.6.9. Russia & CIS Oil & Gas Downhole Cables Market Volume (Kilometers) and Value (US$ Mn) Forecast, by Application, 2018–2027
11.6.10. Rest of Europe Oil & Gas Downhole Cables Market Volume (Kilometers) and Value (US$ Mn) Forecast, by Type, 2018–2027
11.6.11. Rest of Europe Oil & Gas Downhole Cables Market Volume (Kilometers) and Value (US$ Mn) Forecast, by Installation, 2018–2027
11.6.12. Rest of Europe Oil & Gas Downhole Cables Market Volume (Kilometers) and Value (US$ Mn) Forecast, by Application, 2018–2027
11.7. Europe Oil & Gas Downhole Cables Market Attractiveness Analysis, by Type
11.8. Europe Oil & Gas Downhole Cables Market Attractiveness Analysis, by Installation
11.9. Europe Oil & Gas Downhole Cables Market Attractiveness Analysis, by Application
11.10. Europe Oil & Gas Downhole Cables Market Attractiveness Analysis, by Country and Sub-region
12. Asia Pacific Oil & Gas Downhole Cables Market Overview
12.1. Key Findings
12.2. Key Drivers of Asia Pacific Market
12.3. Asia Pacific Oil & Gas Downhole Cables Market Volume (Kilometers) and Value (US$ Mn) Forecast, by Type, 2018–2027
12.4. Asia Pacific Oil & Gas Downhole Cables Market Volume (Kilometers) and Value (US$ Mn) Forecast, by Installation, 2018–2027
12.5. Asia Pacific Oil & Gas Downhole Cables Market Volume (Kilometers) and Value (US$ Mn) Forecast, by Application, 2018–2027
12.6. Asia Pacific Oil & Gas Downhole Cables Market Volume (Kilometers) and Value (US$ Mn) Forecast, by Country and Sub-region
12.6.1. China Oil & Gas Downhole Cables Market Volume (Kilometers) and Value (US$ Mn) Forecast, by Type, 2018–2027
12.6.2. China Oil & Gas Downhole Cables Market Volume (Kilometers) and Value (US$ Mn) Forecast, by Installation, 2018–2027
12.6.3. China Oil & Gas Downhole Cables Market Volume (Kilometers) and Value (US$ Mn) Forecast, by Application, 2018–2027
12.6.4. India Oil & Gas Downhole Cables Market Volume (Kilometers) and Value (US$ Mn) Forecast, by Type, 2018–2027
12.6.5. India Oil & Gas Downhole Cables Market Volume (Kilometers) and Value (US$ Mn) Forecast, by Installation, 2018–2027
12.6.6. India Oil & Gas Downhole Cables Market Volume (Kilometers) and Value (US$ Mn) Forecast, by Application, 2018–2027
12.6.7. ASEAN Oil & Gas Downhole Cables Market Volume (Kilometers) and Value (US$ Mn) Forecast, by Type, 2018–2027
12.6.8. ASEAN Oil & Gas Downhole Cables Market Volume (Kilometers) and Value (US$ Mn) Forecast, by Installation, 2018–2027
12.6.9. ASEAN Oil & Gas Downhole Cables Market Volume (Kilometers) and Value (US$ Mn) Forecast, by Application, 2018–2027
12.6.10. Rest of Asia Pacific Oil & Gas Downhole Cables Market Volume (Kilometers) and Value (US$ Mn) Forecast, by Type, 2018–2027
12.6.11. Rest of Asia Pacific Oil & Gas Downhole Cables Market Volume (Kilometers) and Value (US$ Mn) Forecast, by Installation, 2018–2027
12.6.12. Rest of Asia Pacific Oil & Gas Downhole Cables Market Volume (Kilometers) and Value (US$ Mn) Forecast, by Application, 2018–2027
12.7. Asia Pacific Oil & Gas Downhole Cables Market Attractiveness Analysis, by Type
12.8. Asia Pacific Oil & Gas Downhole Cables Market Attractiveness Analysis, by Installation
12.9. Asia Pacific Oil & Gas Downhole Cables Market Attractiveness Analysis, by Application
12.10. Asia Pacific Oil & Gas Downhole Cables Market Attractiveness Analysis, by Country and Sub-region
13. Latin America Oil & Gas Downhole Cables Market Overview
13.1. Key Findings
13.2. Key Drivers of Latin America Market
13.3. Latin America Oil & Gas Downhole Cables Market Volume (Kilometers) and Value (US$ Mn) Forecast, by Type, 2018–2027
13.4. Latin America Oil & Gas Downhole Cables Market Volume (Kilometers) and Value (US$ Mn) Forecast, by Installation, 2018–2027
13.5. Latin America Oil & Gas Downhole Cables Market Volume (Kilometers) and Value (US$ Mn) Forecast, by Application, 2018–2027
13.6. Latin America Oil & Gas Downhole Cables Market Volume (Kilometers) and Value (US$ Mn) Forecast, by Country and Sub-region
13.6.1. Brazil Oil & Gas Downhole Cables Market Volume (Kilometers) and Value (US$ Mn) Forecast, by Type, 2018–2027
13.6.2. Brazil Oil & Gas Downhole Cables Market Volume (Kilometers) and Value (US$ Mn) Forecast, by Installation, 2018–2027
13.6.3. Brazil Oil & Gas Downhole Cables Market Volume (Kilometers) and Value (US$ Mn) Forecast, by Application, 2018–2027
13.6.4. Mexico Oil & Gas Downhole Cables Market Volume (Kilometers) and Value (US$ Mn) Forecast, by Type, 2018–2027
13.6.5. Mexico Oil & Gas Downhole Cables Market Volume (Kilometers) and Value (US$ Mn) Forecast, by Installation, 2018–2027
13.6.6. Mexico Oil & Gas Downhole Cables Market Volume (Kilometers) and Value (US$ Mn) Forecast, by Application, 2018–2027
13.6.7. Venezuela Oil & Gas Downhole Cables Market Volume (Kilometers) and Value (US$ Mn) Forecast, by Type, 2018–2027
13.6.8. Venezuela Oil & Gas Downhole Cables Market Volume (Kilometers) and Value (US$ Mn) Forecast, by Installation, 2018–2027
13.6.9. Venezuela Oil & Gas Downhole Cables Market Volume (Kilometers) and Value (US$ Mn) Forecast, by Application, 2018–2027
13.6.10. Rest of Latin America Oil & Gas Downhole Cables Market Volume (Kilometers) and Value (US$ Mn) Forecast, by Type, 2018–2027
13.6.11. Rest of Latin America Oil & Gas Downhole Cables Market Volume (Kilometers) and Value (US$ Mn) Forecast, by Installation, 2018–2027
13.6.12. Rest of Latin America Oil & Gas Downhole Cables Market Volume (Kilometers) and Value (US$ Mn) Forecast, by Application, 2018–2027
13.7. Latin America Oil & Gas Downhole Cables Market Attractiveness Analysis, by Type
13.8. Latin America Oil & Gas Downhole Cables Market Attractiveness Analysis, by Installation
13.9. Latin America Oil & Gas Downhole Cables Market Attractiveness Analysis, by Application
13.10. Latin America Oil & Gas Downhole Cables Market Attractiveness Analysis, by Country and Sub-region
14. Middle East & Africa Oil & Gas Downhole Cables Market Overview
14.1. Key Findings
14.2. Key Drivers of Middle East & Africa Market
14.3. Middle East & Africa Oil & Gas Downhole Cables Market Volume (Kilometers) and Value (US$ Mn) Forecast, by Type, 2018–2027
14.4. Middle East & Africa Oil & Gas Downhole Cables Market Volume (Kilometers) and Value (US$ Mn) Forecast, by Installation, 2018–2027
14.5. Middle East & Africa Oil & Gas Downhole Cables Market Volume (Kilometers) and Value (US$ Mn) Forecast, by Application, 2018–2027
14.6. Middle East & Africa Oil & Gas Downhole Cables Market Volume (Kilometers) and Value (US$ Mn) Forecast, by Country and Sub-region
14.6.1. Saudi Arabia Oil & Gas Downhole Cables Market Volume (Kilometers) and Value (US$ Mn) Forecast, by Type, 2018–2027
14.6.2. Saudi Arabia Oil & Gas Downhole Cables Market Volume (Kilometers) and Value (US$ Mn) Forecast, by Installation, 2018–2027
14.6.3. Saudi Arabia Oil & Gas Downhole Cables Market Volume (Kilometers) and Value (US$ Mn) Forecast, by Application, 2018–2027
14.6.4. UAE Oil & Gas Downhole Cables Market Volume (Kilometers) and Value (US$ Mn) Forecast, by Type, 2018–2027
14.6.5. UAE Oil & Gas Downhole Cables Market Volume (Kilometers) and Value (US$ Mn) Forecast, by Installation, 2018–2027
14.6.6. UAE Oil & Gas Downhole Cables Market Volume (Kilometers) and Value (US$ Mn) Forecast, by Application, 2018–2027
14.6.7. Qatar Oil & Gas Downhole Cables Market Volume (Kilometers) and Value (US$ Mn) Forecast, by Type, 2018–2027
14.6.8. Qatar Oil & Gas Downhole Cables Market Volume (Kilometers) and Value (US$ Mn) Forecast, by Installation, 2018–2027
14.6.9. Qatar Oil & Gas Downhole Cables Market Volume (Kilometers) and Value (US$ Mn) Forecast, by Application, 2018–2027
14.6.10. Nigeria Oil & Gas Downhole Cables Market Volume (Kilometers) and Value (US$ Mn) Forecast, by Type, 2018–2027
14.6.11. Nigeria Oil & Gas Downhole Cables Market Volume (Kilometers) and Value (US$ Mn) Forecast, by Installation, 2018–2027
14.6.12. Nigeria Oil & Gas Downhole Cables Market Volume (Kilometers) and Value (US$ Mn) Forecast, by Application, 2018–2027
14.6.13. Rest of Middle East & Africa Oil & Gas Downhole Cables Market Volume (Kilometers) and Value (US$ Mn) Forecast, by Type, 2018–2027
14.6.14. Rest of Middle East & Africa Oil & Gas Downhole Cables Market Volume (Kilometers) and Value (US$ Mn) Forecast, by Installation, 2018–2027
14.6.15. Rest of Middle East & Africa Oil & Gas Downhole Cables Market Volume (Kilometers) and Value (US$ Mn) Forecast, by Application, 2018–2027
14.7. Middle East & Africa Oil & Gas Downhole Cables Market Attractiveness Analysis, by Type
14.8. Middle East & Africa Oil & Gas Downhole Cables Market Attractiveness Analysis, by Installation
14.9. Middle East & Africa Oil & Gas Downhole Cables Market Attractiveness Analysis, by Application
14.10. Middle East & Africa Oil & Gas Downhole Cables Market Attractiveness Analysis, by Country and Sub-region
15. Competition Landscape
15.1. Global Oil & Gas Downhole Cables Market Share Analysis, by Company (2018)
15.2. Competition Matrix
15.2.1. Prysmian Group
15.2.2. Nexans Group
15.2.3. ABB
15.2.4. Belden Inc.
15.2.5. W. L. Gore & Associates, Inc.
15.3. Market Footprint Analysis
15.4. Company Profiles
15.4.1. Prysmian Group
15.4.1.1. Company Details
15.4.1.2. Company Description
15.4.1.3. Business Overview
15.4.1.4. Financial Details
15.4.1.5. Strategic Overview/Recent Developments
15.4.2. Eland Cables
15.4.2.1. Company Details
15.4.2.2. Company Description
15.4.2.3. Business Overview
15.4.3. Nexans Group
15.4.3.1. Company Details
15.4.3.2. Company Description
15.4.3.3. Business Overview
15.4.3.4. Financial Details
15.4.3.5. Strategic Overview/Recent Developments
15.4.4. NKT A/S
15.4.4.1. Company Details
15.4.4.2. Company Description
15.4.4.3. Business Overview
15.4.4.4. Financial Details
15.4.4.5. Strategic Overview/Recent Developments
15.4.5. ABB Ltd.
15.4.5.1. Company Details
15.4.5.2. Company Description
15.4.5.3. Business Overview
15.4.5.4. Financial Details
15.4.5.5. Strategic Overview/Recent Developments
15.4.6. Marmon Group
15.4.6.1. Company Details
15.4.6.2. Company Description
15.4.6.3. Business Overview
15.4.6.4. Strategic Overview/Recent Developments
15.4.7. GalaxyWire.com
15.4.7.1. Company Details
15.4.7.2. Company Description
15.4.7.3. Business Overview
15.4.8. W. L. Gore & Associates, Inc.
15.4.8.1. Company Details
15.4.8.2. Company Description
15.4.8.3. Business Overview
15.4.8.4. Strategic Overview/Recent Developments
15.4.9. Belden Inc.
15.4.9.1. Company Details
15.4.9.2. Company Description
15.4.9.3. Financial Details
15.4.9.4. Business Overview
15.4.9.5. Strategic Overview/Recent Developments
15.4.10. LS Cable & System Ltd.
15.4.10.1. Company Details
15.4.10.2. Company Description
15.4.10.3. Financial Details
15.4.10.4. Business Overview
15.4.10.5. Strategic Overview/Recent Developments
15.4.11. AFL
15.4.11.1. Company Details
15.4.11.2. Company Description
15.4.11.3. Financial Details
15.4.11.4. Business Overview
15.4.11.5. Strategic Overview/Recent Developments
15.4.12. ZTT
15.4.12.1. Company Details
15.4.12.2. Company Description
15.4.12.3. Business Overview
15.4.12.4. Strategic Overview/Recent Developments
15.4.13. Tratos
15.4.13.1. Company Details
15.4.13.2. Company Description
15.4.13.3. Business Overview
15.4.14. TEXCAN Division of Sonepar Canada Inc.
15.4.14.1. Company Details
15.4.14.2. Company Description
15.4.14.3. Business Overview
List of Tables
Table 01: Global Oil & Gas Downhole Cables Market Volume (Kilometers) Forecast, by Type, 2018–2027
Table 02: Global Oil & Gas Downhole Cables Market Value (US$ Mn) Forecast, by Type, 2018–2027
Table 03: Global Oil & Gas Downhole Cables Market Volume (Kilometers) Forecast, by Installation, 2018–2027
Table 04: Global Oil & Gas Downhole Cables Market Value (US$ Mn) Forecast, by Installation, 2018–2027
Table 05: Global Oil & Gas Downhole Cables Market Volume (Kilometers) Forecast, by Application, 2018–2027
Table 06: Global Oil & Gas Downhole Cables Market Value (US$ Mn) Forecast, by Application, 2018–2027
Table 07: Global Oil & Gas Downhole Cables Market Volume (Kilometers) Forecast, by Region, 2018–2027
Table 08: Global Oil & Gas Downhole Cables Market Value (US$ Mn) Forecast, by Region, 2018–2027
Table 09: North America Oil & Gas Downhole Cables Market Volume (Kilometers) Forecast, by Country, 2018–2027
Table 10: North America Oil & Gas Downhole Cables Market Value (US$ Mn) Forecast, by Country, 2018–2027
Table 11: North America Oil & Gas Downhole Cables Market Volume (Kilometers) Forecast, by Type, 2018–2027
Table 12: North America Oil & Gas Downhole Cables Market Value (US$ Mn) Forecast, by Type, 2018–2027
Table 13: North America Oil & Gas Downhole Cables Market Volume (Kilometers) Forecast, by Application, 2018–2027
Table 14: North America Oil & Gas Downhole Cables Market Value (US$ Mn) Forecast, by Application, 2018–2027
Table 15: North America Oil & Gas Downhole Cables Market Volume (Kilometers) Forecast, by Installation, 2018–2027
Table 16: North America Oil & Gas Downhole Cables Market Value (US$ Mn) Forecast, by Installation, 2018–2027
Table 17: U.S. Oil & Gas Downhole Cables Market Volume (Kilometers) Forecast, by Type, 2018–2027
Table 18: U.S. Oil & Gas Downhole Cables Market Value (US$ Mn) Forecast, by Type, 2018–2027
Table 19: U.S. Oil & Gas Downhole Cables Market Volume (Kilometers) Forecast, by Application, 2018–2027
Table 20: U.S. Oil & Gas Downhole Cables Market Value (US$ Mn) Forecast, by Application, 2018–2027
Table 21: U.S. Oil & Gas Downhole Cables Market Volume (Kilometers) Forecast, by Installation, 2018–2027
Table 22: U.S. Oil & Gas Downhole Cables Market Value (US$ Mn) Forecast, by Installation, 2018–2027
Table 23: Canada Oil & Gas Downhole Cables Market Volume (Kilometers) Forecast, by Type, 2018–2027
Table 24: Canada Oil & Gas Downhole Cables Market Value (US$ Mn) Forecast, by Type, 2018–2027
Table 25: Canada Oil & Gas Downhole Cables Market Volume (Kilometers) Forecast, by Application, 2018–2027
Table 26: Canada Oil & Gas Downhole Cables Market Value (US$ Mn) Forecast, by Application, 2018–2027
Table 27: Canada Oil & Gas Downhole Cables Market Volume (Kilometers) Forecast, by Installation, 2018–2027
Table 28: Canada Oil & Gas Downhole Cables Market Value (US$ Mn) Forecast, by Installation, 2018–2027
Table 29: Europe Oil & Gas Downhole Cables Market Volume (Kilometers) Forecast, by Country and Sub-region, 2018–2027
Table 30: Europe Oil & Gas Downhole Cables Market Value (US$ Mn) Forecast, by Country and Sub-region, 2018–2027
Table 31: Europe Oil & Gas Downhole Cables Market Volume (Kilometers) Forecast, by Type, 2018–2027
Table 32: Europe Oil & Gas Downhole Cables Market Value (US$ Mn) Forecast, by Type, 2018–2027
Table 33: Europe Oil & Gas Downhole Cables Market Volume (Kilometers) Forecast, by Application, 2018–2027
Table 34: Europe Oil & Gas Downhole Cables Market Value (US$ Mn) Forecast, by Application, 2018–2027
Table 35: Europe Oil & Gas Downhole Cables Market Volume (Kilometers) Forecast, by Installation, 2018–2027
Table 36: Europe Oil & Gas Downhole Cables Market Value (US$ Mn) Forecast, by Installation, 2018–2027
Table 37: Norway Oil & Gas Downhole Cables Market Volume (Kilometers) Forecast, by Type, 2018–2027
Table 38: Norway Oil & Gas Downhole Cables Market Value (US$ Mn) Forecast, by Type, 2018–2027
Table 39: Norway Oil & Gas Downhole Cables Market Volume (Kilometers) Forecast, by Application, 2018–2027
Table 40: Norway Oil & Gas Downhole Cables Market Value (US$ Mn) Forecast, by Application, 2018–2027
Table 41: Norway Oil & Gas Downhole Cables Market Volume (Kilometers) Forecast, by Installation, 2018–2027
Table 42: Norway Oil & Gas Downhole Cables Market Value (US$ Mn) Forecast, by Installation, 2018–2027
Table 43: U.K. Oil & Gas Downhole Cables Market Volume (Kilometers) Forecast, by Type, 2018–2027
Table 44: U.K. Oil & Gas Downhole Cables Market Value (US$ Mn) Forecast, by Type, 2018–2027
Table 45: U.K. Oil & Gas Downhole Cables Market Volume (Kilometers) Forecast, by Application, 2018–2027
Table 46: U.K. Oil & Gas Downhole Cables Market Value (US$ Mn) Forecast, by Application, 2018–2027
Table 47: U.K. Oil & Gas Downhole Cables Market Volume (Kilometers) Forecast, by Installation, 2018–2027
Table 48: U.K. Oil & Gas Downhole Cables Market Value (US$ Mn) Forecast, by Installation, 2018–2027
Table 49: Russia & CIS Oil & Gas Downhole Cables Market Volume (Kilometers) Forecast, by Type, 2018–2027
Table 50: Russia & CIS Oil & Gas Downhole Cables Market Value (US$ Mn) Forecast, by Type, 2018–2027
Table 51: Russia & CIS Oil & Gas Downhole Cables Market Volume (Kilometers) Forecast, by Application, 2018–2027
Table 52: Russia & CIS Oil & Gas Downhole Cables Market Value (US$ Mn) Forecast, by Application, 2018–2027
Table 53: Russia & CIS Oil & Gas Downhole Cables Market Volume (Kilometers) Forecast, by Installation, 2018–2027
Table 54: Russia & CIS Oil & Gas Downhole Cables Market Value (US$ Mn) Forecast, by Installation, 2018–2027
Table 55: Rest of Europe Oil & Gas Downhole Cables Market Volume (Kilometers) Forecast, by Type, 2018–2027
Table 56: Rest of Europe Oil & Gas Downhole Cables Market Value (US$ Mn) Forecast, by Type, 2018–2027
Table 57: Rest of Europe Oil & Gas Downhole Cables Market Volume (Kilometers) Forecast, by Application, 2018–2027
Table 58: Rest of Europe Oil & Gas Downhole Cables Market Value (US$ Mn) Forecast, by Application, 2018–2027
Table 59: Rest of Europe Oil & Gas Downhole Cables Market Volume (Kilometers) Forecast, by Installation, 2018–2027
Table 60: Rest of Europe Oil & Gas Downhole Cables Market Value (US$ Mn) Forecast, by Installation, 2018–2027
Table 61: Asia Pacific Oil & Gas Downhole Cables Market Volume (Kilometers) Forecast, by Country and Sub-region, 2018–2027
Table 62: Asia Pacific Oil & Gas Downhole Cables Market Value (US$ Mn) Forecast, by Country and Sub-region, 2018–2027
Table 63: Asia Pacific Oil & Gas Downhole Cables Market Volume (Kilometers) Forecast, by Type, 2018–2027
Table 64: Asia Pacific Oil & Gas Downhole Cables Market Value (US$ Mn) Forecast, by Type, 2018–2027
Table 65: Asia Pacific Oil & Gas Downhole Cables Market Volume (Kilometers) Forecast, by Application, 2018–2027
Table 66: Asia Pacific Oil & Gas Downhole Cables Market Value (US$ Mn) Forecast, by Application, 2018–2027
Table 67: Asia Pacific Oil & Gas Downhole Cables Market Volume (Kilometers) Forecast, by Installation, 2018–2027
Table 68: Asia Pacific Oil & Gas Downhole Cables Market Value (US$ Mn) Forecast, by Installation, 2018–2027
Table 69: China Oil & Gas Downhole Cables Market Volume (Kilometers) Forecast, by Type, 2018–2027
Table 70: China Oil & Gas Downhole Cables Market Value (US$ Mn) Forecast, by Type, 2018–2027
Table 71: China Oil & Gas Downhole Cables Market Volume (Kilometers) Forecast, by Application, 2018–2027
Table 72: China Oil & Gas Downhole Cables Market Value (US$ Mn) Forecast, by Application, 2018–2027
Table 73: China Oil & Gas Downhole Cables Market Volume (Kilometers) Forecast, by Installation, 2018–2027
Table 74: China Oil & Gas Downhole Cables Market Value (US$ Mn) Forecast, by Installation, 2018–2027
Table 75: India Oil & Gas Downhole Cables Market Volume (Kilometers) Forecast, by Type, 2018–2027
Table 76: India Oil & Gas Downhole Cables Market Value (US$ Mn) Forecast, by Type, 2018–2027
Table 77: India Oil & Gas Downhole Cables Market Volume (Kilometers) Forecast, by Application, 2018–2027
Table 78: India Oil & Gas Downhole Cables Market Value (US$ Mn) Forecast, by Application, 2018–2027
Table 79: India Oil & Gas Downhole Cables Market Volume (Kilometers) Forecast, by Installation, 2018–2027
Table 80: India Oil & Gas Downhole Cables Market Value (US$ Mn) Forecast, by Installation, 2018–2027
Table 81: Australia Oil & Gas Downhole Cables Market Volume (Kilometers) Forecast, by Type, 2018–2027
Table 82: Australia Oil & Gas Downhole Cables Market Value (US$ Mn) Forecast, by Type, 2018–2027
Table 83: Australia Oil & Gas Downhole Cables Market Volume (Kilometers) Forecast, by Application, 2018–2027
Table 84: Australia Oil & Gas Downhole Cables Market Value (US$ Mn) Forecast, by Application, 2018–2027
Table 85: Australia Oil & Gas Downhole Cables Market Volume (Kilometers) Forecast, by Installation, 2018–2027
Table 86: Australia Oil & Gas Downhole Cables Market Value (US$ Mn) Forecast, by Installation, 2018–2027
Table 87: ASEAN Oil & Gas Downhole Cables Market Volume (Kilometers) Forecast, by Type, 2018–2027
Table 88: ASEAN Oil & Gas Downhole Cables Market Value (US$ Mn) Forecast, by Type, 2018–2027
Table 89: ASEAN Oil & Gas Downhole Cables Market Volume (Kilometers) Forecast, by Application, 2018–2027
Table 90: ASEAN Oil & Gas Downhole Cables Market Value (US$ Mn) Forecast, by Application, 2018–2027
Table 91: ASEAN Oil & Gas Downhole Cables Market Volume (Kilometers) Forecast, by Installation, 2018–2027
Table 92: ASEAN Oil & Gas Downhole Cables Market Value (US$ Mn) Forecast, by Installation, 2018–2027
Table 93: Rest of Asia Pacific Oil & Gas Downhole Cables Market Volume (Kilometers) Forecast, by Type, 2018–2027
Table 94: Rest of Asia Pacific Oil & Gas Downhole Cables Market Value (US$ Mn) Forecast, by Type, 2018–2027
Table 95: Rest of Asia Pacific Oil & Gas Downhole Cables Market Volume (Kilometers) Forecast, by Application, 2018–2027
Table 96: Rest of Asia Pacific Oil & Gas Downhole Cables Market Value (US$ Mn) Forecast, by Application, 2018–2027
Table 97: Rest of Asia Pacific Oil & Gas Downhole Cables Market Volume (Kilometers) Forecast, by Installation, 2018–2027
Table 98: Rest of Asia Pacific Oil & Gas Downhole Cables Market Value (US$ Mn) Forecast, by Installation, 2018–2027
Table 99: Latin America Oil & Gas Downhole Cables Market Volume (Kilometers) Forecast, by Country and Sub-region, 2018–2027
Table 100: Latin America Oil & Gas Downhole Cables Market Value (US$ Mn) Forecast, by Country and Sub-region, 2018–2027
Table 101: Latin America Oil & Gas Downhole Cables Market Volume (Kilometers) Forecast, by Type, 2018–2027
Table 102: Latin America Oil & Gas Downhole Cables Market Value (US$ Mn) Forecast, by Type, 2018–2027
Table 103: Latin America Oil & Gas Downhole Cables Market Volume (Kilometers) Forecast, by Application, 2018–2027
Table 104: Latin America Oil & Gas Downhole Cables Market Value (US$ Mn) Forecast, by Application, 2018–2027
Table 105: Latin America Oil & Gas Downhole Cables Market Volume (Kilometers) Forecast, by Installation, 2018–2027
Table 106: Latin America Oil & Gas Downhole Cables Market Value (US$ Mn) Forecast, by Installation, 2018–2027
Table 107: Brazil Oil & Gas Downhole Cables Market Volume (Kilometers) Forecast, by Type, 2018–2027
Table 108: Brazil Oil & Gas Downhole Cables Market Value (US$ Mn) Forecast, by Type, 2018–2027
Table 109: Brazil Oil & Gas Downhole Cables Market Volume (Kilometers) Forecast, by Application, 2018–2027
Table 110: Brazil Oil & Gas Downhole Cables Market Value (US$ Mn) Forecast, by Application, 2018–2027
Table 111: Brazil Oil & Gas Downhole Cables Market Volume (Kilometers) Forecast, by Installation, 2018–2027
Table 112: Brazil Oil & Gas Downhole Cables Market Value (US$ Mn) Forecast, by Installation, 2018–2027
Table 113: Mexico Oil & Gas Downhole Cables Market Volume (Kilometers) Forecast, by Type, 2018–2027
Table 114: Mexico Oil & Gas Downhole Cables Market Value (US$ Mn) Forecast, by Type, 2018–2027
Table 115: Mexico Oil & Gas Downhole Cables Market Volume (Kilometers) Forecast, by Application, 2018–2027
Table 116: Mexico Oil & Gas Downhole Cables Market Value (US$ Mn) Forecast, by Application, 2018–2027
Table 117: Mexico Oil & Gas Downhole Cables Market Volume (Kilometers) Forecast, by Installation, 2018–2027
Table 118: Mexico Oil & Gas Downhole Cables Market Value (US$ Mn) Forecast, by Installation, 2018–2027
Table 119: Venezuela Oil & Gas Downhole Cables Market Volume (Kilometers) Forecast, by Type, 2018–2027
Table 120: Venezuela Oil & Gas Downhole Cables Market Value (US$ Mn) Forecast, by Type, 2018–2027
Table 121: Venezuela Oil & Gas Downhole Cables Market Volume (Kilometers) Forecast, by Application, 2018–2027
Table 122: Venezuela Oil & Gas Downhole Cables Market Value (US$ Mn) Forecast, by Application, 2018–2027
Table 123: Venezuela Oil & Gas Downhole Cables Market Volume (Kilometers) Forecast, by Installation, 2018–2027
Table 124: Venezuela Oil & Gas Downhole Cables Market Value (US$ Mn) Forecast, by Installation, 2018–2027
Table 125: Rest of Latin America Oil & Gas Downhole Cables Market Volume (Kilometers) Forecast, by Type, 2018–2027
Table 126: Rest of Latin America Oil & Gas Downhole Cables Market Value (US$ Mn) Forecast, by Type, 2018–2027
Table 127: Rest of Latin America Oil & Gas Downhole Cables Market Volume (Kilometers) Forecast, by Application, 2018–2027
Table 128: Rest of Latin America Oil & Gas Downhole Cables Market Value (US$ Mn) Forecast, by Application, 2018–2027
Table 129: Rest of Latin America Oil & Gas Downhole Cables Market Volume (Kilometers) Forecast, by Installation, 2018–2027
Table 130: Rest of Latin America Oil & Gas Downhole Cables Market Value (US$ Mn) Forecast, by Installation, 2018–2027
Table 131: Middle East & Africa Oil & Gas Downhole Cables Market Volume (Kilometers) Forecast, by Country and Sub-region, 2018–2027
Table 132: Middle East & Africa Oil & Gas Downhole Cables Market Value (US$ Mn) Forecast, by Country and Sub-region, 2018–2027
Table 133: Middle East & Africa Oil & Gas Downhole Cables Market Volume (Kilometers) Forecast, by Type, 2018–2027
Table 134: Middle East & Africa Oil & Gas Downhole Cables Market Value (US$ Mn) Forecast, by Type, 2018–2027
Table 135: Middle East & Africa Oil & Gas Downhole Cables Market Volume (Kilometers) Forecast, by Application, 2018–2027
Table 136: Middle East & Africa Oil & Gas Downhole Cables Market Value (US$ Mn) Forecast, by Application, 2018–2027
Table 137: Middle East & Africa Oil & Gas Downhole Cables Market Volume (Kilometers) Forecast, by Installation, 2018–2027
Table 138: Middle East & Africa Oil & Gas Downhole Cables Market Value (US$ Mn) Forecast, by Installation, 2018–2027
Table 139: Saudi Arabia Oil & Gas Downhole Cables Market Volume (Kilometers) Forecast, by Type, 2018–2027
Table 140: Saudi Arabia Oil & Gas Downhole Cables Market Value (US$ Mn) Forecast, by Type, 2018–2027
Table 141: Saudi Arabia Oil & Gas Downhole Cables Market Volume (Kilometers) Forecast, by Application, 2018–2027
Table 142: Saudi Arabia Oil & Gas Downhole Cables Market Value (US$ Mn) Forecast, by Application, 2018–2027
Table 143: Saudi Arabia Oil & Gas Downhole Cables Market Volume (Kilometers) Forecast, by Installation, 2018–2027
Table 144: Saudi Arabia Oil & Gas Downhole Cables Market Value (US$ Mn) Forecast, by Installation, 2018–2027
Table 145: UAE Oil & Gas Downhole Cables Market Volume (Kilometers) Forecast, by Type, 2018–2027
Table 146: UAE Oil & Gas Downhole Cables Market Value (US$ Mn) Forecast, by Type, 2018–2027
Table 147: UAE Oil & Gas Downhole Cables Market Volume (Kilometers) Forecast, by Application, 2018–2027
Table 148: UAE Oil & Gas Downhole Cables Market Value (US$ Mn) Forecast, by Application, 2018–2027
Table 149: UAE Oil & Gas Downhole Cables Market Volume (Kilometers) Forecast, by Installation, 2018–2027
Table 150: UAE Oil & Gas Downhole Cables Market Value (US$ Mn) Forecast, by Installation, 2018–2027
Table 151: Qatar Oil & Gas Downhole Cables Market Volume (Kilometers) Forecast, by Type, 2018–2027
Table 152: Qatar Oil & Gas Downhole Cables Market Value (US$ Mn) Forecast, by Type, 2018–2027
Table 153: Qatar Oil & Gas Downhole Cables Market Volume (Kilometers) Forecast, by Application, 2018–2027
Table 154: Qatar Oil & Gas Downhole Cables Market Value (US$ Mn) Forecast, by Application, 2018–2027
Table 155: Qatar Oil & Gas Downhole Cables Market Volume (Kilometers) Forecast, by Installation, 2018–2027
Table 156: Qatar Oil & Gas Downhole Cables Market Value (US$ Mn) Forecast, by Installation, 2018–2027
Table 157: Nigeria Oil & Gas Downhole Cables Market Volume (Kilometers) Forecast, by Type, 2018–2027
Table 158: Nigeria Oil & Gas Downhole Cables Market Value (US$ Mn) Forecast, by Type, 2018–2027
Table 159: Nigeria Oil & Gas Downhole Cables Market Volume (Kilometers) Forecast, by Application, 2018–2027
Table 160: Nigeria Oil & Gas Downhole Cables Market Value (US$ Mn) Forecast, by Application, 2018–2027
Table 161: Nigeria Oil & Gas Downhole Cables Market Volume (Kilometers) Forecast, by Installation, 2018–2027
Table 162: Nigeria Oil & Gas Downhole Cables Market Value (US$ Mn) Forecast, by Installation, 2018–2027
Table 163: Rest of Middle East & Africa Oil & Gas Downhole Cables Market Volume (Kilometers) Forecast, by Type, 2018–2027
Table 164: Rest of Middle East & Africa Oil & Gas Downhole Cables Market Value (US$ Mn) Forecast, by Type, 2018–2027
Table 165: Rest of Middle East & Africa Oil & Gas Downhole Cables Market Volume (Kilometers) Forecast, by Application, 2018–2027
Table 166: Rest of Middle East & Africa Oil & Gas Downhole Cables Market Value (US$ Mn) Forecast, by Application, 2018–2027
Table 167: Rest of Middle East & Africa Oil & Gas Downhole Cables Market Volume (Kilometers) Forecast, by Installation, 2018–2027
Table 168: Rest of Middle East & Africa Oil & Gas Downhole Cables Market Value (US$ Mn) Forecast, by Installation, 2018–2027
List of Figures
Figure 01: Global Oil & Gas Downhole Cables Market Value Share Analysis, by Type
Figure 02: Global Oil & Gas Downhole Cables Market Attractiveness Analysis, by Type
Figure 03: Global Oil & Gas Downhole Cables Market Volume Share Analysis, by Installation
Figure 04: Global Oil & Gas Downhole Cables Market Attractiveness Analysis, by Installation
Figure 05: Global Oil & Gas Downhole Cables Market Volume Share Analysis, by Application
Figure 06: Global Oil & Gas Downhole Cables Market Attractiveness Analysis, by Application
Figure 07: Global Oil & Gas Downhole Cables Market Volume Share Analysis, by Region
Figure 08: Global Oil & Gas Downhole Cables Market Attractiveness Analysis, by Region
Figure 09: North America Oil & Gas Downhole Cables Market Volume (Kilometers) and Value (US$ Mn), 2018–2027
Figure 10: North America Oil & Gas Downhole Cables Market Value Share Analysis, by Country
Figure 11: North America Oil & Gas Downhole Cables Market Attractiveness Analysis, by Country
Figure 12: North America Oil & Gas Downhole Cables Market Value Share Analysis, by Type
Figure 13: North America Oil & Gas Downhole Cables Market Attractiveness Analysis, by Type
Figure 14: North America Oil & Gas Downhole Cables Market Volume Share Analysis, by Application
Figure 15: North America Oil & Gas Downhole Cables Market Attractiveness Analysis, by Application
Figure 16: North America Oil & Gas Downhole Cables Market Volume Share Analysis, by Installation
Figure 17: North America Oil & Gas Downhole Cables Market Attractiveness Analysis, by Installation
Figure 18: Europe Oil & Gas Downhole Cables Market Volume (Kilometers) and Value (US$ Mn), 2018–2027
Figure 19: Europe Oil & Gas Downhole Cables Market Value Share Analysis, by Country and Sub-region
Figure 20: Europe Oil & Gas Downhole Cables Market Attractiveness Analysis, by Country and Sub-region
Figure 21: Europe Oil & Gas Downhole Cables Market Value Share Analysis, by Type
Figure 22: Europe Oil & Gas Downhole Cables Market Attractiveness Analysis, by Type
Figure 23: Europe Oil & Gas Downhole Cables Market Value Share Analysis, by Application
Figure 24: Europe Oil & Gas Downhole Cables Market Attractiveness Analysis, by Application
Figure 25: Europe Oil & Gas Downhole Cables Market Value Share Analysis, by Installation
Figure 26: Europe Oil & Gas Downhole Cables Market Attractiveness Analysis, by Installation
Figure 27: Asia Pacific Oil & Gas Downhole Cables Market Volume (Kilometers) and Value (US$ Mn), 2018–2027
Figure 28: Asia Pacific Oil & Gas Downhole Cables Market Value Share Analysis, by Country and Sub-region
Figure 29: Asia Pacific Oil & Gas Downhole Cables Market Attractiveness Analysis, by Country and Sub-region
Figure 30: Asia Pacific Oil & Gas Downhole Cables Market Value Share Analysis, by Type
Figure 31: Asia Pacific Oil & Gas Downhole Cables Market Attractiveness Analysis, by Type
Figure 32: Asia Pacific Oil & Gas Downhole Cables Market Value Share Analysis, by Application
Figure 33: Asia Pacific Oil & Gas Downhole Cables Market Attractiveness Analysis, by Application
Figure 34: Asia Pacific Oil & Gas Downhole Cables Market Value Share Analysis, by Installation
Figure 35: Asia Pacific Oil & Gas Downhole Cables Market Attractiveness Analysis, by Installation
Figure 36: Latin America Oil & Gas Downhole Cables Market Volume (Kilometers) and Value (US$ Mn), 2018–2027
Figure 37: Latin America Oil & Gas Downhole Cables Market Value Share Analysis, by Country and Sub-region
Figure 38: Latin America Oil & Gas Downhole Cables Market Attractiveness Analysis, by Country and Sub-region
Figure 39: Latin America Oil & Gas Downhole Cables Market Value Share Analysis, by Type
Figure 40: Latin America Oil & Gas Downhole Cables Market Attractiveness Analysis, by Type
Figure 41: Latin America Oil & Gas Downhole Cables Market Value Share Analysis, by Application
Figure 42: Latin America Oil & Gas Downhole Cables Market Attractiveness Analysis, by Application
Figure 43: Latin America Oil & Gas Downhole Cables Market Value Share Analysis, by Application
Figure 44: Latin America Oil & Gas Downhole Cables Market Attractiveness Analysis, by Application
Figure 45: Middle East & Africa Oil & Gas Downhole Cables Market Volume (Kilometers) and Value (US$ Mn), 2018–2027
Figure 46: Middle East & Africa Oil & Gas Downhole Cables Market Value Share Analysis, by Country and Sub-region
Figure 47: Middle East & Africa Oil & Gas Downhole Cables Market Attractiveness Analysis, by Country and Sub-region
Figure 48: Middle East & Africa Oil & Gas Downhole Cables Market Value Share Analysis, by Type
Figure 49: Middle East & Africa Oil & Gas Downhole Cables Market Attractiveness Analysis, by Type
Figure 50: Middle East & Africa Oil & Gas Downhole Cables Market Value Share Analysis, by Application
Figure 51: Middle East & Africa Oil & Gas Downhole Cables Market Attractiveness Analysis, by Application
Figure 52: Middle East & Africa Oil & Gas Downhole Cables Market Value Share Analysis, by Installation
Figure 53: Middle East & Africa Oil & Gas Downhole Cables Market Attractiveness Analysis, by Installation
Figure 54: Global Oil & Gas Downhole Cables Market Share Analysis, by Company, 2018
Copyright © Transparency Market Research, Inc. All Rights reserved
Trust Online

Oil & Gas Downhole Cables Market