
Reports
Reports
High Demand for Non-invasive NASH Treatment to Augment Market
Over the past couple of decades, the number of obesity, diabetes, and non-alcoholic fatty liver diseases (NAFLD) cases have increased at a rapid pace. The range of NAFLD extends from steatosis to non-alcoholic steatohepatitis (NASH). The rise in the prevalence of NAFLD has caused a great amount of economic burden on nations worldwide and as per trends, patients suffering from NAFLD-related diseases have emerged as one of the major subset of people requiring liver transplant. One of the major factors that is likely to propel the adoption of NASH biomarker is the high prevalence of NAFLD and the undesirable outcomes. The adoption of conventional techniques to address NAFLD such as biopsy is steadily declining due to limitations, including sampling bias, complications such as pain, bleeding, mortality, and poor acceptability.
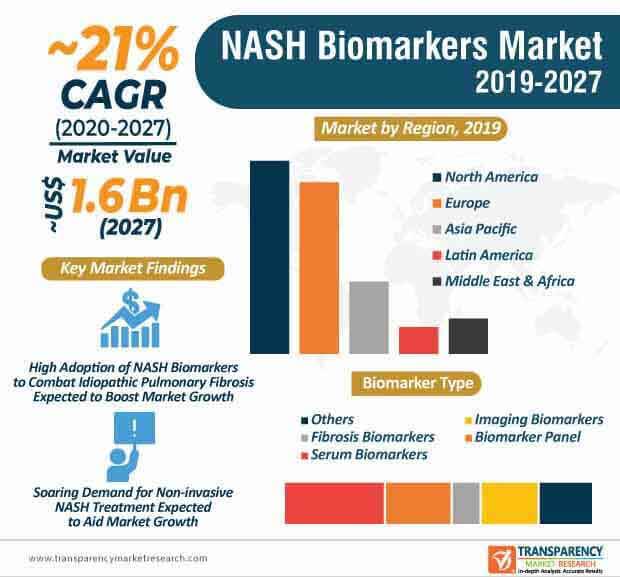
The demand for non-invasive techniques to treat NAFLD has witnessed a consistent growth over the past decade. Non-invasive techniques that have gained significant popularity to combat NAFLD include NASH, NAFLD-based fibrosis, and steatosis, among others. The surge in demand for these non-invasive techniques is expected to boost the demand for NASH biomarkers during the forecast period. In recent times, players operating in the global NASH biomarkers are increasingly investigating the algorithms that consist non-imaging and imaging biomarkers to diagnose fibrosis and minimize biopsies in clinical settings. Technological advancements, research and development activities coupled with high prevalence of NAFLD are some of major factors that are likely to drive the expansion of the non-alcoholic steatohepatitis (NASH) biomarkers market during the assessment period. At the back of these factors, the global non-alcoholic steatohepatitis (NASH) biomarkers market is expected to attain a market value of ~US$ 2 Bn by the end of 2027.
Adoption of NASH Biomarkers to Address Idiopathic Pulmonary Fibrosis
Advancements in the healthcare sector, along with research activities are likely to play a key role in the growth of the global non-alcoholic steatohepatitis (NASH) biomarkers market. In recent times, a considerable amount of research has been undertaken in discovering the potential treatments for idiopathic pulmonary fibrosis (IPF). In the past decade, the progression from NAFLD to NASH has increased at a rapid pace and has emerged as one of the most prevalent chronic liver conditions particularly in the Western regions, including North America and Europe– a factor due to which the production of NASH biomarkers is set to witness a considerable growth.
At present, while researchers are increasingly focusing on improving the efficacy of NASH biomarkers, healthcare providers, medical professionals, and healthcare workers are projected to increase awareness regarding NASH. Medical experts are of the opinion that the prevalence of NASH is set to grow at a rapid pace in the coming decade due to which, robust measures are required to combat the same. Public health groups, along with government organizations particularly in developed regions are focusing on formulating new guidelines that govern the management of NASH. Innovations within the non-alcoholic steatohepatitis (NASH) biomarkers market are primarily targeting improvements in non-invasive screening and diagnostic testing. In addition, companies operating in the current market landscape are increasingly focusing on different molecules for the treatment of NASH. Moreover, at present, while a large number of drugs are in phase three trials, multiple drugs are in the pipeline across world. Companies operating in the current market landscape are primarily focusing on replacing painful and invasive biopsies with non-invasive NASH biomarkers. The launch of the new project by the Foundation for the National Institutes of Health (FNIH) Biomarkers Consortium aimed toward standardizing biological markers to improve the diagnosis of NASH. The Non-Invasive Biomarkers of Metabolic Liver Disease project is expected to make a direct comparison between conventional and non-conventional techniques to address NASH and suggest the best tools to diagnose NASH. Such projects are expected to promote the sales of NASH biomarkers during the forecast period and thus, will augment the growth of the non-alcoholic steatohepatitis (NASH) biomarkers market.
Companies Adapt, Adjust, and Assess Pipeline Products, Seek FDA Approval
The advent of the novel coronavirus pandemic is expected to create major roadblocks for companies operating in the current non-alcoholic steatohepatitis (NASH) biomarkers market. Mobilization of researchers, front-line clinicians, manufacturers, and other participants in the value chain has emerged as a major area of concern amidst the chaos. On the heels of the health and economic crisis worldwide, The Global Liver Institute, recently revealed its plans to address the global pandemic by adapting and provide creative solutions. While supply chains within the non-alcoholic steatohepatitis (NASH) biomarkers market are likely to be disrupted, companies should focus on formulating effective business continuity strategies and focus on product diversification to address the business challenges put forward by the global pandemic.
Analysts’ Viewpoint
The global non-alcoholic steatohepatitis (NASH) biomarkers market is expected to grow at a staggering CAGR of ~21% during the forecast period. The market growth can be attributed to a host of factors, including high demand for non-invasive techniques to address NASH, research and development activities, government support for the development of NASH biomarkers, and high focus on curbing the prevalence of diabetes and NAFLD. Market players are anticipated to focus on the development of new NASH biomarkers and attain the approval from the FDA. Moreover, North America and Europe are likely to be the hotbeds of development within the global non-alcoholic steatohepatitis (NASH) biomarkers market.
Non-alcoholic Steatohepatitis (NASH) Biomarkers Market: Overview
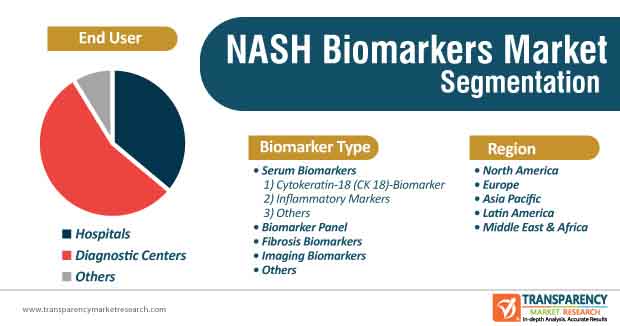
Non-alcoholic Steatohepatitis (NASH) Biomarkers Market: Segmentation
Non-alcoholic Steatohepatitis (NASH) Biomarkers Market: Regional Segmentation
Non-alcoholic Steatohepatitis (NASH) Biomarkers Market: Major Players
Non-alcoholic steatohepatitis biomarkers market to reach valuation of value of ~US$ 2 Bn by the end of 2027
Non-alcoholic steatohepatitis biomarkers market is expected to grow at a staggering CAGR of ~21% during 2019 - 2027
Non-alcoholic steatohepatitis biomarkers market is driven by the increase in prevalence of NAFLD & NASH disease
North America accounted for a major share of the global non-alcoholic steatohepatitis biomarkers market
Key players in the global non-alcoholic steatohepatitis biomarkers market include Biopredictive, Quest Diagnostics, Exalenz Bioscience Ltd, GENFIT, Siemens Healthineers
1. Preface
1.1. Market Definition and Scope
1.2. Market Segmentation
1.3. Key Research Objectives
1.4. Research Highlights
2. Assumptions and Research Methodology
3. Executive Summary: Global Non-alcoholic Steatohepatitis Biomarkers Market
4. Market Overview
4.1. Introduction
4.1.1. Market Definition
4.1.2. Industry Evolution / Developments
4.2. Overview
4.3. Market Dynamics
4.3.1. Drivers
4.3.2. Restraints
4.3.3. Opportunities
4.4. Global Non-alcoholic Steatohepatitis Biomarkers Market Analysis and Forecast, 2017–2027
4.4.1. Market Revenue Projections (US$ Mn)
5. Key Insights
5.1. Disease Prevalence & Incidence Rate globally with Key countries
5.2. Regulatory Scenario by Region/globally
5.3. Pipeline Analysis
6. Global Non-alcoholic Steatohepatitis Biomarkers Market Analysis and Forecast, by Biomarker Type
6.1. Introduction & Definition
6.2. Key Findings / Developments
6.3. Non-alcoholic Steatohepatitis Biomarkers Market Value Forecast, by Biomarker Type, 2017–2027
6.3.1. Serum Biomarkers
6.3.1.1. Cytokeratin-18 (CK 18) Marker
6.3.1.2. Inflammatory markers
6.3.1.3. Others
6.3.2. Biomarker Panel
6.3.3. Fibrosis Biomarkers
6.3.4. Imaging Biomarkers
6.3.5. Others
6.4. Market Attractiveness Analysis, by Biomarker Type
7. Global Non-alcoholic Steatohepatitis Biomarkers Market Analysis and Forecast, by End-user
7.1. Introduction & Definition
7.2. Key Findings / Developments
7.3. Non-alcoholic Steatohepatitis Biomarkers Market Value Forecast, by End-user, 2017–2027
7.3.1. Hospitals
7.3.2. Diagnostic Centers
7.3.3. Others
7.4. Market Attractiveness Analysis, by End-user
8. Global Non-alcoholic Steatohepatitis Biomarkers Market Analysis and Forecast, by Region
8.1. Key Findings
8.2. Non-alcoholic Steatohepatitis Biomarkers Market Value Forecast, by Region
8.2.1. North America
8.2.2. Europe
8.2.3. Asia Pacific
8.2.4. Latin America
8.2.5. Middle East & Africa
8.3. Market Attractiveness Analysis, by Region
9. North America Non-alcoholic Steatohepatitis Biomarkers Market Analysis and Forecast
9.1. Introduction
9.1.1. Key Findings
9.2. North America Non-alcoholic Steatohepatitis Biomarkers Market Value Forecast, by Biomarker Type, 2017–2027
9.2.1. Serum Biomarkers
9.2.1.1. Cytokeratin-18 (CK 18) Marker
9.2.1.2. Inflammatory Markers
9.2.1.3. Others
9.2.2. Biomarker Panel
9.2.3. Fibrosis Biomarkers
9.2.4. Imaging Biomarkers
9.2.5. Others
9.3. North America Non-alcoholic Steatohepatitis Biomarkers Market Value Forecast, by End-user, 2017–2027
9.3.1. Hospitals
9.3.2. Diagnostic Centers
9.3.3. Others
9.4. North America Non-alcoholic Steatohepatitis Biomarkers Market Value Forecast, by Country, 2017–2027
9.4.1. U.S.
9.4.2. Canada
9.5. North America Non-alcoholic Steatohepatitis Biomarkers Market Attractiveness Analysis
9.5.1. By Biomarker Type
9.5.2. By End-user
9.5.3. By Country
10. Europe Non-alcoholic Steatohepatitis Biomarkers Market Analysis and Forecast
10.1. Introduction
10.1.1. Key Findings
10.2. Europe Non-alcoholic Steatohepatitis Biomarkers Market Value Forecast, by Biomarker Type, 2017–2027
10.2.1. Serum Biomarkers
10.2.1.1. Cytokeratin-18 (CK 18) Marker
10.2.1.2. Inflammatory Markers
10.2.1.3. Others
10.2.2. Biomarker Panel
10.2.3. Fibrosis Biomarkers
10.2.4. Imaging Biomarkers
10.2.5. Others
10.3. Europe Non-alcoholic Steatohepatitis Biomarkers Market Value Forecast, by End-user, 2017–2027
10.3.1. Hospitals
10.3.2. Diagnostic Centers
10.3.3. Others
10.4. Europe Non-alcoholic Steatohepatitis Biomarkers Market Value Forecast, by Country/Sub-region, 2017–2027
10.4.1. Germany
10.4.2. U.K.
10.4.3. France
10.4.4. Spain
10.4.5. Italy
10.4.6. Rest of Europe
10.5. Europe Non-alcoholic Steatohepatitis Biomarkers Market Attractiveness Analysis
10.5.1. By Biomarker Type
10.5.2. By End-user
10.5.3. By Country/Sub-region
11. Asia Pacific Non-alcoholic Steatohepatitis Biomarkers Market Analysis and Forecast
11.1. Introduction
11.1.1. Key Findings
11.2. Asia Pacific Non-alcoholic Steatohepatitis Biomarkers Market Value Forecast, by Biomarker Type, 2017–2027
11.2.1. Serum Biomarkers
11.2.1.1. Cytokeratin-18 (CK 18) Marker
11.2.1.2. Inflammatory Markers
11.2.1.3. Others
11.2.2. Biomarker Panel
11.2.3. Fibrosis Biomarkers
11.2.4. Imaging Biomarkers
11.2.5. Others
11.3. Asia Pacific Non-alcoholic Steatohepatitis Biomarkers Market Value Forecast, by End-user, 2017–2027
11.3.1. Hospitals
11.3.2. Diagnostic Centers
11.3.3. Others
11.4. Asia Pacific Non-alcoholic Steatohepatitis Biomarkers Market Value Forecast, by Country/Sub-region, 2017–2027
11.4.1. China
11.4.2. Japan
11.4.3. India
11.4.4. Australia & New Zealand
11.4.5. Rest of Asia Pacific
11.5. Asia Pacific Non-alcoholic Steatohepatitis Biomarkers Market Attractiveness Analysis
11.5.1. By Biomarker Type
11.5.2. By End-user
11.5.3. By Country/Sub-region
12. Latin America Non-alcoholic Steatohepatitis Biomarkers Market Analysis and Forecast
12.1. Introduction
12.1.1. Key Findings
12.2. Latin America Non-alcoholic Steatohepatitis Biomarkers Market Value Forecast, by Biomarker Type, 2017–2027
12.2.1. Serum Biomarkers
12.2.1.1. Cytokeratin-18 (CK 18) Marker
12.2.1.2. Inflammatory Markers
12.2.1.3. Others
12.2.2. Biomarker Panel
12.2.3. Fibrosis Biomarkers
12.2.4. Imaging Biomarkers
12.2.5. Others
12.3. Latin America Non-alcoholic Steatohepatitis Biomarkers Market Value Forecast, by End-user, 2017–2027
12.3.1. Hospitals
12.3.2. Diagnostic Centers
12.3.3. Others
12.4. Latin America Non-alcoholic Steatohepatitis Biomarkers Market Value Forecast, by Country/Sub-region, 2017–2027
12.4.1. Brazil
12.4.2. Mexico
12.4.3. Rest of Latin America
12.5. Latin America Non-alcoholic Steatohepatitis Biomarkers Market Attractiveness Analysis
12.5.1. By Biomarker Type
12.5.2. By End-user
12.5.3. By Country/Sub-region
13. Middle East & Africa Non-alcoholic Steatohepatitis Biomarkers Market Analysis and Forecast
13.1. Introduction
13.1.1. Key Findings
13.2. Middle East & Africa Non-alcoholic Steatohepatitis Biomarkers Market Value Forecast, by Biomarker Type, 2017–2027
13.2.1. Serum Biomarkers
13.2.1.1. Cytokeratin-18 (CK 18) Marker
13.2.1.2. Inflammatory Markers
13.2.1.3. Others
13.2.2. Biomarker Panel
13.2.3. Fibrosis Biomarkers
13.2.4. Imaging Biomarkers
13.2.5. Others
13.3. Middle East & Africa Non-alcoholic Steatohepatitis Biomarkers Market Value Forecast, by End-user, 2017–2027
13.3.1. Hospitals
13.3.2. Diagnostics Centers
13.3.3. Others
13.4. Middle East & Africa Non-alcoholic Steatohepatitis Biomarkers Market Value Forecast, by Country/Sub-region, 2017–2027
13.4.1. GCC Countries
13.4.2. South Africa
13.4.3. Rest of Middle East & Africa
13.5. Middle East & Africa Non-alcoholic Steatohepatitis Biomarkers Market Attractiveness Analysis
13.5.1. By Biomarker Type
13.5.2. By End-user
13.5.3. By Country/Sub-region
14. Competitive Landscape
14.1. Market Share Analysis, by Company, 2018
14.2. Company Profiles
14.2.1. Biopredictive
14.2.1.1. Company Overview (HQ, Business Segments, Employee Strength)
14.2.1.2. Product Portfolio
14.2.1.3. Strategic Overview
14.2.1.4. SWOT Analysis
14.2.2. Quest Diagnostics
14.2.2.1. Company Overview (HQ, Business Segments, Employee Strength)
14.2.2.2. Financial Overview
14.2.2.3. Product Portfolio
14.2.2.4. Strategic Overview
14.2.2.5. SWOT Analysis
14.2.3. Exalenz Bioscience Ltd
14.2.3.1. Company Overview (HQ, Business Segments, Employee Strength)
14.2.3.2. Financial Overview
14.2.3.3. Product Portfolio
14.2.3.4. Strategic Overview
14.2.3.5. SWOT Analysis
14.2.4. GENFIT
14.2.4.1. Company Overview (HQ, Business Segments, Employee Strength)
14.2.4.2. Financial Overview
14.2.4.3. Product Portfolio
14.2.4.4. Strategic Overview
14.2.4.5. SWOT Analysis
14.2.5. Siemens Healthineers
14.2.5.1. Company Overview (HQ, Business Segments, Employee Strength)
14.2.5.2. Financial Overview
14.2.5.3. Product Portfolio
14.2.5.4. Strategic Overview
14.2.5.5. SWOT Analysis
14.2.6. ONE WAY LIVER, S.L
14.2.6.1. Company Overview (HQ, Business Segments, Employee Strength)
14.2.6.2. Product Portfolio
14.2.6.3. Strategic Overview
14.2.6.4. SWOT Analysis
14.2.7. Prometheus Laboratories Inc.
14.2.7.1. Company Overview (HQ, Business Segments, Employee Strength)
14.2.7.2. Product Portfolio
14.2.7.3. Strategic Overview
14.2.7.4. SWOT Analysis
14.2.8. Gilead Sciences Ltd.
14.2.8.1. Company Overview (HQ, Business Segments, Employee Strength)
14.2.8.2. Financial Overview
14.2.8.3. Product Portfolio
14.2.8.4. Strategic Overview
14.2.8.5. SWOT Analysis
List of Tables
Table 01: Opportunity Map, by Biomarker Type, 2018
Table 03: Global Non-alcoholic Steatohepatitis (NASH) Biomarkers Market Size (US$ Mn) Forecast, by Biomarker Type, 2017–2027
Table 04: Global Non-alcoholic Steatohepatitis (NASH) Biomarkers Market Size (US$ Mn) Forecast, by Serum Biomarker Type, 2017–2027
Table 05: Global Non-alcoholic Steatohepatitis (NASH) Biomarkers Market Value (US$ Mn) Forecast, by End-user, 2017–2027
Table 06: Global Non-alcoholic Steatohepatitis (NASH) Biomarkers Market Size (US$ Mn) Forecast, by Region, 2017–2027
Table 07: North America Non-alcoholic Steatohepatitis (NASH) Biomarkers Market Value (US$ Mn) Forecast, by Biomarker Type, 2017–2027
Table 08: North America Non-alcoholic Steatohepatitis (NASH) Biomarkers Market Value (US$ Mn) Forecast, by Serum Biomarker Type, 2017–2027
Table 09: North America Non-alcoholic Steatohepatitis (NASH) Biomarkers Market Value (US$ Mn) Forecast, by End-user, 2017–2027
Table 10: North America Non-alcoholic Steatohepatitis (NASH) Biomarkers Market Value (US$ Mn) Forecast, by Country, 2017–2027
Table 11: Europe Non-alcoholic Steatohepatitis (NASH) Biomarkers Market Value (US$ Mn) Forecast, by Biomarker Type, 2017–2027
Table 12: Europe Non-alcoholic Steatohepatitis (NASH) Biomarkers Market Value (US$ Mn) Forecast, by Serum Biomarker Type, 2017–2027
Table 13: Europe Non-alcoholic Steatohepatitis (NASH) Biomarkers Market Value (US$ Mn) Forecast, by End-user, 2017–2027
Table 14: Europe Non-alcoholic Steatohepatitis (NASH) Biomarkers Market Value (US$ Mn) Forecast, by Country/Sub-region, 2017–2027
Table 15: Asia Pacific Non-alcoholic Steatohepatitis (NASH) Biomarkers Market Value (US$ Mn) Forecast, by Biomarker Type, 2017–2027
Table 16: Asia Pacific Non-alcoholic Steatohepatitis (NASH) Biomarkers Market Value (US$ Mn) Forecast, by Serum Biomarker Type, 2017–2027
Table 17: Asia Pacific Non-alcoholic Steatohepatitis (NASH) Biomarkers Market Value (US$ Mn) Forecast, by End-user, 2017–2027
Table 18: Asia Pacific Non-alcoholic Steatohepatitis (NASH) Biomarkers Market Value (US$ Mn) Forecast, by Country/Sub-region, 2017–2027
Table 19: Latin America Non-alcoholic Steatohepatitis (NASH) Biomarkers Market Value (US$ Mn) Forecast, by Biomarker Type, 2017–2027
Table 20: Latin America Non-alcoholic Steatohepatitis (NASH) Biomarkers Market Value (US$ Mn) Forecast, by Serum Biomarker Type, 2017–2027
Table 21: Latin America Non-alcoholic Steatohepatitis (NASH) Biomarkers Market Value (US$ Mn) Forecast, by End-user, 2017–2027
Table 22: Latin America Non-alcoholic Steatohepatitis (NASH) Biomarkers Market Value (US$ Mn) Forecast, by Country/Sub-region, 2017–2027
Table 23: Middle East & Africa Non-alcoholic Steatohepatitis (NASH) Biomarkers Market Value (US$ Mn) Forecast, by Biomarker Type, 2017–2027
Table 24: Middle East & Africa Non-alcoholic Steatohepatitis (NASH) Biomarkers Market Value (US$ Mn) Forecast, by Serum Biomarker Type, 2017–2027
Table 25: Middle East & Africa Non-alcoholic Steatohepatitis (NASH) Biomarkers Market Value (US$ Mn) Forecast, by End-user, 2017–2027
Table 26: Middle East & Africa Non-alcoholic Steatohepatitis (NASH) Biomarkers Market Value (US$ Mn) Forecast, by Country/Sub-region, 2017–2027
List of Figures
Figure 01: Global Non-alcoholic Steatohepatitis Market Size (US$ Mn) and Distribution, by Region, 2018 and 2027
Figure 02: Market Share Analysis, by Region, 2018
Figure 03: Global Non-alcoholic Steatohepatitis Biomarker Market Revenue Projection (US$ Mn), 2017–2027
Figure 04 : Market Value Share, by Biomarker Type, 2018
Figure 05: Market Value Share, by End-user, 2018
Figure 06: Market Value Share, by Region, 2018
Figure 07: Global Non-alcoholic Steatohepatitis (NASH) Biomarkers Market Value Share, by Biomarker Type, 2018 and 2027
Figure 08: Global Non-alcoholic Steatohepatitis (NASH) Biomarkers Market Attractiveness, by Biomarker Type, 2019–2027
Figure 09: Global Non-alcoholic Steatohepatitis (NASH) Biomarkers Market Revenue (US$ Mn) Forecast and Y-o-Y Growth (%) Projection, by Serum Biomarkers, 2017–2027
Figure 10: Global Non-alcoholic Steatohepatitis (NASH) Biomarkers Market Revenue (US$ Mn) Forecast and Y-o-Y Growth (%) Projection, by Biomarker Panel, 2017–2027
Figure 11: Global Non-alcoholic Steatohepatitis (NASH) Biomarkers Market Revenue (US$ Mn) Forecast and Y-o-Y Growth (%) Projection, by Fibrosis Biomarkers, 2017–2027
Figure 12: Global Non-alcoholic Steatohepatitis (NASH) Biomarkers Market Revenue (US$ Mn) Forecast and Y-o-Y Growth (%) Projection, by Imaging Biomarkers , 2017–2027
Figure 13: Global Non-alcoholic Steatohepatitis (NASH) Biomarkers Market Revenue (US$ Mn) Forecast and Y-o-Y Growth (%) Projection, by Others, 2017–2027
Figure 14: Global Non-alcoholic Steatohepatitis (NASH) Biomarkers Market Value Share, by End-user, 2018 and 2027
Figure 15: Global Non-alcoholic Steatohepatitis (NASH) Biomarkers Market Attractiveness, by End-user, 2019–2027
Figure 16: Global Non-alcoholic Steatohepatitis (NASH) Biomarkers Market Revenue (US$ Mn) and Y-o-Y Growth (%), by Hospitals, 2019–2027
Figure 17: Global Non-alcoholic Steatohepatitis (NASH) Biomarkers Market Revenue (US$ Mn) and Y-o-Y Growth (%), by Diagnostic Centers, 2019–2027
Figure 18: Global Non-alcoholic Steatohepatitis (NASH) Biomarkers Market Revenue (US$ Mn) and Y-o-Y Growth (%), by Others, 2019–2027
Figure 19: Global Non-alcoholic Steatohepatitis (NASH) Biomarkers Market Value Share, by Region, 2018 and 2027
Figure 20: Global Non-alcoholic Steatohepatitis (NASH) Biomarkers Market Attractiveness, by Region, 2019–2027
Figure 21: North America Non-alcoholic Steatohepatitis (NASH) Biomarkers Market Size (US$ Mn) Forecast and Y-o-Y Growth (%) Projection, 2019–2027
Figure 22: North America Non-alcoholic Steatohepatitis (NASH) Biomarkers Market Value Share, by Biomarker Type, 2018 and 2027
Figure 23: North America Non-alcoholic Steatohepatitis (NASH) Biomarkers Market Attractiveness, by Biomarker Type, 2019–2027
Figure 24: North America Non-alcoholic Steatohepatitis (NASH) Biomarkers Market Value Share, by End-user, 2018 and 2027
Figure 25: North America Non-alcoholic Steatohepatitis (NASH) Biomarkers Market Attractiveness, by End-user, 2019–2027
Figure 26: North America Non-alcoholic Steatohepatitis (NASH) Biomarkers Market Value Share, by Country, 2018 and 2027
Figure 27: North America Non-alcoholic Steatohepatitis ( NASH) Biomarkers Market Attractiveness, by Country, 2019–2027
Figure 28: Europe Non-alcoholic Steatohepatitis (NASH) Biomarkers Market Size (US$ Mn) Forecast and Y-o-Y Growth (%) Projection, 2019–2027
Figure 29: Europe Non-alcoholic Steatohepatitis ( NASH) Biomarkers Market Value Share, by Biomarker Type, 2018 and 2027
Figure 30: Europe Non-alcoholic Steatohepatitis (NASH) Biomarkers Market Attractiveness, by Biomarker Type, 2019–2027
Figure 31: Europe Non-alcoholic Steatohepatitis (NASH) Biomarkers Market Value Share, by End-user, 2018 and 2027
Figure 32: Europe Non-alcoholic Steatohepatitis (NASH) Biomarkers Market Attractiveness, by End-user, 2019–2027
Figure 33: Europe Non-alcoholic Steatohepatitis (NASH) Biomarkers Market Value Share, by Country/Sub-region, 2018 and 2027
Figure 34: Europe Non-alcoholic Steatohepatitis (NASH) Biomarkers Market Attractiveness, by Country/Sub-region, 2019–2027
Figure 35: Asia Pacific Non-alcoholic Steatohepatitis (NASH) Biomarkers Market Size (US$ Mn) Forecast and Y-o-Y Growth (%) Projection, 2019–2027
Figure 36: Asia Pacific Non-alcoholic Steatohepatitis (NASH) Biomarkers Market Value Share, by Biomarker Type, 2018 and 2027
Figure 37: Asia Pacific Non-alcoholic Steatohepatitis (NASH) Biomarkers Market Attractiveness, by Biomarker Type, 2019–2027
Figure 38: Asia Pacific Non-alcoholic Steatohepatitis (NASH) Biomarkers Market Value Share, by End-user, 2018 and 2027
Figure 39: Asia Pacific Non-alcoholic Steatohepatitis (NASH) Biomarkers Market Attractiveness, by End-user, 2019–2027
Figure 40: Asia Pacific Non-alcoholic Steatohepatitis (NASH) Biomarkers Market Value Share, by Country/Sub-region, 2018 and 2027
Figure 41: Asia Pacific Non-alcoholic Steatohepatitis (NASH) Biomarkers Market Attractiveness, by Country/Sub-region, 2019–2027
Figure 42: Latin America Non-alcoholic Steatohepatitis (NASH) Biomarkers Market Size (US$ Mn) Forecast and Y-o-Y Growth (%) Projection, 2019–2027
Figure 43: Latin America Non-alcoholic Steatohepatitis (NASH) Biomarkers Market Value Share, by Biomarker Type, 2018 and 2027
Figure 44: Latin America Non-alcoholic Steatohepatitis (NASH) Biomarkers Market Attractiveness, by Biomarker Type, 2019–2027
Figure 45: Latin America Non-alcoholic Steatohepatitis (NASH) Biomarkers Market Value Share, by End-user, 2018 and 2027
Figure 46: Latin America Non-alcoholic Steatohepatitis (NASH) Biomarkers Market Attractiveness, by End-user, 2019–2027
Figure 47: Latin America Non-alcoholic Steatohepatitis (NASH) Biomarkers Market Value Share, by Country/Sub-region, 2018 and 2027
Figure 48: Latin America Non-alcoholic Steatohepatitis (NASH) Biomarkers Market Attractiveness, by Country/Sub-region, 2019–2027
Figure 49: Middle East & Africa Non-alcoholic Steatohepatitis (NASH) Biomarkers Market Size (US$ Mn) Forecast and Y-o-Y Growth (%) Projection, 2019–2027
Figure 50: Middle East & Africa Non-alcoholic Steatohepatitis (NASH) Biomarkers Market Value Share, by Biomarker Type, 2018 and 2027
Figure 51: Middle East & Africa Non-alcoholic Steatohepatitis (NASH) Biomarkers Market Attractiveness, by Biomarker Type, 2019–2027
Figure 52: Middle East & Africa Non-alcoholic Steatohepatitis (NASH) Biomarkers Market Value Share, by End-user, 2018 and 2027
Figure 53: Middle East & Africa Non-alcoholic Steatohepatitis (NASH) Biomarkers Market Attractiveness, by End-user, 2019–2027
Figure 54: Middle East & Africa Non-alcoholic Steatohepatitis (NASH) Biomarkers Market Value Share, by Country/Sub-region, 2018 and 2027
Figure 55: Middle East & Africa Non-alcoholic Steatohepatitis (NASH) Biomarkers Market Attractiveness, by Country/Sub-region, 2019–2027
Figure 56: Global Non-alcoholic Steatohepatitis (NASH) Biomarkers Market Position Analysis, by Company (2018)
Figure 57: Quest Diagnostics, Research & Development (US$ Mn), 2016–2018
Figure 58: Quest Diagnostics, Revenue (US$ Mn) and Y-o-Y Growth (%), 2015–2018
Figure 59: Quest Diagnostics, Breakdown of Net Sales, by Business Segment, 2018
Figure 60: Exalenz Bioscience Ltd , Breakdown of Net Sales, by Region, 2018
Figure 61: Exalenz Bioscience Ltd , Research & Development (US$ Mn), 2016–2018
Figure 62: Exalenz Bioscience Ltd , Revenue (US$ Mn) and Y-o-Y Growth (%), 2015–2018
Figure 63: Exalenz Bioscience Ltd , Breakdown of Net Sales, by Business Segment, 2018
Figure 64: GENFIT, Breakdown of Net Sales, by Region, 2018
Figure 65: GENFIT, Research & Development (US$ Mn), 2016–2018
Figure 66: GENFIT, Revenue (US$ Mn) and Y-o-Y Growth (%), 2015–2018
Figure 67: GENFIT, Breakdown of Net Sales, by Business Segment, 2018
Figure 68: Siemens Healthineers, Breakdown of Net Sales, by Region, 2018
Figure 69: Siemens Healthineers, Research & Development (US$ Mn), 2016–2018
Figure 70: Siemens Healthineers, Revenue (US$ Mn) and Y-o-Y Growth (%), 2015–2018
Figure 71: Siemens Healthineers, Breakdown of Net Sales, by Business Segment, 2018
Figure 72: Gilead Sciences, Inc., Breakdown of Net Sales, by Region, 2018
Figure 73: Gilead Sciences, Inc., Research & Development (US$ Mn), 2016–2018
Figure 74: Gilead Sciences, Inc., Revenue (US$ Mn) and Y-o-Y Growth (%), 2015–2018
Figure 75: Gilead Sciences, Inc., Breakdown of Net Sales, by Business Segment, 2018
Copyright © Transparency Market Research, Inc. All Rights reserved
Trust Online

Non-alcoholic Steatohepatitis (NASH) Biomarkers Market