
Reports
Reports
Brain injuries of various types and neurological diseases are one of the main causes of deaths worldwide. Hence, researchers are tapping into opportunities through glucose metabolism modification for the development of new drugs that could revolutionize the treatment of neurological disorders. For instance, Gero Discovery - a supplier of novel therapeutic options for neurodegenerative diseases, announced that they have found a potential drug that can help prevent neuronal deaths with the technique of glucose metabolism modification in stressed neurons. Thus, companies in the neurological disorder drugs market should collaborate with talented researchers to develop new drugs.
Companies in the neurological disorder drugs market are increasing animal testing and obtaining promising results for future use of drugs made with glucose metabolism modification in humans. This new technique has the potential to treat Amyotrophic lateral sclerosis, Alzheimer’s, and traumatic brain injuries, among others, in the market for neurological disorder drugs. As such, companies in the market for neurological disorder drugs are capitalizing on the demand for drugs used in the treatment of Alzheimer’s, since the disorder is estimated to account for the second-highest revenue in the market by 2027.
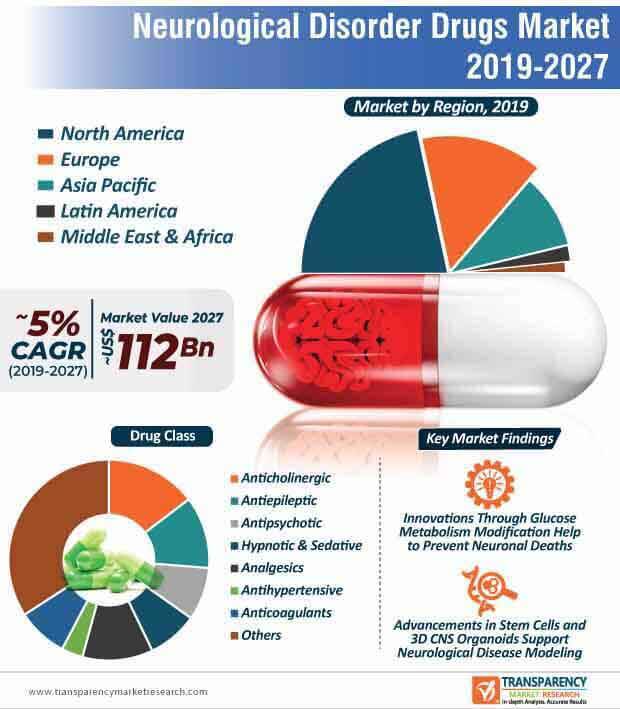
The Central Nervous System (CNS) drug discovery is largely dependent on traditional approaches related to rodent models or cell-based in vitro models. This practice creates a challenge for drug manufacturers, since species differences between humans and rodents are difficult for the correlation of robust data in neurodevelopmental studies. This explains a modest ~5% CAGR of the neurological disorder drugs market. Hence, companies are advancing in the field of stem cells and 3D CNS organoids, since novel tools have close resemblance to the human brain architecture and functions.
CNS organoids provide innovative opportunities to mimic the human brain physiology and acts as a unique modeling tool for the assessment of normal versus pathological brain. CNS organoids are being highly publicized in the market for neurological disorder drugs for elucidation of mechanisms of neurological disorders. This is evident since the revenue of cerebrovascular disorders is projected to aggressively grow in the market for neurological disorder drugs.
Several large-cap pharmaceutical companies are partnering with small biotech companies and academic institutes to innovate in CNS drugs, while regulatory bodies are searching for ways to address the void in effective drug development. Companies in the neurological disorder drugs market are increasing R&D in neuroscience, since the U.S. FDA approved Sage Therapeutics Inc.'s first-of-its-kind postpartum depression therapy Zulresso. With the U.S. being one of the leading countries in North America, the neurological disorder drugs market in the region is anticipated for exponential growth. Moreover, further innovations in CNS drugs, the neurological disorder drugs market is estimated to reach a value of ~US$ 112 Bn by the end of 2027.
The field of neuroscience is undergoing a phase of renaissance. This is evident since the FDA stated that organization is witnessing an explosion of new scientific knowledge addressing difficult-to-treat CNS disorders. Investors in the market for neurological disorder drugs are taking note of the FDA’s shifting attitude toward tough-to-treat CNS disorders.
Companies in the neurological disorder drugs market are adopting new therapeutic approaches for the treatment of the Parkinson’s disease. They are increasing research to understand genetic risk factors associated with the disease for improved drug development. Hence, alterations in the GBA1 gene is emerging as a promising approach for drug development. However, mutations in the gene may result in defects of GCase (glucocerebrosidase) enzymes. Hence, companies in the neurological disorder drugs market are focusing on activating wild type GCase for the development of new drug compounds that can be used in the treatment of Parkinson’s.
The market for neurological disorder drugs is undergoing a change with increased experiments associated with the activation of wild type GCase, resulting in therapeutic benefits among patients.
Analysts’ Viewpoint
Antiepileptic and anticholinergic drugs are projected to witness exponential growth in demand in the neurological disorder drugs market. Since big pharmaceutical companies are exiting the neurology space, small biotech companies are stepping up to introduce new neurology drugs. However, clinical trials in neuroscience are expensive to run and the success rate is much lower than that of other disease indications. Hence, companies should identify new genes that lead to new pathways in drug delivery for Alzheimer’s and Parkinson’s. Apart from North America, companies should invest in Asia Pacific since the region is projected for exponential growth during the forecast period. Influx of money flow in the field of CNS is one of the key drivers contributing to market growth.
Neurological disorder drugs market to reach valuation of ~US$ 112 Bn by 2027
Neurological disorder drugs market is projected to expand at a CAGR of ~5% from 2019 to 2027
Neurological disorder drugs market is driven by rise in prevalence of neurology disorders among geriatric population and increase in therapeutic treatments
The cerebrovascular diseases segment dominated the global neurological disorder drugs market and the trend is likely to continue during the forecast period
Key players in the global neurological disorder drugs market include Novartis AG, GlaxoSmithKline plc, F. Hoffmann-La Roche Ltd., Pfizer, Bayer AG
1. Preface
1.1. Market Definition and Scope
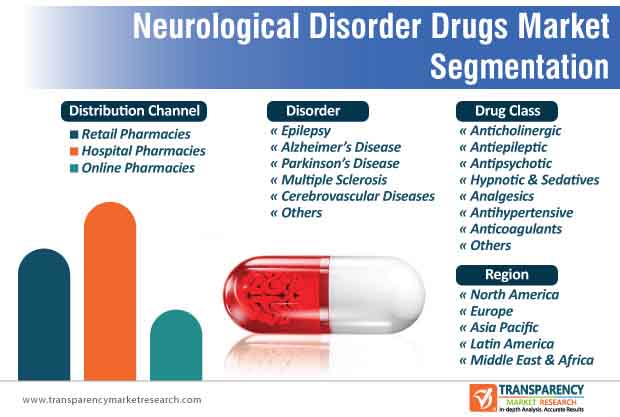
1.2. Market Segmentation
1.3. Key Research Objectives
1.4. Research Highlights
2. Assumptions and Research Methodology
3. Executive Summary: Global Neurological Disorder Drugs Market
4. Market Overview
4.1. Introduction & Overview
4.2. Product Overview
4.3. Market Dynamics
4.3.1. Drivers
4.3.2. Restraints
4.3.3. Opportunities
4.4. Global Neurological Disorder Drugs Market Analysis and Forecast, 2017–2027
5. Market Outlook
5.1. Pipeline Analysis
5.2. Disease Prevalence & Incidence Rate globally with key countries
5.3. Regulatory Scenario
6. Global Neurological Disorder Drugs Market Analysis and Forecast, by Disorder
6.1. Introduction & Definition
6.2. Global Neurological Disorder Drugs Market Value (US$ Mn) Forecast, by Disorder, 2017–2027
6.2.1. Epilepsy
6.2.2. Alzheimer Disease
6.2.3. Multiple Sclerosis
6.2.4. Parkinson Disease
6.2.5. Cerebrovascular Diseases
6.2.6. Others
6.3. Global Neurological Disorder Drugs Market Attractiveness Analysis, by Disorder
7. Global Neurological Disorder Drugs Market Analysis and Forecast, by Drug Class
7.1. Introduction & Definition
7.2. Global Neurological Disorder Drugs Market Value (US$) Forecast, by Drug Class, 2017–2027
7.2.1. Anticholinergic
7.2.2. Antiepileptic
7.2.3. Antipsychotic
7.2.4. Analgesic
7.2.5. Hypnotic & Sedative
7.2.6. Antihypertensive
7.2.7. Anticoagulants
7.2.8. Others
7.3. Global Neurological Disorder Drugs Market Attractiveness Analysis, by Drug Class
8. Global Neurological Disorder Drugs Market Analysis and Forecast, by Distribution Channel
8.1. Introduction & Definition
8.2. Global Neurological Disorder Drugs Market Value (US$ Mn) Forecast, by Distribution Channel, 2017–2027
8.2.1. Hospital Pharmacies
8.2.2. Retail Pharmacies
8.2.3. Online Pharmacies
8.3. Global Neurological Disorder Drugs Market Attractiveness Analysis, by Distribution Channel
9. Global Neurological Disorder Drugs Market Analysis and Forecast, by Region
9.1. Key Findings
9.2. Global Neurological Disorder Drugs Market Value (US$ Mn) Forecast, by Region
9.2.1. North America
9.2.2. Europe
9.2.3. Asia Pacific
9.2.4. Latin America
9.2.5. Middle East & Africa
9.3. Global Neurological Disorder Drugs Market Attractiveness Analysis, by Region
10. North America Neurological Disorder Drugs Market Analysis and Forecast
10.1. Introduction
10.2. North America Neurological Disorder Drugs Market Value (US$ Mn) Forecast, by Disorder, 2017–2027
10.2.1. Epilepsy
10.2.2. Alzheimer Disease
10.2.3. Multiple Sclerosis
10.2.4. Parkinson Disease
10.2.5. Cerebrovascular Diseases
10.2.6. Others
10.3. North America Neurological Disorder Drugs Market Value (US$ Mn) Forecast, by Drug Class, 2017–2027
10.3.1. Anticholinergic
10.3.2. Antiepileptic
10.3.3. Antipsychotic
10.3.4. Analgesic
10.3.5. Hypnotic & Sedative
10.3.6. Antihypertensive
10.3.7. Anticoagulants
10.3.8. Others
10.4. North America Neurological Disorder Drugs Market Value (US$ Mn) Forecast, by Distribution Channel, 2017–2027
10.4.1. Hospital Pharmacies
10.4.2. Retail Pharmacies
10.4.3. Online Pharmacies
10.5. North America Neurological Disorder Drugs Market Value (US$ Mn) Forecast, by Country/Sub-region, 2017–2027
10.5.1. U.S.
10.5.2. Canada
10.6. North America Neurological Disorder Drugs Market Attractiveness Analysis
10.6.1. By Disorder
10.6.2. By Drug Class
10.6.3. By Distribution Channel
10.6.4. By Country
11. Europe Neurological Disorder Drugs Market Analysis and Forecast
11.1. Introduction
11.2. Europe Neurological Disorder Drugs Market Value (US$ Mn) Forecast, by Disorder, 2017–2027
11.2.1. Epilepsy
11.2.2. Alzheimer Disease
11.2.3. Multiple Sclerosis
11.2.4. Parkinson Disease
11.2.5. Cerebrovascular Diseases
11.2.6. Others
11.3. Europe Neurological Disorder Drugs Market Value (US$ Mn) Forecast, by Drug Class, 2017–2027
11.3.1. Anticholinergic
11.3.2. Antiepileptic
11.3.3. Antipsychotic
11.3.4. Analgesic
11.3.5. Hypnotic & Sedative
11.3.6. Antihypertensive
11.3.7. Anticoagulants
11.3.8. Others
11.4. Europe Neurological Disorder Drugs Market Value (US$ Mn) Forecast, by Distribution Channel, 2017–2027
11.4.1. Hospital Pharmacies
11.4.2. Retail Pharmacies
11.4.3. Online Pharmacies
11.5. Europe Neurological Disorder Drugs Market Value (US$ Mn) Forecast, by Country/Sub-region, 2017–2027
11.5.1. Germany
11.5.2. U.K.
11.5.3. France
11.5.4. Spain
11.5.5. Italy
11.5.6. Rest of Europe
11.6. Europe Neurological Disorder Drugs Market Attractiveness Analysis
11.6.1. By Disorder
11.6.2. By Drug Class
11.6.3. By Distribution Channel
11.6.4. By Country/Sub-region
12. Asia Pacific Neurological Disorder Drugs Market Analysis and Forecast
12.1. Introduction
12.2. Asia Pacific Neurological Disorder Drugs Market Value (US$ Mn) Forecast, by Disorder, 2017–2027
12.2.1. Epilepsy
12.2.2. Alzheimer Disease
12.2.3. Multiple Sclerosis
12.2.4. Parkinson Disease
12.2.5. Cerebrovascular Diseases
12.2.6. Others
12.3. Asia Pacific Neurological Disorder Drugs Market Value (US$ Mn) Forecast, by Drug Class, 2017–2027
12.3.1. Anticholinergic
12.3.2. Antiepileptic
12.3.3. Antipsychotic
12.3.4. Analgesic
12.3.5. Hypnotic & Sedative
12.3.6. Antihypertensive
12.3.7. Anticoagulants
12.3.8. Others
12.4. Asia Pacific Neurological Disorder Drugs Market Value (US$ Mn) Forecast, by Distribution Channel, 2017–2027
12.4.1. Hospital Pharmacies
12.4.2. Retail Pharmacies
12.4.3. Online Pharmacies
12.5. Asia Pacific Neurological Disorder Drugs Market Value (US$ Mn) Forecast, by Country/Sub-region, 2017–2027
12.5.1. China
12.5.2. Japan
12.5.3. India
12.5.4. Australia & New Zealand
12.5.5. Rest of Asia Pacific
12.6. Asia Pacific Neurological Disorder Drugs Market Attractiveness Analysis
12.6.1. By Disorder
12.6.2. By Drug Class
12.6.3. By Distribution Channel
12.6.4. By Country/Sub-region
13. Latin America Neurological Disorder Drugs Market Analysis and Forecast
13.1. Introduction
13.2. Latin America Neurological Disorder Drugs Market Value (US$ Mn) Forecast, by Disorder, 2017–2027
13.2.1. Epilepsy
13.2.2. Alzheimer Disease
13.2.3. Multiple Sclerosis
13.2.4. Parkinson Disease
13.2.5. Cerebrovascular Diseases
13.2.6. Others
13.3. Latin America Neurological Disorder Drugs Market Value (US$ Mn) Forecast, by Drug Class, 2017–2027
13.3.1. Anticholinergic
13.3.2. Antiepileptic
13.3.3. Antipsychotic
13.3.4. Analgesic
13.3.5. Hypnotic & Sedative
13.3.6. Antihypertensive
13.3.7. Anticoagulants
13.3.8. Others
13.4. Latin America Neurological Disorder Drugs Market Value (US$ Mn) Forecast, by Distribution Channel, 2017–2027
13.4.1. Hospital Pharmacies
13.4.2. Retail Pharmacies
13.4.3. Online Pharmacies
13.5. Latin America Neurological Disorder Drugs Market Value (US$ Mn) Forecast, by Country/Sub-region, 2017–2027
13.5.1. Brazil
13.5.2. Mexico
13.5.3. Rest of Latin America
13.6. Latin America Neurological Disorder Drugs Market Attractiveness Analysis
13.6.1. By Disorder
13.6.2. By Drug Class
13.6.3. By Distribution Channel
13.6.4. By Country/Sub-region
14. Middle East & Africa Neurological Disorder Drugs Market Analysis and Forecast
14.1. Introduction
14.2. Middle East & Africa Neurological Disorder Drugs Market Value (US$ Mn) Forecast, by Disorder, 2017–2027
14.2.1. Epilepsy
14.2.2. Alzheimer Disease
14.2.3. Multiple Sclerosis
14.2.4. Parkinson Disease
14.2.5. Cerebrovascular Diseases
14.2.6. Others
14.3. Middle East & Africa Neurological Disorder Drugs Market Value (US$ Mn) Forecast, by Drug Class, 2017–2027
14.3.1. Anticholinergic
14.3.2. Antiepileptic
14.3.3. Antipsychotic
14.3.4. Analgesic
14.3.5. Hypnotic & Sedative
14.3.6. Antihypertensive
14.3.7. Anticoagulants
14.3.8. Others
14.4. Middle East & Africa Neurological Disorder Drugs Market Value (US$ Mn) Forecast, by Distribution Channel, 2017–2027
14.4.1. Hospital Pharmacies
14.4.2. Retail Pharmacies
14.4.3. Online Pharmacies
14.5. Middle East & Africa Neurological Disorder Drugs Market Value (US$ Mn) Forecast, by Country/Sub-region, 2017–2027
14.5.1. GCC Countries
14.5.2. South Africa
14.5.3. Rest of Middle East & Africa
14.6. Middle East & Africa Neurological Disorder Drugs Market Attractiveness Analysis
14.6.1. By Disorder
14.6.2. By Drug Class
14.6.3. By Distribution Channel
14.6.4. By Country/Sub-region
15. Competition Landscape
15.1. Competition Matrix
15.2. Market Share Analysis, by Company, 2018
15.3. Company Profiles
15.3.1. Novartis AG
15.3.1.1. Company Overview (HQ, Business Segments, Employee Strength)
15.3.1.2. Company Financials
15.3.1.3. Growth Strategies
15.3.1.4. SWOT Analysis
15.3.2. GlaxoSmithKline plc
15.3.2.1. Company Overview (HQ, Business Segments, Employee Strength)
15.3.2.2. Company Financials
15.3.2.3. Growth Strategies
15.3.2.4. SWOT Analysis
15.3.3. F. Hoffmann-La Roche Ltd.
15.3.3.1. Company Overview (HQ, Business Segments, Employee Strength)
15.3.3.2. Company Financials
15.3.3.3. Growth Strategies
15.3.3.4. SWOT Analysis
15.3.4. Pfizer, Inc.
15.3.4.1. Company Overview (HQ, Business Segments)
15.3.4.2. Company Financials
15.3.4.3. Growth Strategies
15.3.4.4. SWOT Analysis
15.3.5. Bayer AG
15.3.5.1. Company Overview (HQ, Business Segments, Employee Strength)
15.3.5.2. Company Financials
15.3.5.3. Growth Strategies
15.3.5.4. SWOT Analysis
15.3.6. Boehringer Ingelheim International GmbH
15.3.6.1. Company Overview (HQ, Business Segments)
15.3.6.2. Company Financials
15.3.6.3. Growth Strategies
15.3.6.4. SWOT Analysis
15.3.7. AstraZeneca plc
15.3.7.1. Company Overview (HQ, Business Segments)
15.3.7.2. Company Financials
15.3.7.3. Growth Strategies
15.3.7.4. SWOT Analysis
15.3.8. Teva Pharmaceutical Industries Ltd.
15.3.8.1. Company Overview (HQ, Business Segments, Employee Strength)
15.3.8.2. Company Financials
15.3.8.3. Growth Strategies
15.3.8.4. SWOT Analysis
15.3.9. Merck & Co., Inc.
15.3.9.1. Company Overview (HQ, Business Segments, Employee Strength)
15.3.9.2. Company Financials
15.3.9.3. Growth Strategies
15.3.9.4. SWOT Analysis
15.3.10. Otsuka Pharmaceutical Co., Ltd.
15.3.10.1. Company Overview (HQ, Business Segments, Employee Strength)
15.3.10.2. Company Financials
15.3.10.3. Growth Strategies
15.3.10.4. SWOT Analysis
15.3.11. Amgen, Inc.
15.3.11.1. Company Overview (HQ, Business Segments, Employee Strength)
15.3.11.2. Company Financials
15.3.11.3. Growth Strategies
15.3.11.4. SWOT Analysis
15.3.12. UCB S.A.
15.3.12.1. Company Overview (HQ, Business Segments, Employee Strength)
15.3.12.2. Company Financials
15.3.12.3. Growth Strategies
15.3.12.4. SWOT Analysis
15.3.13. Eli Lilly and Company
15.3.13.1. Company Overview (HQ, Business Segments, Employee Strength)
15.3.13.2. Company Financials
15.3.13.3. Growth Strategies
15.3.13.4. SWOT Analysis
15.3.14. Biogen
15.3.14.1. Company Overview (HQ, Business Segments, Employee Strength)
15.3.14.2. Company Financials
15.3.14.3. Growth Strategies
15.3.14.4. SWOT Analysis
List of Tables
Table 01: Global Neurological Disorder Drugs Market Value (US$ Mn) Forecast, by Disorder, 2017–2027
Table 02: Global Neurological Disorder Drugs Market Value (US$ Mn) Forecast, by Drug Class, 2017–2027
Table 03: Global Neurological Disorder Drugs Market Value (US$ Mn) Forecast, by Distribution Channel, 2017–2027
Table 04: Global Neurological Disorder Drugs Market Value (US$ Mn) Forecast, by Region, 2017–2027
Table 05: North America Neurological Disorder Drugs Market Value (US$ Mn) Forecast, by Disorder, 2017–2027
Table 06: North America Neurological Disorder Drugs Market Value (US$ Mn) Forecast, by Drug Class, 2017–2027
Table 07: North America Neurological Disorder Drugs Market Value (US$ Mn) Forecast, by Distribution Channel, 2017–2027
Table 08: North America Neurological Disorder Drugs Market Value (US$ Mn) Forecast, by Country, 2017–2027
Table 09: Europe Neurological Disorder Drugs Market Value (US$ Mn) Forecast, by Disorder, 2017–2027
Table 10: Europe Neurological Disorder Drugs Market Value (US$ Mn) Forecast, by Drug Class, 2017–2027
Table 11: Europe Neurological Disorder Drugs Market Value (US$ Mn) Forecast, by Distribution Channel, 2017–2027
Table 12: Europe Neurological Disorder Drugs Market Value (US$ Mn) Forecast, by Country/Sub-region, 2017–2027
Table 13: Asia Pacific Neurological Disorder Drugs Market Value (US$ Mn) Forecast, by Disorder, 2017–2027
Table 14: Asia Pacific Neurological Disorder Drugs Market Value (US$ Mn) Forecast, by Drug Class, 2017–2027
Table 15: Asia Pacific Neurological Disorder Drugs Market Value (US$ Mn) Forecast, by Distribution Channel, 2017–2027
Table 16: Asia Pacific Neurological Disorder Drugs Market Value (US$ Mn) Forecast, by Country/Sub-region, 2017–2027
Table 17: Latin America Neurological Disorder Drugs Market Value (US$ Mn) Forecast, by Disorder, 2017–2027
Table 18: Latin America Neurological Disorder Drugs Market Value (US$ Mn) Forecast, by Drug Class, 2017–2027
Table 19: Latin America Neurological Disorder Drugs Market Value (US$ Mn) Forecast, by Distribution Channel, 2017–2027
Table 20: Latin America Neurological Disorder Drugs Market Value (US$ Mn) Forecast, by Country/Sub-region, 2017–2027
Table 21: Middle East & Africa Neurological Disorder Drugs Market Value (US$ Mn) Forecast, by Disorder, 2017–2027
Table 22: Middle East & Africa Neurological Disorder Drugs Market Value (US$ Mn) Forecast, by Drug Class, 2017–2027
Table 23: Middle East & Africa Neurological Disorder Drugs Market Value (US$ Mn) Forecast, by Distribution Channel, 2017–2027
Table 24: Middle East & Africa Neurological Disorder Drugs Market Value (US$ Mn) Forecast, by Country/Sub-region, 2017–2027
List of Figures
Figure 01: Global Neurological Disorder Drugs Market Value (US$ Mn) and Distribution (%), by Region, 2018 and 2027
Figure 02: Global Neurological Disorder Drugs Market Value (US$ Mn) Forecast, 2017–2027
Figure 03: Global Neurological Disorder Drugs Market Value Share Analysis, by Disorder, 2018 and 2027
Figure 04: Global Neurological Disorder Drugs Market Revenue (US$ Mn) and Y-o-Y Growth (%), by Epilepsy, 2017–2027
Figure 05: Global Neurological Disorder Drugs Market Revenue (US$ Mn) and Y-o-Y Growth (%), by Alzheimer’s Disease, 2017–2027
Figure 06: Global Neurological Disorder Drugs Market Revenue (US$ Mn) and Y-o-Y Growth (%), by Parkinson’s Disease, 2017–2027
Figure 07: Global Neurological Disorder Drugs Market Revenue (US$ Mn) and Y-o-Y Growth (%), by Multiple Sclerosis, 2017–2027
Figure 08: Global Neurological Disorder Drugs Market Revenue (US$ Mn) and Y-o-Y Growth (%), by Cerebrovascular Diseases, 2017–2027
Figure 09: Global Neurological Disorder Drugs Market Revenue (US$ Mn) and Y-o-Y Growth (%), by Others, 2017–2027
Figure 10: Global Neurological Disorder Drugs Market Attractiveness Analysis, by Disorder, 2019–2027
Figure 11: Global Neurological Disorder Drugs Market Value Share Analysis, by Drug Class, 2018 and 2027
Figure 12: Global Neurological Disorder Drugs Market Revenue (US$ Mn) and Y-o-Y Growth (%), by Anticholinergic, 2017–2027
Figure 13: Global Neurological Disorder Drugs Market Revenue (US$ Mn) and Y-o-Y Growth (%), by Antiepileptic, 2017–2027
Figure 14: Global Neurological Disorder Drugs Market Revenue (US$ Mn) and Y-o-Y Growth (%), by Antipsychotic, 2017–2027
Figure 15: Global Neurological Disorder Drugs Market Revenue (US$ Mn) and Y-o-Y Growth (%), by Analgesic, 2017–2027
Figure 16: Global Neurological Disorder Drugs Market Revenue (US$ Mn) and Y-o-Y Growth (%), by Hypnotic & Sedative, 2017–2027
Figure 17: Global Neurological Disorder Drugs Market Revenue (US$ Mn) and Y-o-Y Growth (%), by Antihypertensive, 2017–2027
Figure 18: Global Neurological Disorder Drugs Market Revenue (US$ Mn) and Y-o-Y Growth (%), by Anticoagulant, 2017–2027
Figure 19: Global Neurological Disorder Drugs Market Revenue (US$ Mn) and Y-o-Y Growth (%), by Others, 2017–2027
Figure 20: Global Neurological Disorder Drugs Market Attractiveness Analysis, by Drug Class, 2019–2027
Figure 21: Global Neurological Disorder Drugs Market Value Share Analysis, by Distribution Channel, 2018 and 2027
Figure 22: Global Neurological Disorder Drugs Market Value (US$ Mn) and Y-o-Y Growth (%) Forecast, by Retail Pharmacies, 2017–2027
Figure 23: Global Neurological Disorder Drugs Market Value (US$ Mn) and Y-o-Y Growth (%) Forecast, by Hospital Pharmacies, 2017–2027
Figure 24: Global Neurological Disorder Drugs Market Value (US$ Mn) and Y-o-Y Growth (%) Forecast, by Online Pharmacies, 2017–2027
Figure 25: Global Neurological Disorder Drugs Market Attractiveness Analysis, by Distribution Channel, 2019–2027
Figure 26: Global Neurological Disorder Drugs Market, by Region, 2018 and 2027
Figure 27: Global Neurological Disorder Drugs Market Attractiveness Analysis, by Region, 2019–2027
Figure 28: North America Neurological Disorder Drugs Market Value (US$ Mn) Forecast and Y-o-Y Growth (%) Projection, 2017–2027
Figure 29: North America Neurological Disorder Drugs Market Value Share Analysis, by Disorder, 2018 and 2027
Figure 30: North America Neurological Disorder Drugs Market Attractiveness Analysis, by Disorder, 2019–2027
Figure 31: North America Neurological Disorder Drugs Market Value Share Analysis, by Drug Class, 2018 and 2027
Figure 32: North America Neurological Disorder Drugs Market Attractiveness Analysis, by Drug Class, 2019–2027
Figure 33: North America Neurological Disorder Drugs Market Value Share Analysis, by Distribution Channel, 2018 and 2027
Figure 34: North America Neurological Disorder Drugs Market Attractiveness Analysis, by Distribution Channel, 2019–2027
Figure 35: North America Neurological Disorder Drugs Market Value Share Analysis, by Country, 2018 and 2027
Figure 36: North America Neurological Disorder Drugs Market Attractiveness Analysis, by Country, 2019–2027
Figure 37: Europe Neurological Disorder Drugs Market Value (US$ Mn) Forecast and Y-o-Y Growth (%) Projection, 2017–2027
Figure 38: Europe Neurological Disorder Drugs Market Value Share Analysis, by Disorder, 2018 and 2027
Figure 39: Europe Neurological Disorder Drugs Market Attractiveness Analysis, by Disorder, 2019–2027
Figure 40: Europe Neurological Disorder Drugs Market Value Share Analysis, by Drug Class, 2018 and 2027
Figure 41: Europe Neurological Disorder Drugs Market Attractiveness Analysis, by Drug Class, 2019–2027
Figure 42: Europe Neurological Disorder Drugs Market Value Share Analysis, by Distribution Channel, 2018 and 2027
Figure 43: Europe Neurological Disorder Drugs Market Attractiveness Analysis, by Distribution Channel, 2019–2027
Figure 44: Europe Neurological Disorder Drugs Market Value Share Analysis, by Country/Sub-region, 2018 and 2027
Figure 45: Europe Neurological Disorder Drugs Market Attractiveness Analysis, by Country/Sub-region, 2019–2027
Figure 46: Asia Pacific Neurological Disorder Drugs Market Value (US$ Mn) Forecast and Y-o-Y Growth (%) Projection, 2017–2027
Figure 47: Asia Pacific Neurological Disorder Drugs Market Value Share Analysis, by Disorder, 2018 and 2027
Figure 48: Asia Pacific Neurological Disorder Drugs Market Attractiveness Analysis, by Disorder, 2019–2027
Figure 49: Asia Pacific Neurological Disorder Drugs Market Value Share Analysis, by Drug Class, 2018 and 2027
Figure 50: Asia Pacific Neurological Disorder Drugs Market Attractiveness Analysis, by Drug Class, 2019–2027
Figure 51: Asia Pacific Neurological Disorder Drugs Market Value Share Analysis, by Distribution Channel, 2018 and 2027
Figure 52: Asia Pacific Neurological Disorder Drugs Market Attractiveness Analysis, by Distribution Channel, 2019–2027
Figure 53: Asia Pacific Neurological Disorder Drugs Market Value Share Analysis, by Country/Sub-region, 2018 and 2027
Figure 54: Asia Pacific Neurological Disorder Drugs Market Attractiveness Analysis, by Country/Sub-region, 2019–2027
Figure 55: Latin America Neurological Disorder Drugs Market Value (US$ Mn) Forecast and Y-o-Y Growth (%) Projection, 2017–2027
Figure 56: Latin America Neurological Disorder Drugs Market Value Share Analysis, by Disorder, 2018 and 2027
Figure 57: Latin America Neurological Disorder Drugs Market Attractiveness Analysis, by Disorder, 2019–2027
Figure 58: Latin America Neurological Disorder Drugs Market Value Share Analysis, by Drug Class, 2018 and 2027
Figure 59: Latin America Neurological Disorder Drugs Market Attractiveness Analysis, by Drug Class, 2019–2027
Figure 60: Latin America Neurological Disorder Drugs Market Value Share Analysis, by Distribution Channel, 2018 and 2027
Figure 61: Latin America Neurological Disorder Drugs Market Attractiveness Analysis, by Distribution Channel, 2019–2027
Figure 62: Latin America Neurological Disorder Drugs Market Value Share Analysis, by Country/Sub-region, 2018 and 2027
Figure 63: Latin America Neurological Disorder Drugs Market Attractiveness Analysis, by Country/Sub-region, 2019–2027
Figure 64: Middle East & Africa Neurological Disorder Drugs Market Value (US$ Mn) Forecast and Y-o-Y Growth (%) Projection, 2017–2027
Figure 65: Middle East & Africa Neurological Disorder Drugs Market Value Share Analysis, by Disorder, 2018 and 2027
Figure 66: Middle East & Africa Neurological Disorder Drugs Market Attractiveness Analysis, by Disorder, 2019–2027
Figure 67: Middle East & Africa Neurological Disorder Drugs Market Value Share Analysis, by Drug Class, 2018 and 2027
Figure 68: Middle East & Africa Neurological Disorder Drugs Market Attractiveness Analysis, by Drug Class, 2019–2027
Figure 69: Middle East & Africa Neurological Disorder Drugs Market Value Share Analysis, by Distribution Channel, 2018 and 2027
Figure 70: Middle East & Africa Neurological Disorder Drugs Market Attractiveness Analysis, by Distribution Channel, 2019–2027
Figure 71: Middle East & Africa Neurological Disorder Drugs Market Value Share Analysis, by Country/Sub-region, 2018 and 2027
Figure 72: Middle East & Africa Neurological Disorder Drugs Market Attractiveness Analysis, by Country/Sub-region, 2019–2027
Copyright © Transparency Market Research, Inc. All Rights reserved
Trust Online

Neurological Disorder Drugs Market