
Reports
Reports
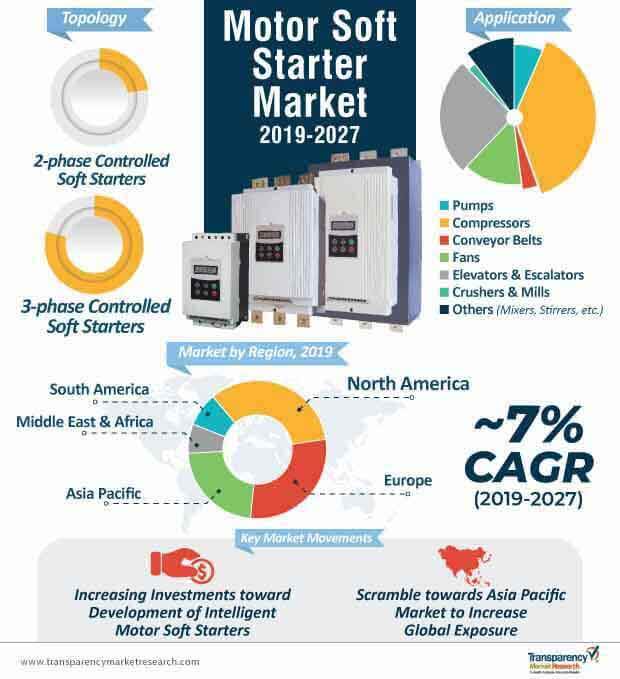
Leading players look at the motor soft starter market as a goldmine of RoI opportunities, and are found to be following the 'expend to expand' strategy. A significant chunk of the revenue earned by these players is being invested toward R&D activities, to introduce intelligent motor soft starters that operate on the back of IoT technology.
Undoubtedly, the Fourth Industrial Revolution is pushing market players toward product diversification to achieve full-scale automation. However, certain negative sentiments are likely to crop up in the motor soft starter market with the limited accuracy level of these products, thereby creating a huge market for substitutes.
Considering the high pace of industrial revolution, capacity-oriented inhibitions of these products, and some significant trends as recorded by seasoned analysts at Transparency Market Research (TMR) in a recent study, the motor soft starter market is projected to expand ~6% in 2019 over 2018.
Though motor soft starters are deemed an effective solution to control current in electrical systems, these components have limited control over the speed of the motor. In stark contrast, an AC variable frequency drive (VFD) provides continuous control over the changing speed of the motor. This primary substitute, in turn, matches the speed of secondary machines to ensure optimal machine operations, which directs the shift towards VFDs from motor soft starters.
However, players in the motor soft starter market can alter end users’ sentiments by focusing their marketing toward the cost benefits and minimum space requisites of their products. The scramble towards automation also implies an energy-efficient process, which is better achieved through motor soft starters.
Given the higher yield of these starters, on the scale of cost, size, and energy, manufacturers can intensify their focus on brand communication to create market opportunities in regions with high popularity of substitutes.
As per stats recorded in TMR’s study, the pace at which the Asia Pacific market is growing is, in turn, unfolding investment opportunities for companies to gain cross-border exposure.
Considering the cost-sensitive region that Asia Pacific is, the threat of substitutes is low since VFDs are cost-prohibitive in nature, and significant opportunities are likely to arrive from the growth of the manufacturing and industrial sectors in China, India, and Japan. The demand for motor soft starters is projected to show greater ascendancy in the large mining sector, and given the ergonomics in place, a shift towards intelligent starters will instigate players to upkeep the pace of innovation.
Another aspect evincing a promising outlook for the motor soft starter market in the region is the growing number of government initiatives taken in developing countries toward ensuring proper sanitation and water supply to the remotest of households. These initiatives have triggered the rising sales of pumps, and the same has been reflecting on the increasing demand for motor soft starters.
Market players operating in the region, including, Crompton Greaves Ltd. and Toshiba Corporation, make concentrated efforts toward portfolio diversification, with 'quality and efficiency' being at the central of development. However, these players fall short of time when it comes to the development of new products on time, which creates investment opportunities for other players to foray into the Asia Pacific region, and win in the motor soft starter market with better turnaround time.
Analysts’ Outlook on the Motor Soft Starter Market
Authors of the TMR study analyze the latent as well as apparent dynamics of the motor soft starter market, and deduce a promising future. The landscape stands at an intersection of numerous revenue streams coming in from the construction, power, mining, food, and manufacturing sectors, with energy efficiency being an influential pursuit of these industries.
As traditional sectors such as agriculture and wastewater treatment begin to realize the profitability of an automated process over a labor-intensive approach, a sustainable sales channel can be anticipated for the motor soft starter market. However, manufacturers need to stay updated with neoteric technological trends to offer innovative products in the least possible time.
Key providers of motor soft starters are focusing on new product development and technological advancements. Some other key developments in the global motor soft starter market are as follows:
In the report on the global motor soft starter market, we have discussed individual strategies, followed by the company profiles of providers of motor soft starters. The ‘Competition Landscape’ section has been included in the report to provide readers with a dashboard view and company market share analysis of key players operating in the global motor soft starter market.
Motor Soft Starter Market to expand at a CAGR of 7.0% during the forecast period 2027
The global motor soft starter market is witnessing significant growth, owing to the increased demand for next-generation, fuel-efficient motor soft starters
North America is expected to dominate this market during 2019-2027
Key players operating in the global motor soft starter market are ABB Ltd, Crompton Greaves Ltd. (EMOTRON TSA), Danfoss A/S, Eaton Corporation, Motortronics UK Ltd, Rockwell Automation, Inc., Schneider Electric SE, Siemens AG, Toshiba International Corporation Pty Ltd, and Weg SA
The Motor Soft Starter Market is studied from 2019 – 2027
1. Preface
1.1. Market Definition and Scope
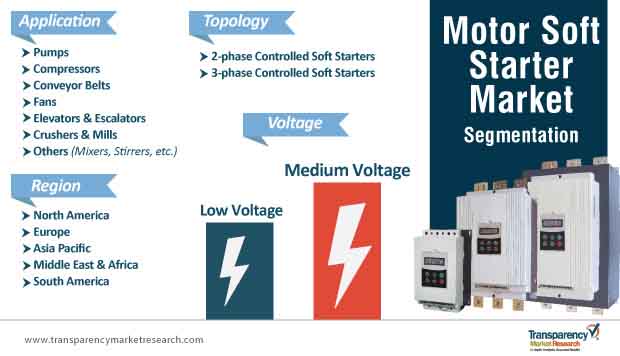
1.2. Market Segmentation
1.3. Key Research Objectives
1.4. Research Highlights
2. Assumptions and Research Methodology
3. Executive Summary: Global Motor Soft Starter Market
4. Market Overview
4.1. Introduction
4.2. Market Dynamics
4.2.1. Drivers
4.2.2. Restraints
4.2.3. Opportunities
4.3. Key Market Indicators
4.4. Key Trends Analysis
4.5. Global Motor Soft Starter Market Analysis and Forecast, 2017–2027
4.5.1. Market Revenue Projection (US$ Mn)
4.5.2. Market Volume Projection (Thousand Units)
4.5.3. Price Trend Analysis
4.6. Porter’s Five Forces Analysis - Global Motor Soft Starter Market
4.7. Value Chain Analysis - Global Motor Soft Starter Market
4.8. Market Outlook
5. Global Motor Soft Starter Market Analysis and Forecast, by Topology
5.1. Overview & Definitions
5.2. Global Motor Soft Starter Market Size (US$ Mn & Thousand Units) Forecast, by Topology, 2017–2027
5.2.1. 2-phase Controlled Soft Starter
5.2.2. 3-phase Controlled Soft Starter
5.3. Topology Comparison Matrix
5.4. Global Motor Soft Starter Market Attractiveness, by Topology
6. Global Motor Soft Starter Market Analysis and Forecast, by Voltage
6.1. Overview & Definitions
6.2. Global Motor Soft Starter Market Size (US$ Mn & Thousand Units) Forecast, by Voltage, 2017–2027
6.2.1. Low Voltage
6.2.2. Medium Voltage
6.3. Voltage Comparison Matrix
6.4. Global Motor Soft Starter Market Attractiveness, by Voltage
7. Global Motor Soft Starter Market Analysis and Forecast, by Application
7.1. Overview & Definitions
7.2. Global Motor Soft Starter Market Revenue (US$ Mn) Forecast, by Application, 2017–2027
7.2.1. Pump
7.2.2. Compressor
7.2.3. Conveyor Belt
7.2.4. Fan
7.2.5. Elevator & Escalator
7.2.6. Crusher & Mill
7.2.7. Others (Mixer, Stirrer, etc.)
8. Global Motor Soft Starter Market Analysis and Forecast, by Region
8.1. Key Findings
8.2. Global Motor Soft Starter Market Size (US$ Mn & Thousand Units) Forecast, by Region, 2017–2027
8.2.1. North America
8.2.2. Europe
8.2.3. Asia Pacific
8.2.4. Middle East & Africa
8.2.5. South America
8.3. Global Motor Soft Starter Market Attractiveness, by Region
9. North America Motor Soft Starter Market Analysis and Forecast
9.1. Key Findings
9.2. North America Motor Soft Starter Market Size (US$ Mn & Thousand Units) Forecast, by Topology, 2017–2027
9.2.1. 2-phase Controlled Soft Starter
9.2.2. 3-phase Controlled Soft Starter
9.3. North America Motor Soft Starter Market Size (US$ Mn & Thousand Units) Forecast, by Voltage, 2017–2027
9.3.1. Low Voltage
9.3.2. Medium Voltage
9.4. North America Motor Soft Starter Market Revenue (US$ Mn) Forecast, by Application, 2017–2027
9.4.1. Pump
9.4.2. Compressor
9.4.3. Conveyor Belt
9.4.4. Fan
9.4.5. Elevator & Escalator
9.4.6. Crusher & Mill
9.4.7. Others (Mixer, Stirrer, etc.)
9.5. North America Motor Soft Starter Market Size (US$ Mn & Thousand Units) Forecast, by Country/Sub-region, 2017–2027
9.5.1. U.S.
9.5.2. Canada
9.5.3. Rest of North America
9.6. North America Motor Soft Starter Market Attractiveness Analysis
9.6.1. by Topology
9.6.2. by Voltage
9.6.3. by Application
9.6.4. by Country/Sub-region
10. Europe Motor Soft Starter Market Analysis and Forecast
10.1. Key Findings
10.2. Europe Motor Soft Starter Market Size (US$ Mn & Thousand Units) Forecast, by Topology, 2017–2027
10.2.1. 2-phase Controlled Soft Starter
10.2.2. 3-phase Controlled Soft Starter
10.3. Europe Motor Soft Starter Market Size (US$ Mn & Thousand Units) Forecast, by Voltage, 2017–2027
10.3.1. Low Voltage
10.3.2. Medium Voltage
10.4. Europe Motor Soft Starter Market Revenue (US$ Mn) Forecast, by Application, 2017–2027
10.4.1. Pump
10.4.2. Compressor
10.4.3. Conveyor Belt
10.4.4. Fan
10.4.5. Elevator & Escalator
10.4.6. Crusher & Mill
10.4.7. Others (Mixer, Stirrer, etc.)
10.5. Europe Motor Soft Starter Market Size (US$ Mn & Thousand Units) Forecast, by Country/Sub-region, 2017–2027
10.5.1. Germany
10.5.2. U.K.
10.5.3. France
10.5.4. Rest of Europe
10.6. Europe Motor Soft Starter Market Attractiveness Analysis
10.6.1. by Topology
10.6.2. by Voltage
10.6.3. by Application
10.6.4. by Country/Sub-region
11. Asia Pacific Motor Soft Starter Market Analysis and Forecast
11.1. Key Findings
11.2. Asia Pacific Motor Soft Starter Market Size (US$ Mn & Thousand Units) Forecast, by Topology, 2017–2027
11.2.1. 2-phase Controlled Soft Starter
11.2.2. 3-phase Controlled Soft Starter
11.3. Asia Pacific Motor Soft Starter Market Size (US$ Mn & Thousand Units) Forecast, by Voltage, 2017–2027
11.3.1. Low Voltage
11.3.2. Medium Voltage
11.4. Asia Pacific Motor Soft Starter Market Revenue (US$ Mn) Forecast, by Application, 2017–2027
11.4.1. Pump
11.4.2. Compressor
11.4.3. Conveyor Belt
11.4.4. Fan
11.4.5. Elevator & Escalator
11.4.6. Crusher & Mill
11.4.7. Others (Mixer, Stirrer, etc.)
11.5. Asia Pacific Motor Soft Starter Market Size (US$ Mn & Thousand Units) Forecast, by Country/Sub-region, 2017–2027
11.5.1. China
11.5.2. India
11.5.3. Japan
11.5.4. Rest of Asia Pacific
11.6. Asia Pacific Motor Soft Starter Market Attractiveness Analysis
11.6.1. by Topology
11.6.2. by Voltage
11.6.3. by Application
11.6.4. by Country/Sub-region
12. Middle East & Africa Motor Soft Starter Market Analysis and Forecast
12.1. Key Findings
12.2. Middle East & Africa Motor Soft Starter Market Size (US$ Mn & Thousand Units) Forecast, by Topology, 2017–2027
12.2.1. 2-phase Controlled Soft Starter
12.2.2. 3-phase Controlled Soft Starter
12.3. Middle East & Africa Motor Soft Starter Market Size (US$ Mn & Thousand Units) Forecast, by Voltage, 2017–2027
12.3.1. Low Voltage
12.3.2. Medium Voltage
12.4. Middle East & Africa Motor Soft Starter Market Revenue (US$ Mn) Forecast, by Application, 2017–2027
12.4.1. Pump
12.4.2. Compressor
12.4.3. Conveyor Belt
12.4.4. Fan
12.4.5. Elevator & Escalator
12.4.6. Crusher & Mill
12.4.7. Others (Mixer, Stirrer, etc.)
12.5. Middle East & Africa Motor Soft Starter Market Size (US$ Mn & Thousand Units) Forecast, by Country/Sub-region, 2017–2027
12.5.1. GCC
12.5.2. South Africa
12.5.3. Rest of Middle East & Africa
12.6. Middle East & Africa Motor Soft Starter Market Attractiveness Analysis
12.6.1. by Topology
12.6.2. by Voltage
12.6.3. by Application
12.6.4. by Country/Sub-region
13. South America Motor Soft Starter Market Analysis and Forecast
13.1. Key Findings
13.2. South America Motor Soft Starter Market Size (US$ Mn & Thousand Units) Forecast, by Topology, 2017–2027
13.2.1. 2-phase Controlled Soft Starter
13.2.2. 3-phase Controlled Soft Starter
13.3. South America Motor Soft Starter Market Size (US$ Mn & Thousand Units) Forecast, by Voltage, 2017–2027
13.3.1. Low Voltage
13.3.2. Medium Voltage
13.4. South America Motor Soft Starter Market Revenue (US$ Mn) Forecast, by Application, 2017–2027
13.4.1. Pump
13.4.2. Compressor
13.4.3. Conveyor Belt
13.4.4. Fan
13.4.5. Elevator & Escalator
13.4.6. Crusher & Mill
13.4.7. Others (Mixer, Stirrer, etc.)
13.5. South America Motor Soft Starter Market Size (US$ Mn & Thousand Units) Forecast, by Country/Sub-region, 2017–2027
13.5.1. Brazil
13.5.2. Rest of South America
13.6. South America Motor Soft Starter Market Attractiveness Analysis
13.6.1. by Topology
13.6.2. by Voltage
13.6.3. by Application
13.6.4. by Country/Sub-region
14. Competition Landscape
14.1. Market Players – Competition Matrix
14.2. Global Motor Soft Starter Market Share Analysis, by Company (2018)
14.3. Company Profiles (Details – Overview, Financials, SWOT Analysis, Recent Developments, Strategy)
14.3.1. ABB Ltd
14.3.1.1. Overview
14.3.1.2. Financials < /p>
14.3.1.3. SWOT Analysis
14.3.1.4. Recent Developments
14.3.1.5. Strategy
14.3.2. Crompton Greaves Ltd. (EMOTRON TSA)
14.3.2.1. Overview
14.3.2.2. Financials
14.3.2.3. SWOT Analysis
14.3.2.4. Recent Developments
14.3.2.5. Strategy
14.3.3. Danfoss A/S
14.3.3.1. Overview
14.3.3.2. Financials
14.3.3.3. SWOT Analysis
14.3.3.4. Recent Developments
14.3.3.5. Strategy
14.3.4. Eaton Corporation
14.3.4.1. Overview
14.3.4.2. Financials
14.3.4.3. SWOT Analysis
14.3.4.4. Recent Developments
14.3.4.5. Strategy
14.3.5. Motortronics UK Ltd
14.3.5.1. Overview
14.3.5.2. Financials
14.3.5.3. SWOT Analysis
14.3.5.4. Recent Developments
14.3.5.5. Strategy
14.3.6. Rockwell Automation, Inc.
14.3.6.1. Overview
14.3.6.2. Financials
14.3.6.3. SWOT Analysis
14.3.6.4. Recent Developments
14.3.6.5. Strategy
14.3.7. Schneider Electric SE
14.3.7.1. Overview
14.3.7.2. Financials
14.3.7.3. SWOT Analysis
14.3.7.4. Recent Developments
14.3.7.5. Strategy
14.3.8. Siemens AG
14.3.8.1. Overview
14.3.8.2. Financials
14.3.8.3. SWOT Analysis
14.3.8.4. Recent Developments
14.3.8.5. Strategy
14.3.9. Toshiba International Corporation Pty Ltd
14.3.9.1. Overview
14.3.9.2. Financials< /p>
14.3.9.3. SWOT Analysis
14.3.9.4. Recent Developments
14.3.9.5. Strategy
14.3.10. Weg SA
14.3.10.1. Overview
14.3.10.2. Financials
14.3.10.3. SWOT Analysis
14.3.10.4. Recent Developments
14.3.10.5. Strategy
15. Key Takeaways
List of Tables
Table 1: Global Motor Soft Starter Market Revenue (US$ Mn), by Topology, 2017–2027
Table 02: Global Motor Soft Starter Market Volume (Thousand Units), by Topology, 2017–2027
Table 03: Global Motor Soft Starter Market Revenue (US$ Mn), by Voltage, 2017–2027
Table 04: Global Motor Soft Starter Market Volume (Thousand Units), by Voltage, 2017–2027
Table 05: Global Motor Soft Starter Market Revenue (US$ Mn), by Application, 2017–2027
Table 06: Global Motor Soft Starter Market Revenue (US$ Mn), by Geography, 2017–2027
Table 07: Global Motor Soft Starter Market Volume (Thousand Units), by Geography, 2017–2027
Table 08: North America Motor Soft Starter Market Revenue (US$ Mn), by Topology, 2017–2027
Table 09: North America Motor Soft Starter Market Volume (Thousand Units), by Topology, 2017–2027
Table 10: North America Motor Soft Starter Market Revenue (US$ Mn), by Voltage, 2017–2027
Table 11: North America Motor Soft Starter Market Volume (Thousand Units), by Voltage, 2017–2027
Table 12: North America Motor Soft Starter Market Revenue (US$ Mn), by Application, 2017–2027
Table 13: North America Motor Soft Starter Market Revenue (US$ Mn), by Country/Sub-region, 2017–2027
Table 14: North America Motor Soft Starter Market Revenue (US$ Mn), by Country/Sub-region, 2017–2027
Table 15: Europe Motor Soft Starter Market Revenue (US$ Mn), by Topology, 2017–2027
Table 16: Europe Motor Soft Starter Market Volume (Thousand Units), by Topology, 2017–2027
Table 17: Europe Motor Soft Starter Market Revenue (US$ Mn), by Voltage, 2017–2027
Table 18: Europe Motor Soft Starter Market Volume (Thousand Units), by Voltage, 2017–2027
Table 19: Europe Motor Soft Starter Market Revenue (US$ Mn), by Application, 2017–2027
Table 20: Europe Motor Soft Starter Market Revenue (US$ Mn), by Country/Sub-region, 2017–2027
Table 21: Europe Motor Soft Starter Market Volume (Thousand Units), by Country/Sub-region, 2017–2027
Table 22: Asia Pacific Motor Soft Starter Market Revenue (US$ Mn), by Topology, 2017–2027
Table 23: Asia Pacific Motor Soft Starter Market Volume (Thousand Units), by Topology, 2017–2027
Table 24: Asia Pacific Motor Soft Starter Market Revenue (US$ Mn), by Voltage, 2017–2027
Table 25: Asia Pacific Motor Soft Starter Market Volume (Thousand Units), by Voltage, 2017–2027
Table 26: Asia Pacific Motor Soft Starter Market Revenue (US$ Mn), by Application, 2017–2027
Table 27: Asia Pacific Motor Soft Starter Market Revenue (US$ Mn), by Country/Sub-region, 2017–2027
Table 28: Asia Pacific Motor Soft Starter Market Volume (Thousand Units), by Country/Sub-region, 2017–2027
Table 29: Middle East & Africa Motor Soft Starter Market Revenue (US$ Mn), by Topology, 2017–2027
Table 30: Middle East & Africa Motor Soft Starter Market Volume (Thousand Units), by Topology, 2017–2027
Table 31: Middle East & Africa Motor Soft Starter Market Revenue (US$ Mn), by Voltage, 2017–2027
Table 32: Middle East & Africa Motor Soft Starter Market Volume (Thousand Units), by Voltage, 2017–2027
Table 33: Middle East & Africa Motor Soft Starter Market Revenue (US$ Mn), by Application, 2017–2027
Table 34: Middle East & Africa Motor Soft Starter Market Revenue (US$ Mn), by Country/Sub-region, 2017–2027
Table 35: Middle East & Africa Motor Soft Starter Market Volume (Thousand Units), by Country/Sub-region, 2017–2027
Table 36: South America Motor Soft Starter Market Revenue (US$ Mn), by Topology, 2017–2027
Table 37: South America Motor Soft Starter Market Volume (Thousand Units), by Topology, 2017–2027
Table 38: South America Motor Soft Starter Market Revenue (US$ Mn), by Voltage, 2017–2027
Table 39: South America Motor Soft Starter Market Volume (Thousand Units), by Voltage, 2017–2027
Table 40: South America Motor Soft Starter Market Revenue (US$ Mn), by Application, 2017–2027
Table 41: South America Motor Soft Starter Market Revenue (US$ Mn), by Country/Sub-region, 2017–2027
Table 42: South America Motor Soft Starter Market Volume (Thousand Units), by Country/Sub-region, 2017–2027
List of Figures
Figure 01: Global Motor Soft Starter Market Revenue (US$ Mn) Forecast, 2017–2027
Figure 02: Global Motor Soft Starter Market Revenue (US$ Mn), 2017–2027
Figure 03: Global Motor Soft Starter Market Volume (Thousand Units), 2017–2027
Figure 04: Global Motor Soft Starter Market Value Share (%), by Topology (2018)
Figure 05: Global Motor Soft Starter Market Value Share (%), by Application (2018)
Figure 06: Global Motor Soft Starter Market Value Share (%), by Region (2018)
Figure 07: Global Motor Soft Starter Market, by Topology, 2-phase Controlled Soft Starter
Figure 08: Global Motor Soft Starter Market, by Topology, 3-phase Controlled Soft Starter
Figure 09: Global Motor Soft Starter Market Comparison Matrix, by Topology
Figure 10: Global Motor Soft Starter Market Attractiveness Analysis, by Topology**
Figure 11: Global Motor Soft Starter Market, by Voltage, Low Voltage
Figure 12: Global Motor Soft Starter Market, by Voltage, Medium Voltage
Figure 13: Global Motor Soft Starter Market Comparison Matrix, by Voltage
Figure 14: Global Motor Soft Starter Market Attractiveness Analysis, by Voltage**
Figure 15: Global Motor Soft Starter Market, by Application, Pump
Figure 16: Global Motor Soft Starter Market, by Application, Compressor
Figure 17: Global Motor Soft Starter Market, by Application, Conveyor Belt
Figure 18: Global Motor Soft Starter Market, by Application, Fan
Figure 19: Global Motor Soft Starter Market, by Application, Elevator & Escalator
Figure 20: Global Motor Soft Starter Market, by Application, Crusher & Mill
Figure 21: Global Motor Soft Starter Market, by Application, Others
Figure 22: Global Motor Soft Starter Market Comparison Matrix, by Application
Figure 23: Global Motor Soft Starter Market Attractiveness Analysis, by Application**
Figure 24: Global Motor Soft Starter Market, by Region, North America
Figure 25: Global Motor Soft Starter Market, by Region, Europe
Figure 26: Global Motor Soft Starter Market, by Region, Asia Pacific
Figure 27: Global Motor Soft Starter Market, by Region, Middle East & Africa
Figure 28: Global Motor Soft Starter Market, by Region, South America
Figure 29: Global Motor Soft Starter Market Attractiveness Analysis, by Geography**
Figure 30: North America Motor Soft Starter Market Revenue (US$ Mn), 2017–2027
Figure 31: North America Motor Soft Starter Market Volume (Thousand Units), 2017–2027
Figure 32: North America Motor Soft Starter Market Attractiveness Analysis, by Topology**
Figure 33: North America Motor Soft Starter Market Revenue Share Analysis, by Topology
Figure 34: North America Motor Soft Starter Market Attractiveness Analysis, by Voltage**
Figure 35: North America Motor Soft Starter Market Revenue Share Analysis, by Voltage
Figure 36: North America Motor Soft Starter Market Attractiveness Analysis, by Application**
Figure 37: North America Motor Soft Starter Market Revenue Share Analysis, by Application
Figure 38: North America Motor Soft Starter Market Attractiveness Analysis, by Country/Sub-region**
Figure 39: North America Motor Soft Starter Market Revenue Share Analysis, by Country/Sub-region
Figure 40: Europe Motor Soft Starter Market Revenue (US$ Mn), 2017–2027
Figure 41: Europe Motor Soft Starter Market Volume (Thousand Units), 2017–2027
Figure 42: Europe Motor Soft Starter Market Attractiveness Analysis, by Topology**
Figure 43: Europe Motor Soft Starter Market Revenue Share Analysis, by Topology
Figure 44: Europe Motor Soft Starter Market Attractiveness Analysis, by Voltage**
Figure 45: Europe Motor Soft Starter Market Revenue Share Analysis, by Voltage
Figure 46: Europe Motor Soft Starter Market Attractiveness Analysis, by Application**
Figure 47: Europe Motor Soft Starter Market Revenue Share Analysis, by Application
Figure 48: Europe Motor Soft Starter Market Attractiveness Analysis, by Country/Sub-region**
Figure 49: Europe Motor Soft Starter Market Revenue Share Analysis, by Country/Sub-region
Figure 50: Asia Pacific Motor Soft Starter Market Revenue (US$ Mn), 2017–2027
Figure 51: Asia Pacific Motor Soft Starter Market Volume (Thousand Units), 2017–2027
Figure 52: Asia Pacific Motor Soft Starter Market Attractiveness Analysis, by Topology**
Figure 53: Asia Pacific Motor Soft Starter Market Revenue Share Analysis, by Topology
Figure 54: Asia Pacific Motor Soft Starter Market Attractiveness Analysis, by Voltage**
Figure 55: Asia Pacific Motor Soft Starter Market Revenue Share Analysis, by Voltage
Figure 56: Asia Pacific Motor Soft Starter Market Attractiveness Analysis, by Application**
Figure 57: Asia Pacific Motor Soft Starter Market Revenue Share Analysis, by Application
Figure 58: Asia Pacific Motor Soft Starter Market Attractiveness Analysis, by Country/Sub-region**
Figure 59: Asia Pacific Motor Soft Starter Market Revenue Share Analysis, by Country/Sub-region
Figure 60: Middle East & Africa Motor Soft Starter Market Revenue (US$ Mn), 2017–2027
Figure 61: Middle East & Africa Motor Soft Starter Market Volume (Thousand Units), 2017–2027
Figure 62: Middle East & Africa Motor Soft Starter Market Attractiveness Analysis, by Topology**
Figure 63: Middle East & Africa Motor Soft Starter Market Revenue Share Analysis, by Topology
Figure 64: Middle East & Africa Motor Soft Starter Market Attractiveness Analysis, by Voltage**
Figure 65: Middle East & Africa Motor Soft Starter Market Revenue Share Analysis, by Voltage
Figure 66: Middle East & Africa Motor Soft Starter Market Attractiveness Analysis, by Application**
Figure 67: Middle East & Africa Motor Soft Starter Market Revenue Share Analysis, by Application
Figure 68: Middle East & Africa Motor Soft Starter Market Attractiveness Analysis, by Country/Sub-region**
Figure 69: Middle East & Africa Motor Soft Starter Market Revenue Share Analysis, by Country/Sub-region
Figure 70: South America Motor Soft Starter Market Revenue (US$ Mn), 2017–2027
Figure 71: South America Motor Soft Starter Market Volume (Thousand Units), 2017–2027
Figure 72: South America Motor Soft Starter Market Attractiveness Analysis, by Topology**
Figure 73: South America Motor Soft Starter Market Revenue Share Analysis, by Topology
Figure 74: South America Motor Soft Starter Market Attractiveness Analysis, by Voltage**
Figure 75: South America Motor Soft Starter Market Revenue Share Analysis, by Voltage
Figure 76: South America Motor Soft Starter Market Attractiveness Analysis, by Application**
Figure 78: South America Motor Soft Starter Market Revenue Share Analysis, by Application
Figure 79: South America Motor Soft Starter Market Attractiveness Analysis, by Country/Sub-region**
Figure 80: South America Motor Soft Starter Market Revenue Share Analysis, by Country/Sub-region
Copyright © Transparency Market Research, Inc. All Rights reserved
Trust Online

Motor Soft Starter Market