
Reports
Reports
Analysts’ Viewpoint on Mobile Point-of-Sale (mPOS) Terminals Market Scenario
Mobile point-of-sale (mPOS) has changed the dynamics of the mobile proximity payments market. Large retailers are increasingly using mPOS to improve their operational efficiency & in-store shopping experience, and provide their field sales reps with integrated payment capabilities. Growth in smartphone penetration, large base of SMEs and micro-merchants, and expansion of card user base due to various government and bank schemes for card adoption are driving the mPOS market. mPOS terminal providers are likely to integrate value-added services (VAS) into existing solutions, and develop mPOS applications based on specific industry verticals in the next few years. Market players are integrating NFC and QR-based payment solutions in order to stay abreast with the rising adoption of digital payments. Moreover, SMEs and micro-merchants are increasingly adopting mPOS terminals due to their low cost.
Mobile point-of-sale (mPOS) is a portable system installed on smartphones and tablets that facilitates the payment process. Mobile POS system helps merchants serve their customers at any place, as merchants only need to install mobile POS software on their portable devices such as tablets or smartphones. mPOS has quickly evolved as a key tool that enables merchants of all sizes to accept card payments. mPOS is increasingly being used for payments, inventory management, printing bills, and providing loyalty programs across various industry verticals such as retail, hospitality, and entertainment. mPOS allows sales and service industries to conduct financial transactions at a customer’s place, improving customer experience and helping free up valuable space that would be otherwise allocated to fixed POS. mPOS companies provide solutions directly to merchants or through third parties that provide services to merchants such as banks and mobile operators.
Mobile point-of-sale systems for small businesses act as a cost-effective solution for owners, as they can perform transactions and set up mPOS without having to invest in any support software. There is an acceleration in mPOS activities in emerging economies as service providers try to gain an early-mover advantage in mPOS-ready emerging economies. Important characteristics of an mPOS-ready economy are high smartphone and internet penetration; significant base of micro-merchants, SMBs, and card users; and encouraging bank and government schemes. Demand for mPOS solutions from both SMBs and large businesses is expected to increase substantially in the next few years. Large retailers seek to enhance the in-store payment experience by using mPOS solutions.
mPOS solutions lead to queue busting, faster inventory checking, and space savings as compared to traditional POS systems. For instance, using their POS-enabled mobile phones, retailers can enhance sales by increasing the level of customer engagement and simultaneously tracking their inventory. mPOS is also a cost-effective solution for small business owners. Many of the mPOS solutions are available at a very low cost, leading to a lower total cost of ownership (TCO). Merchants already own smartphones and tablets; thus, they only have to invest in low-cost mPOS solutions. Of late, retailers have started to look beyond the initial expenses and are focusing on lower TCO (total cost of ownership) with the need to reduce initial investment compared to their counterparts. Furthermore, reliability and lower TCO offered by the mPOS terminal have increased the demand for top mobile POS systems. Advent of advanced payment technologies, such as NFC and Europay, Master Card, and Visa (EMV), and increase in adoption of payment options such as debit and credit cards have played a role in boosting the mPOS market.
New mPOS vendors have been offering schemes that involve no monthly fees, flat rate percentage pricing, minimal cost hardware, and minimal ongoing maintenance charges. For instance, LevelUp, a U.S.-based company, has been offering 0% payment processing fees in exchange for obligatory marketing services. Competition based on pricing among mPOS vendors is expected to be high in the near future due to the increase in number of players in the QSR mPOS market. Thus, product differentiation and value-added services are anticipated to be key factors in sustaining the competitive environment.
mPOS vendors need to offer customized mPOS solutions that cater to the needs of specific industry verticals. Some of the key VAS include loyalty and reward programs, mobile discounts, cash-back promotions, and gift cards & vouchers. mPOS is expected to be increasingly used to encourage pre- and post-shopping activities through reward schemes. Innovative features of mPOS systems are likely to drive the mobile point-of-sale (mPOS) terminals market during the forecast period. Services such as analytics that provide recommendations to merchants related to optimal inventory, ordering cycle, and customers’ buying patterns would be adopted increasingly during the next few years.
North America held dominant share of the global mobile point-of-sale (mPOS) terminals market in 2021. Demand for mPOS is high in North America due to the widespread awareness of mPOS solutions among small merchants and fast adoption in retail, hospitality, and restaurant sectors. North America has an established network infrastructure that promotes IoT among different businesses. mPOS is expected to largely benefit from IoT, as it forms a strong network for an organization to monitor and manage its activities.
The mobile point-of-sale (mPOS) terminals market in Asia Pacific is expected to grow at the highest CAGR during the forecast period due to the rise in penetration of internet and smartphones in emerging economies such as India and China. The Government in China is taking initiatives to create mobile micro-ATMs using mobile point-of-sale devices in rural areas and low-tier cities. India offers vast potential for mPOS due to its large population and rising technological awareness. Furthermore, banks are increasingly launching NFC-enabled debit and credit cards in India.
Detailed profiles of providers of mobile point-of-sale (mPOS) terminals have been included in the market report to evaluate their financials, key product offerings, recent developments, and strategies. Key players operating in the global mobile point-of-sale (mPOS) terminals market are Ingenico Group S.A., VeriFone, Inc., PAX Global Technology Limited, Shopify Inc., Square, SAP SE, Intuit, Inc., NEC Corporation, Clover Network, Inc., Lightspeed, Oracle Corporation, NEW POS TECHNOLOGY LIMITED, NCR Corporation, Newland Payment Technology, and Toast, Inc.
Each of these players has been profiled in the global mobile point-of-sale (mPOS) terminals market report based on parameters such as company overview, financial overview, business strategies, product portfolio, business segments, and recent developments.
|
Attribute |
Detail |
|
Market Size Value in 2021 |
US$ 16.25 Bn |
|
Market Forecast Value in 2031 |
US$ 64.79 Bn |
|
Growth Rate (CAGR) |
15.1% |
|
Forecast Period |
2022–2031 |
|
Historical Data Available for |
2017–2020 |
|
Quantitative Units |
US$ Bn for Value |
|
Market Analysis |
Includes cross-segment analysis at global as well as regional level. Furthermore, qualitative analysis includes drivers, restraints, opportunities, key trends, Porter’s Five Forces analysis, value chain analysis, and key trend analysis. |
|
Competition Landscape |
|
|
Format |
Electronic (PDF) + Excel |
|
Market Segmentation |
|
|
Regions Covered |
|
|
Countries Covered |
|
|
Companies Profiled |
|
|
Customization Scope |
Available upon request |
|
Pricing |
Available upon request |
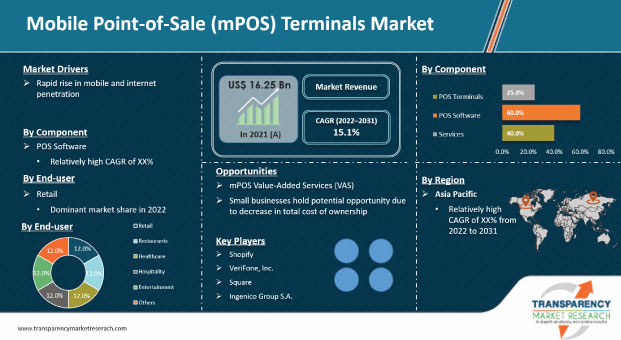
The mobile point-of-sale (mPOS) terminals market stood at US$ 16.25 Bn in 2021.
The mobile point-of-sale (mPOS) terminals market is estimated to grow at a CAGR of 15.1% during the forecast period.
Rapid rise in mobile and internet penetration, and ease of usage due to mobility and lower total cost of ownership offered by mPOS.
Retail was the largest end-user segment of the mobile point-of-sale (mPOS) terminals market in 2021.
Asia Pacific is a more attractive region for vendors in the mobile point-of-sale (mPOS) terminals market.
Ingenico Group S.A., VeriFone, Inc., PAX Global Technology Limited, Shopify Inc., Square, SAP SE, Intuit, Inc., NEC Corporation, Clover Network, Inc., Lightspeed, Oracle Corporation, NEW POS TECHNOLOGY LIMITED, NCR Corporation, Newland Payment Technology, and Toast, Inc.
1. Preface
1.1. Market Introduction
1.2. Market Segmentation
1.3. Key Research Objectives
2. Assumptions and Research Methodology
2.1. Research Methodology
2.1.1. List of Primary and Secondary Sources
2.2. Key Assumptions for Data Modelling
3. Executive Summary: Global Mobile Point-of-Sale (mPOS) Terminals Market
4. Market Overview
4.1. Market Definition
4.2. Technology/ Product Roadmap
4.3. Market Factor Analysis
4.3.1. Forecast Factors
4.3.2. Ecosystem/ Value Chain Analysis
4.3.3. Market Dynamics (Growth Influencers)
4.3.3.1. Drivers
4.3.3.2. Restraints
4.3.3.3. Opportunities
4.3.3.4. Impact Analysis of Drivers and Restraints
4.4. COVID-19 Impact Analysis
4.4.1. Impact of COVID-19 on the Mobile Point-of-Sale (mPOS) Terminals Market
4.4.2. End-user Sentiment Analysis: Comparative Analysis on Spending
4.4.2.1. Increase in Spending
4.4.2.2. Decrease in Spending
4.4.3. Short Term and Long Term Impact on the Market
4.5. Market Opportunity Assessment – by Region (North America/ Europe/ Asia Pacific/ Middle East & Africa/ South America)
4.5.1. By Component
4.5.2. By End-user
5. Global Mobile Point-of-Sale (mPOS) Terminals Market Analysis and Forecast
5.1. Market Revenue Analysis (US$ Bn), 2016-2031
5.1.1. Historic Growth Trends, 2016-2021
5.1.2. Forecast Trends, 2022-2031
5.2. Pricing Model Analysis/ Price Trend Analysis
6. Global Mobile Point-of-Sale (mPOS) Terminals Market Analysis, by Component
6.1. Overview and Definitions
6.2. Key Segment Analysis
6.3. Mobile Point-of-Sale (mPOS) Terminals Market Size (US$ Bn) Forecast, by Component, 2018 - 2031
6.3.1. POS Terminals
6.3.2. POS Software
6.3.2.1. Cloud
6.3.2.2. On-premise
6.3.3. Services
6.3.3.1. Integration & Implementation
6.3.3.2. Support & Maintenance
7. Global Mobile Point-of-Sale (mPOS) Terminals Market Analysis, by End-user
7.1. Overview and Definitions
7.2. Key Segment Analysis
7.3. Mobile Point-of-Sale (mPOS) Terminals Market Size (US$ Bn) Forecast, by End-user, 2018 - 2031
7.3.1. Retail
7.3.2. Restaurants
7.3.3. Healthcare
7.3.4. Hospitality
7.3.5. Entertainment
7.3.6. Others
8. Global Mobile Point-of-Sale (mPOS) Terminals Market Analysis and Forecasts, by Region
8.1. Key Findings
8.2. Market Size (US$ Bn) Forecast by Region, 2018-2031
8.2.1. North America
8.2.2. Europe
8.2.3. Asia Pacific
8.2.4. Middle East & Africa
8.2.5. South America
9. North America Mobile Point-of-Sale (mPOS) Terminals Market Analysis and Forecast
9.1. Regional Outlook
9.2. Mobile Point-of-Sale (mPOS) Terminals Market Size (US$ Bn) Analysis and Forecast, 2018 - 2031
9.2.1. By Component
9.2.2. By End-user
9.3. Mobile Point-of-Sale (mPOS) Terminals Market Size (US$ Bn) Forecast, by Country, 2018 - 2031
9.3.1. U.S.
9.3.2. Canada
9.3.3. Mexico
10. Europe Mobile Point-of-Sale (mPOS) Terminals Market Analysis and Forecast
10.1. Regional Outlook
10.2. Mobile Point-of-Sale (mPOS) Terminals Market Size (US$ Bn) Analysis and Forecast, 2018 - 2031
10.2.1. By Component
10.2.2. By End-user
10.3. Mobile Point-of-Sale (mPOS) Terminals Market Size (US$ Bn) Forecast, by Country & Sub-region, 2018 - 2031
10.3.1. Germany
10.3.2. U.K.
10.3.3. France
10.3.4. Italy
10.3.5. Spain
10.3.6. Rest of Europe
11. Asia Pacific Mobile Point-of-Sale (mPOS) Terminals Market Analysis and Forecast
11.1. Regional Outlook
11.2. Mobile Point-of-Sale (mPOS) Terminals Market Size (US$ Bn) Analysis and Forecast, 2018 - 2031
11.2.1. By Component
11.2.2. By End-user
11.3. Mobile Point-of-Sale (mPOS) Terminals Market Size (US$ Bn) Forecast, by Country & Sub-region, 2018 - 2031
11.3.1. China
11.3.2. India
11.3.3. Japan
11.3.4. ASEAN
11.3.5. Rest of Asia Pacific
12. Middle East & Africa Mobile Point-of-Sale (mPOS) Terminals Market Analysis and Forecast
12.1. Regional Outlook
12.2. Mobile Point-of-Sale (mPOS) Terminals Market Size (US$ Bn) Analysis and Forecast, 2018 - 2031
12.2.1. By Component
12.2.2. By End-user
12.3. Mobile Point-of-Sale (mPOS) Terminals Market Size (US$ Bn) Forecast, by Country & Sub-region, 2018 - 2031
12.3.1. Saudi Arabia
12.3.2. The United Arab Emirates
12.3.3. South Africa
12.3.4. Rest of Middle East & Africa
13. South America Mobile Point-of-Sale (mPOS) Terminals Market Analysis and Forecast
13.1. Regional Outlook
13.2. Mobile Point-of-Sale (mPOS) Terminals Market Size (US$ Bn) Analysis and Forecast, 2018 - 2031
13.2.1. By Component
13.2.2. By End-user
13.3. Mobile Point-of-Sale (mPOS) Terminals Market Size (US$ Bn) Forecast, by Country & Sub-region, 2018 - 2031
13.3.1. Brazil
13.3.2. Argentina
13.3.3. Rest of South America
14. Competition Landscape
14.1. Market Competition Matrix, by Leading Players
14.2. Market Revenue Share Analysis (%), by Leading Players (2021)
14.3. Competitive Scenario
14.3.1. List of Emerging, Prominent and Leading Players
14.3.2. Major Mergers & Acquisitions, Expansions, Partnership, Contacts, Deals, etc.
15. Company Profiles
15.1. Ingenico Group S.A.
15.1.1. Business Overview
15.1.2. Company Revenue
15.1.3. Product Portfolio
15.1.4. Geographic Footprint
15.1.5. Strategic Partnership
15.1.6. Merger & Acquisition
15.1.7. Business Expansion
15.1.8. New Product Launch
15.1.9. Innovation etc.
15.2. VeriFone, Inc.
15.2.1. Business Overview
15.2.2. Company Revenue
15.2.3. Product Portfolio
15.2.4. Geographic Footprint
15.2.5. Strategic Partnership
15.2.6. Merger & Acquisition
15.2.7. Business Expansion
15.2.8. New Product Launch
15.2.9. Innovation etc.
15.3. PAX Global Technology Limited
15.3.1. Business Overview
15.3.2. Company Revenue
15.3.3. Product Portfolio
15.3.4. Geographic Footprint
15.3.5. Strategic Partnership
15.3.6. Merger & Acquisition
15.3.7. Business Expansion
15.3.8. New Product Launch
15.3.9. Innovation etc.
15.4. Shopify Inc.
15.4.1. Business Overview
15.4.2. Company Revenue
15.4.3. Product Portfolio
15.4.4. Geographic Footprint
15.4.5. Strategic Partnership
15.4.6. Merger & Acquisition
15.4.7. Business Expansion
15.4.8. New Product Launch
15.4.9. Innovation etc.
15.5. Square
15.5.1. Business Overview
15.5.2. Company Revenue
15.5.3. Product Portfolio
15.5.4. Geographic Footprint
15.5.5. Strategic Partnership
15.5.6. Merger & Acquisition
15.5.7. Business Expansion
15.5.8. New Product Launch
15.5.9. Innovation etc.
15.6. SAP SE
15.6.1. Business Overview
15.6.2. Company Revenue
15.6.3. Product Portfolio
15.6.4. Geographic Footprint
15.6.5. Strategic Partnership
15.6.6. Merger & Acquisition
15.6.7. Business Expansion
15.6.8. New Product Launch
15.6.9. Innovation etc.
15.7. Intuit, Inc.
15.7.1. Business Overview
15.7.2. Company Revenue
15.7.3. Product Portfolio
15.7.4. Geographic Footprint
15.7.5. Strategic Partnership
15.7.6. Merger & Acquisition
15.7.7. Business Expansion
15.7.8. New Product Launch
15.7.9. Innovation etc.
15.8. NEC Corporation
15.8.1. Business Overview
15.8.2. Company Revenue
15.8.3. Product Portfolio
15.8.4. Geographic Footprint
15.8.5. Strategic Partnership
15.8.6. Merger & Acquisition
15.8.7. Business Expansion
15.8.8. New Product Launch
15.8.9. Innovation etc.
15.9. Clover Network, Inc.
15.9.1. Business Overview
15.9.2. Company Revenue
15.9.3. Product Portfolio
15.9.4. Geographic Footprint
15.9.5. Strategic Partnership
15.9.6. Merger & Acquisition
15.9.7. Business Expansion
15.9.8. New Product Launch
15.9.9. Innovation etc.
15.10. Lightspeed
15.10.1. Business Overview
15.10.2. Company Revenue
15.10.3. Product Portfolio
15.10.4. Geographic Footprint
15.10.5. Strategic Partnership
15.10.6. Merger & Acquisition
15.10.7. Business Expansion
15.10.8. New Product Launch
15.10.9. Innovation etc.
15.11. Oracle Corporation
15.11.1. Business Overview
15.11.2. Company Revenue
15.11.3. Product Portfolio
15.11.4. Geographic Footprint
15.11.5. Strategic Partnership
15.11.6. Merger & Acquisition
15.11.7. Business Expansion
15.11.8. New Product Launch
15.11.9. Innovation etc.
15.12. NEW POS TECHNOLOGY LIMITED
15.12.1. Business Overview
15.12.2. Company Revenue
15.12.3. Product Portfolio
15.12.4. Geographic Footprint
15.12.5. Strategic Partnership
15.12.6. Merger & Acquisition
15.12.7. Business Expansion
15.12.8. New Product Launch
15.12.9. Innovation etc.
15.13. NCR Corporation
15.13.1. Business Overview
15.13.2. Company Revenue
15.13.3. Product Portfolio
15.13.4. Geographic Footprint
15.13.5. Strategic Partnership
15.13.6. Merger & Acquisition
15.13.7. Business Expansion
15.13.8. New Product Launch
15.13.9. Innovation etc.
15.14. Newland Payment Technology
15.14.1. Business Overview
15.14.2. Company Revenue
15.14.3. Product Portfolio
15.14.4. Geographic Footprint
15.14.5. Strategic Partnership
15.14.6. Merger & Acquisition
15.14.7. Business Expansion
15.14.8. New Product Launch
15.14.9. Innovation etc.
15.15. Toast, Inc.
15.15.1. Business Overview
15.15.2. Company Revenue
15.15.3. Product Portfolio
15.15.4. Geographic Footprint
15.15.5. Strategic Partnership
15.15.6. Merger & Acquisition
15.15.7. Business Expansion
15.15.8. New Product Launch
15.15.9. Innovation etc.
16. Key Takeaways
List of Tables
Table 1: Acronyms Used in Mobile Point-of-Sale (mPOS) Terminals Market
Table 2: North America Mobile Point-of-Sale (mPOS) Terminals Market Revenue Analysis, by Country, 2022 - 2031 (US$ Bn)
Table 3: Europe Mobile Point-of-Sale (mPOS) Terminals Market Revenue Analysis, by Country, 2022 - 2031 (US$ Bn)
Table 4: Asia Pacific Mobile Point-of-Sale (mPOS) Terminals Market Revenue Analysis, by Country, 2022 - 2031 (US$ Bn)
Table 5: Middle East & Africa Mobile Point-of-Sale (mPOS) Terminals Market Revenue Analysis, by Country, 2022 and 2031 (US$ Bn)
Table 6: South America Mobile Point-of-Sale (mPOS) Terminals Market Revenue Analysis, by Country, 2022 - 2031 (US$ Bn)
Table 7: Forecast Factors: Relevance and Impact
Table 8: Global Mobile Point-of-Sale (mPOS) Terminals Market Value (US$ Bn) Forecast, by Component, 2018 – 2031
Table 9: Global Mobile Point-of-Sale (mPOS) Terminals Market Value (US$ Bn) Forecast, by End-user, 2018 – 2031
Table 10: Global Mobile Point-of-Sale (mPOS) Terminals Market Volume (US$ Bn) Forecast, by Region, 2018 – 2031
Table 11: North America Mobile Point-of-Sale (mPOS) Terminals Market Value (US$ Bn) Forecast, by Component, 2018 – 2031
Table 12: North America Mobile Point-of-Sale (mPOS) Terminals Market Value (US$ Bn) Forecast, by End-use, 2018 – 2031
Table 13: North America Mobile Point-of-Sale (mPOS) Terminals Market Value (US$ Bn) Forecast, by Country, 2018 - 2031
Table 14: U.S. Mobile Point-of-Sale (mPOS) Terminals Market Revenue CAGR Breakdown (%), by Growth Term
Table 15: Canada Mobile Point-of-Sale (mPOS) Terminals Market Revenue CAGR Breakdown (%), by Growth Term
Table 16: Mexico Mobile Point-of-Sale (mPOS) Terminals Market Revenue CAGR Breakdown (%), by Growth Term
Table 17: Europe Mobile Point-of-Sale (mPOS) Terminals Market Value (US$ Bn) Forecast, by Component, 2018 – 2031
Table 18: Europe Mobile Point-of-Sale (mPOS) Terminals Market Value (US$ Bn) Forecast, by End-use, 2018 – 2031
Table 19: Europe Mobile Point-of-Sale (mPOS) Terminals Market Value (US$ Bn) Forecast, by Country, 2018 – 2031
Table 20: Germany Mobile Point-of-Sale (mPOS) Terminals Market Revenue CAGR Breakdown (%), by Growth Term
Table 21: U.K. Mobile Point-of-Sale (mPOS) Terminals Market Revenue CAGR Breakdown (%), by Growth Term
Table 22: France Mobile Point-of-Sale (mPOS) Terminals Market Revenue CAGR Breakdown (%), by Growth Term
Table 23: Spain Mobile Point-of-Sale (mPOS) Terminals Market Revenue CAGR Breakdown (%), by Growth Term
Table 24: Italy Mobile Point-of-Sale (mPOS) Terminals Market Revenue CAGR Breakdown (%), by Growth Term
Table 25: Asia Pacific Mobile Point-of-Sale (mPOS) Terminals Market Value (US$ Bn) Forecast, by Component, 2018 – 2031
Table 26: Asia Pacific Mobile Point-of-Sale (mPOS) Terminals Market Value (US$ Bn) Forecast, by End-user, 2018 – 2031
Table 27: Asia Pacific Mobile Point-of-Sale (mPOS) Terminals Market Value (US$ Bn) Forecast, by Country, 2018 – 2031
Table 28: China Mobile Point-of-Sale (mPOS) Terminals Market Revenue CAGR Breakdown (%), by Growth Term
Table 29: India Mobile Point-of-Sale (mPOS) Terminals Market Revenue CAGR Breakdown (%), by Growth Term
Table 30: Japan Mobile Point-of-Sale (mPOS) Terminals Market Revenue CAGR Breakdown (%), by Growth Term
Table 31: ASEAN Mobile Point-of-Sale (mPOS) Terminals Market Revenue CAGR Breakdown (%), by Growth Term
Table 32: Middle East & Africa Mobile Point-of-Sale (mPOS) Terminals Market Value (US$ Bn) Forecast, by Component, 2018 – 2031
Table 33: Middle East & Africa Mobile Point-of-Sale (mPOS) Terminals Market Value (US$ Bn) Forecast, by End-user, 2018 – 2031
Table 34: Middle East & Africa Mobile Point-of-Sale (mPOS) Terminals Market Value (US$ Bn) Forecast, by Country, 2018 – 2031
Table 35: Saudi Arabia Mobile Point-of-Sale (mPOS) Terminals Market Revenue CAGR Breakdown (%), by Growth Term
Table 36: United Arab Emirates Mobile Point-of-Sale (mPOS) Terminals Market Revenue CAGR Breakdown (%), by Growth Term
Table 37: South Africa Mobile Point-of-Sale (mPOS) Terminals Market Revenue CAGR Breakdown (%), by Growth Term
Table 38: South America Mobile Point-of-Sale (mPOS) Terminals Market Value (US$ Bn) Forecast, by End-user, 2018 – 2031
Table 39: South America Mobile Point-of-Sale (mPOS) Terminals Market Value (US$ Bn) Forecast, by Country, 2018 - 2031
Table 40: South America Mobile Point-of-Sale (mPOS) Terminals Market Value (US$ Bn) Forecast, by Country, 2018 - 2031
Table 41: Brazil Emirates Mobile Point-of-Sale (mPOS) Terminals Market Revenue CAGR Breakdown (%), by Growth Term
Table 42: Argentina Mobile Point-of-Sale (mPOS) Terminals Market Revenue CAGR Breakdown (%), by Growth Term
Table 43: Mergers & Acquisitions, Expansions (1/3)
Table 44: Mergers & Acquisitions, Expansions (2/3)
Table 45: Mergers & Acquisitions, Expansions (3/3)
List of Figures
Figure 1: Global Mobile Point-of-Sale (mPOS) Terminals Market Size (US$ Bn) Forecast, 2018–2031
Figure 2: Global Mobile Point-of-Sale (mPOS) Terminals Market Revenue (US$ Bn) Opportunity Assessment, by Region, 2022E
Figure 3: Top Segment Analysis of Mobile Point-of-Sale (mPOS) Terminals Market
Figure 4: Global Mobile Point-of-Sale (mPOS) Terminals Market Revenue (US$ Bn) Opportunity Assessment, by Region, 2031F
Figure 5: Expansion of E-commerce Industry
Figure 6: Global Mobile Point-of-Sale (mPOS) Terminals Market Attractiveness Assessment, by Component
Figure 7: Global Mobile Point-of-Sale (mPOS) Terminals Market Attractiveness Assessment, by End-user
Figure 8: Global Mobile Point-of-Sale (mPOS) Terminals Market Attractiveness Assessment, by Region
Figure 9: Global Mobile Point-of-Sale (mPOS) Terminals Market Revenue (US$ Bn) Historic Trends, 2016 - 2021
Figure 10: Global Mobile Point-of-Sale (mPOS) Terminals Market Revenue Opportunity (US$ Bn) Historic Trends, 2016 - 2021
Figure 11: Global Mobile Point-of-Sale (mPOS) Terminals Market Value Share Analysis, by Component, 2022
Figure 12: Global Mobile Point-of-Sale (mPOS) Terminals Market Value Share Analysis, by Component, 2031
Figure 13: Global Mobile Point-of-Sale (mPOS) Terminals Market Absolute Opportunity (US$ Bn), by POS Terminals, 2022 – 2031
Figure 14: Global Mobile Point-of-Sale (mPOS) Terminals Market Absolute Opportunity (US$ Bn), by POS Software, 2022 – 2031
Figure 15: Global Mobile Point-of-Sale (mPOS) Terminals Market Absolute Opportunity (US$ Bn), by Services, 2022 – 2031
Figure 16: Global Mobile Point-of-Sale (mPOS) Terminals Market Value Share Analysis, by End-user, 2022
Figure 17: Global Mobile Point-of-Sale (mPOS) Terminals Market Value Share Analysis, by End-user, 2031
Figure 18: Global Mobile Point-of-Sale (mPOS) Terminals Market Absolute Opportunity (US$ Bn), by Retail, 2022 – 2031
Figure 19: Global Mobile Point-of-Sale (mPOS) Terminals Market Absolute Opportunity (US$ Bn), by Restaurants, 2022 – 2031
Figure 20: Global Mobile Point-of-Sale (mPOS) Terminals Market Absolute Opportunity (US$ Bn), by Healthcare, 2022 – 2031
Figure 21: Global Mobile Point-of-Sale (mPOS) Terminals Market Absolute Opportunity (US$ Bn), by Hospitality, 2022 – 2031
Figure 22: Global Mobile Point-of-Sale (mPOS) Terminals Market Absolute Opportunity (US$ Bn), by Entertainment , 2022 – 2031
Figure 23: Global Mobile Point-of-Sale (mPOS) Terminals Market Absolute Opportunity (US$ Bn), by Others, 2022 – 2031
Figure 24: Global Mobile Point-of-Sale (mPOS) Terminals Market Opportunity (US$ Bn), by Region
Figure 25: Global Mobile Point-of-Sale (mPOS) Terminals Market Opportunity Share (%), by Region, 2022–2031
Figure 26: Global Mobile Point-of-Sale (mPOS) Terminals Market Size (US$ Bn), by Region, 2022 & 2031
Figure 27: Global Mobile Point-of-Sale (mPOS) Terminals Market Value Share Analysis, by Region, 2022
Figure 28: Global Mobile Point-of-Sale (mPOS) Terminals Market Value Share Analysis, by Region, 2031
Figure 29: North America Mobile Point-of-Sale (mPOS) Terminals Market Absolute Opportunity (US$ Bn), 2022 – 2031
Figure 30: Europe Mobile Point-of-Sale (mPOS) Terminals Market Absolute Opportunity (US$ Bn), 2022 – 2031
Figure 31: Asia Pacific Mobile Point-of-Sale (mPOS) Terminals Market Absolute Opportunity (US$ Bn), 2022 – 2031
Figure 32: Middle East & Africa Mobile Point-of-Sale (mPOS) Terminals Market Absolute Opportunity (US$ Bn), 2022 – 2031
Figure 33: South America Mobile Point-of-Sale (mPOS) Terminals Market Absolute Opportunity (US$ Bn), 2022 – 2031
Figure 34: North America Mobile Point-of-Sale (mPOS) Terminals Market Revenue Opportunity Share, by Component
Figure 35: North America Mobile Point-of-Sale (mPOS) Terminals Market Revenue Opportunity Share, by Region
Figure 36: North America Mobile Point-of-Sale (mPOS) Terminals Market Revenue Opportunity Share, by End-use
Figure 37: North America Mobile Point-of-Sale (mPOS) Terminals Market Value Share Analysis, by Component, 2022
Figure 38: North America Mobile Point-of-Sale (mPOS) Terminals Market Value Share Analysis, by Component, 2031
Figure 39: North America Mobile Point-of-Sale (mPOS) Terminals Market Absolute Opportunity (US$ Bn), by POS Terminals, 2022 – 2031
Figure 40: North America Mobile Point-of-Sale (mPOS) Terminals Market Absolute Opportunity (US$ Bn), by POS Software, 2022 – 2031
Figure 41: North America Mobile Point-of-Sale (mPOS) Terminals Market Absolute Opportunity (US$ Bn), by Services, 2022 – 2031
Figure 42: North America Mobile Point-of-Sale (mPOS) Terminals Market Value Share Analysis, by End-user, 2022
Figure 43: North America Mobile Point-of-Sale (mPOS) Terminals Market Value Share Analysis, by End-user, 2031
Figure 44: North America Mobile Point-of-Sale (mPOS) Terminals Market Absolute Opportunity (US$ Bn), by Retail, 2022 – 2031
Figure 45: North America Mobile Point-of-Sale (mPOS) Terminals Market Absolute Opportunity (US$ Bn), by Restaurants, 2022 – 2031
Figure 46: North America Mobile Point-of-Sale (mPOS) Terminals Market Absolute Opportunity (US$ Bn), by Healthcare, 2022 – 2031
Figure 47: North America Mobile Point-of-Sale (mPOS) Terminals Market Absolute Opportunity (US$ Bn), by Hospitality, 2022 – 2031
Figure 48: North America Mobile Point-of-Sale (mPOS) Terminals Market Absolute Opportunity (US$ Bn), by Entertainment , 2022 – 2031
Figure 49: North America Mobile Point-of-Sale (mPOS) Terminals Market Absolute Opportunity (US$ Bn), by Others, 2022 – 2031
Figure 50: North America Mobile Point-of-Sale (mPOS) Terminals Market Value Share Analysis, by Country, 2022
Figure 51: North America Mobile Point-of-Sale (mPOS) Terminals Market Value Share Analysis, by Country, 2031
Figure 52: U.S. Mobile Point-of-Sale (mPOS) Terminals Market Opportunity Growth Analysis (US$ Bn) Forecast, 2022 – 2031
Figure 53: Canada Mobile Point-of-Sale (mPOS) Terminals Market Opportunity Growth Analysis (US$ Bn) Forecast, 2022 – 2031
Figure 54: Mexico Mobile Point-of-Sale (mPOS) Terminals Market Opportunity Growth Analysis (US$ Bn) Forecast, 2022 – 2031
Figure 55: Europe Mobile Point-of-Sale (mPOS) Terminals Market Revenue Opportunity Share, by Component
Figure 56: Europe Mobile Point-of-Sale (mPOS) Terminals Market Revenue Opportunity Share, by Region
Figure 57: Europe Mobile Point-of-Sale (mPOS) Terminals Market Revenue Opportunity Share, by End-user
Figure 58: Europe Mobile Point-of-Sale (mPOS) Terminals Market Value Share Analysis, by Component, 2022
Figure 59: Europe Mobile Point-of-Sale (mPOS) Terminals Market Value Share Analysis, by Component, 2031
Figure 60: Europe Mobile Point-of-Sale (mPOS) Terminals Market Absolute Opportunity (US$ Bn), by POS Terminals, 2022 – 2031
Figure 61: Europe Mobile Point-of-Sale (mPOS) Terminals Market Absolute Opportunity (US$ Bn), by POS Software, 2022 – 2031
Figure 62: Europe Mobile Point-of-Sale (mPOS) Terminals Market Absolute Opportunity (US$ Bn), by Services, 2022 – 2031
Figure 63: Europe Mobile Point-of-Sale (mPOS) Terminals Market Value Share Analysis, by End-user, 2022
Figure 64: Europe Mobile Point-of-Sale (mPOS) Terminals Market Value Share Analysis, by End-user, 2031
Figure 65: Europe Mobile Point-of-Sale (mPOS) Terminals Market Absolute Opportunity (US$ Bn), by Retail, 2022 – 2031
Figure 66: Europe Mobile Point-of-Sale (mPOS) Terminals Market Absolute Opportunity (US$ Bn), by Restaurants, 2022 – 2031
Figure 67: Europe Mobile Point-of-Sale (mPOS) Terminals Market Absolute Opportunity (US$ Bn), by Healthcare, 2022 – 2031
Figure 68: Europe Mobile Point-of-Sale (mPOS) Terminals Market Absolute Opportunity (US$ Bn), by Hospitality, 2022 – 2031
Figure 69: Europe Mobile Point-of-Sale (mPOS) Terminals Market Absolute Opportunity (US$ Bn), by Entertainment , 2022 – 2031
Figure 70: Europe Mobile Point-of-Sale (mPOS) Terminals Market Absolute Opportunity (US$ Bn), by Others, 2022 – 2031
Figure 71: Europe Mobile Point-of-Sale (mPOS) Terminals Market Value Share Analysis, by Country, 2022
Figure 72: Europe Mobile Point-of-Sale (mPOS) Terminals Market Value Share Analysis, by Country, 2031
Figure 73: Germany Mobile Point-of-Sale (mPOS) Terminals Market Opportunity Growth Analysis (US$ Bn) Forecast, 2022 – 2031
Figure 74: U.K. Mobile Point-of-Sale (mPOS) Terminals Market Opportunity Growth Analysis (US$ Bn) Forecast, 2022 – 2031
Figure 75: France Mobile Point-of-Sale (mPOS) Terminals Market Opportunity Growth Analysis (US$ Bn) Forecast, 2022 – 2031
Figure 76: Spain Mobile Point-of-Sale (mPOS) Terminals Market Opportunity Growth Analysis (US$ Bn) Forecast, 2022 – 2031
Figure 77: Italy Mobile Point-of-Sale (mPOS) Terminals Market Opportunity Growth Analysis (US$ Bn) Forecast, 2022 – 2031
Figure 78: Asia Pacific Mobile Point-of-Sale (mPOS) Terminals Market Revenue Opportunity Share, by Component
Figure 79: Asia Pacific Mobile Point-of-Sale (mPOS) Terminals Market Revenue Opportunity Share, by Region
Figure 80: Asia Pacific Mobile Point-of-Sale (mPOS) Terminals Market Revenue Opportunity Share, by End-use
Figure 81: Asia Pacific Mobile Point-of-Sale (mPOS) Terminals Market Value Share Analysis, by Component, 2022
Figure 82: Asia Pacific Mobile Point-of-Sale (mPOS) Terminals Market Value Share Analysis, by Component, 2031
Figure 83: Asia Pacific Mobile Point-of-Sale (mPOS) Terminals Market Absolute Opportunity (US$ Bn), by POS Terminals, 2022 – 2031
Figure 84: Asia Pacific Mobile Point-of-Sale (mPOS) Terminals Market Absolute Opportunity (US$ Bn), by POS Software, 2022 – 2031
Figure 85: Asia Pacific Mobile Point-of-Sale (mPOS) Terminals Market Absolute Opportunity (US$ Bn), by Services, 2022 – 2031
Figure 86: Asia Pacific Mobile Point-of-Sale (mPOS) Terminals Market Value Share Analysis, by End-user, 2022
Figure 87: Asia Pacific Mobile Point-of-Sale (mPOS) Terminals Market Value Share Analysis, by End-user, 2031
Figure 88: Asia Pacific Mobile Point-of-Sale (mPOS) Terminals Market Absolute Opportunity (US$ Bn), by Retail, 2022 – 2031
Figure 89: Asia Pacific Mobile Point-of-Sale (mPOS) Terminals Market Absolute Opportunity (US$ Bn), by Restaurants, 2022 – 2031
Figure 90: Asia Pacific Mobile Point-of-Sale (mPOS) Terminals Market Absolute Opportunity (US$ Bn), by Healthcare, 2022 – 2031
Figure 91: Asia Pacific Mobile Point-of-Sale (mPOS) Terminals Market Absolute Opportunity (US$ Bn), by Hospitality, 2022 – 2031
Figure 92: Asia Pacific Mobile Point-of-Sale (mPOS) Terminals Market Absolute Opportunity (US$ Bn), by Entertainment , 2022 – 2031
Figure 93: Asia Pacific Mobile Point-of-Sale (mPOS) Terminals Market Absolute Opportunity (US$ Bn), by Others, 2022 – 2031
Figure 94: Asia Pacific Mobile Point-of-Sale (mPOS) Terminals Market Value Share Analysis, by Country, 2022
Figure 95: Asia Pacific Mobile Point-of-Sale (mPOS) Terminals Market Value Share Analysis, by Country, 2031
Figure 96: China Mobile Point-of-Sale (mPOS) Terminals Market Opportunity Growth Analysis (US$ Bn) Forecast, 2022 – 2031
Figure 97: India Mobile Point-of-Sale (mPOS) Terminals Market Opportunity Growth Analysis (US$ Bn) Forecast, 2022 – 2031
Figure 98: Japan Mobile Point-of-Sale (mPOS) Terminals Market Opportunity Growth Analysis (US$ Bn) Forecast, 2022 – 2031
Figure 99: ASEAN Mobile Point-of-Sale (mPOS) Terminals Market Opportunity Growth Analysis (US$ Bn) Forecast, 2022 – 2031
Figure 100: Middle East & Africa Mobile Point-of-Sale (mPOS) Terminals Market Revenue Opportunity Share, by Component
Figure 101: Middle East & Africa Mobile Point-of-Sale (mPOS) Terminals Market Revenue Opportunity Share, by Region
Figure 102: Middle East & Africa Mobile Point-of-Sale (mPOS) Terminals Market Revenue Opportunity Share, by End-user
Figure 103: Middle East & Africa Mobile Point-of-Sale (mPOS) Terminals Market Value Share Analysis, by Component, 2022
Figure 104: Middle East & Africa Mobile Point-of-Sale (mPOS) Terminals Market Value Share Analysis, by Component, 2031
Figure 105: Middle East & Africa Mobile Point-of-Sale (mPOS) Terminals Market Absolute Opportunity (US$ Bn), by POS Terminals, 2022 – 2031
Figure 106: Middle East & Africa Mobile Point-of-Sale (mPOS) Terminals Market Absolute Opportunity (US$ Bn), by POS Software, 2022 – 2031
Figure 107: Middle East & Africa Mobile Point-of-Sale (mPOS) Terminals Market Absolute Opportunity (US$ Bn), by Services, 2022 – 2031
Figure 108: Middle East & Africa Mobile Point-of-Sale (mPOS) Terminals Market Value Share Analysis, by End-user, 2022
Figure 109: Middle East & Africa Mobile Point-of-Sale (mPOS) Terminals Market Value Share Analysis, by End-user, 2031
Figure 110: Middle East & Africa Mobile Point-of-Sale (mPOS) Terminals Market Absolute Opportunity (US$ Bn), by Retail, 2022 – 2031
Figure 111: Middle East & Africa Mobile Point-of-Sale (mPOS) Terminals Market Absolute Opportunity (US$ Bn), by Restaurants, 2022 – 2031
Figure 112: Middle East & Africa Mobile Point-of-Sale (mPOS) Terminals Market Absolute Opportunity (US$ Bn), by Healthcare, 2022 – 2031
Figure 113: Middle East & Africa Mobile Point-of-Sale (mPOS) Terminals Market Absolute Opportunity (US$ Bn), by Hospitality, 2022 – 2031
Figure 114: Middle East & Africa Mobile Point-of-Sale (mPOS) Terminals Market Absolute Opportunity (US$ Bn), by Entertainment , 2022 – 2031
Figure 115: Middle East & Africa Mobile Point-of-Sale (mPOS) Terminals Market Absolute Opportunity (US$ Bn), by Others, 2022 – 2031
Figure 116: Middle East & Africa Mobile Point-of-Sale (mPOS) Terminals Market Value Share Analysis, by Country, 2022
Figure 117: Middle East & Africa Mobile Point-of-Sale (mPOS) Terminals Market Value Share Analysis, by Country, 2031
Figure 118: Saudi Arabia Mobile Point-of-Sale (mPOS) Terminals Market Opportunity Growth Analysis (US$ Bn) Forecast, 2022 – 2031
Figure 119: United Arab Emirates Mobile Point-of-Sale (mPOS) Terminals Market Opportunity Growth Analysis (US$ Bn) Forecast, 2022 – 2031
Figure 120: South Africa Mobile Point-of-Sale (mPOS) Terminals Market Opportunity Growth Analysis (US$ Bn) Forecast, 2022 – 2031
Figure 121: South America Mobile Point-of-Sale (mPOS) Terminals Market Revenue Opportunity Share, by Component
Figure 122: South America Mobile Point-of-Sale (mPOS) Terminals Market Revenue Opportunity Share, by End-user
Figure 123: South America Mobile Point-of-Sale (mPOS) Terminals Market Revenue Opportunity Share, by Region
Figure 124: South America Mobile Point-of-Sale (mPOS) Terminals Market Value Share Analysis, by Component, 2022
Figure 125: South America Mobile Point-of-Sale (mPOS) Terminals Market Value Share Analysis, by Component, 2031
Figure 126: South America Mobile Point-of-Sale (mPOS) Terminals Market Absolute Opportunity (US$ Bn), by POS Terminals, 2022 – 2031
Figure 126: South America Mobile Point-of-Sale (mPOS) Terminals Market Absolute Opportunity (US$ Bn), by POS Software, 2022 – 2031
Figure 127: South America Mobile Point-of-Sale (mPOS) Terminals Market Absolute Opportunity (US$ Bn), by Services, 2022 – 2031
Figure 128: South America Mobile Point-of-Sale (mPOS) Terminals Market Value Share Analysis, by End-user, 2022
Figure 128: South America Mobile Point-of-Sale (mPOS) Terminals Market Value Share Analysis, by End-user, 2031
Figure 129: South America Mobile Point-of-Sale (mPOS) Terminals Market Absolute Opportunity (US$ Bn), by Retail, 2022 – 2031
Figure 130: South America Mobile Point-of-Sale (mPOS) Terminals Market Absolute Opportunity (US$ Bn), by Restaurants, 2022 – 2031
Figure 131: South America Mobile Point-of-Sale (mPOS) Terminals Market Absolute Opportunity (US$ Bn), by Healthcare, 2022 – 2031
Figure 132: South America Mobile Point-of-Sale (mPOS) Terminals Market Absolute Opportunity (US$ Bn), by Hospitality, 2022 – 2031
Figure 133: South America Mobile Point-of-Sale (mPOS) Terminals Market Absolute Opportunity (US$ Bn), by Entertainment , 2022 – 2031
Figure 134: South America Mobile Point-of-Sale (mPOS) Terminals Market Absolute Opportunity (US$ Bn), by Others, 2022 – 2031
Figure 135: South America Mobile Point-of-Sale (mPOS) Terminals Market Value Share Analysis, by Country, 2022
Figure 136: South America Mobile Point-of-Sale (mPOS) Terminals Market Value Share Analysis, by Country, 2031
Figure 137: South America Mobile Point-of-Sale (mPOS) Terminals Market Value Share Analysis, by Country, 2022
Figure 138: South America Mobile Point-of-Sale (mPOS) Terminals Market Value Share Analysis, by Country, 2031
Figure 139: Brazil Mobile Point-of-Sale (mPOS) Terminals Market Opportunity Growth Analysis (US$ Bn) Forecast, 2022 – 2031
Figure 140: Argentina Mobile Point-of-Sale (mPOS) Terminals Market Opportunity Growth Analysis (US$ Bn) Forecast, 2022 – 2031
Copyright © Transparency Market Research, Inc. All Rights reserved
Trust Online

Mobile Point-of-Sale (mPOS) Terminals Market