
Reports
Reports
Analysts’ Viewpoint on Mobile Cobots Market Scenario
Mobile cobot solutions are currently being gaining popularity in various applications, thereby boosting safety and efficiency in hazardous industrial situations. Smaller platforms, as well as systems capable of handling significantly bigger payloads, are being added to the collaborative robotics sector. Mobile collaborative robots, or cobots, are becoming mainstream. Small payload mobile cobots have been gaining traction for the last few years, accounting for more than one-third of the industry. Current innovations in the mobile cobots industry are led by firms with mobile chassis (AMR) and collaborative robot arms, while integrators also play an important role in the technology's end-use penetration. Collaborative mobile robotics technologies, such as computer vision and mechanical sensing, continue to evolve in order to cater to specialized fields. Consequently, the numerous advantages of mobile cobots promise a growing market.
Mobile cobots are the integration of mobile robots and mobile manipulators or end effectors having collaborative nature. The combination of collaborative and mobile robots provides companies more flexibility by enabling them to rapidly and cost-effectively adapt their production lines to new requirements and changing business needs.
The idea of Industry 4.0 has spread all over the world and currently, it is being implemented on a large-scale worldwide. Principles of the ‘Industry 4.0’ design include interoperability, information transparency, technical assistance, and decentralized decisions. Collaborative robots are fully compatible with the principles of ‘Industry 4.0’. Cobots are designed to be equipped with powerful onboard computers. They are interoperable and they can be easily integrated to IoT in any factory environment. Additionally, they offer information transparency and technical assistance. They can facilitate decentralized decisions.
Cobots are a perfect choice for situations where flexibility is more important than speed, thanks to user-friendly software tools and built-in sensor capabilities. Businesses require clever user-friendly camera and image processing systems; machine vision systems with localization capabilities are one example, which recognize patterns, perform quality control, arrange things, and read bar codes.
The primary objective of mobile cobots is to conduct repetitive assembly cycles and tasks step-by-step with high accuracy and reliable execution. They boost productivity and safety at work while providing high levels of precision. Therefore, the market for mobile cobots is anticipated to grow during the forecast period owing to their high accuracy and falling price.
The potential of the collaborative robot rests on its basic definition ‒ collaboration. Collaborative robots are made to work alongside people, unlike fixed systems that need to be crated and fenced off to protect worker safety. When people are around, cobots can detect them and can prevent their arms from swinging or hurting them.
Analysis of the mobile collaborative robots market trends indicate that cobots as being employed for palleting, inspection tasks, machine tending and maintenance, loading and unloading materials, and various other manufacturing tasks. They can be valuable partners for delicate or dangerous tasks associated with machine tending, because they can be implemented near workers. Improvements in sensors, computer vision, and connectivity are helping cobots become safer, which is especially important for emerging mobile manipulation.
The mobile collaborative robots market research report states that the presence of robots across every major industry, ranging from automotive and electrical & electronics industries to pharmaceutical & cosmetics and food & beverage industries, is expected to boost the market at a notable CAGR between 2022 and 2031.
Traditional industrial robots are built and programmed to do a single task at a distance from workers on the manufacturing or assembly floor and they seem to have favored larger industries first. Smaller manufacturing businesses have had a more challenging time reaping the benefits of automation delivered by robots. Cobots, however, are promising to be a game-changer for all large and small manufacturing. Mobile tablets and devices on the production floor serve as an essential conduit in getting the most out of these sturdy workhorses.
Small business have a low threshold for capital investment, unlike large-scale sectors such as automobile or electronics manufacture. They also have a poor tolerance for risk and a short window of opportunity before seeing a return on their investment. The mobile cobot industry may be hampered by the very specialized and case-by-case nature of the applications.
Mobile cobots are lightweight, space-saving, and easy to re-deploy to multiple applications without changing the production layout. They can easily be transported around the factory floor or facility because they are compact and lightweight. Once at their new location, operators can move between duties fast due to simple and clear GUIs. Several versions, such as autonomous mobile cobots, can also be programmed for new operations. Small and medium-sized manufacturers, particularly those operating in high-mix/low-volume and just-in-time (JIT) environments, benefit from this flexibility.
Cobots are hugely flexible by picking the right gripper, vision component, software modules or sensors; every cobot can be optimized for a large variety of workflows or tasks.
In terms of component, the global mobile cobots market has been classified into hardware, software, and services, where the hardware segment has been further divided into collaborative arm, AMR, vision systems, and other accessories. The hardware segment held a prominent share of the global market in 2021. Furthermore, the mobile cobots market share held by the hardware segment expected to expand at a notable pace during the forecast period. A wide range of tasks can be accomplished owing to the versatility and flexibility of the end effectors, thereby maximizing return on investment.
The robot arm is the most crucial element of a cobot application, which distinguishes it from others. Without a robotic arm, businesses would be forced to deploy big, space-consuming industrial robots. Some people may find that traditional robotics solutions are simply too expensive or too large for their floorspace. Automation and robotics are now available to a completely new group of smaller firms thanks to collaborative robot arms.
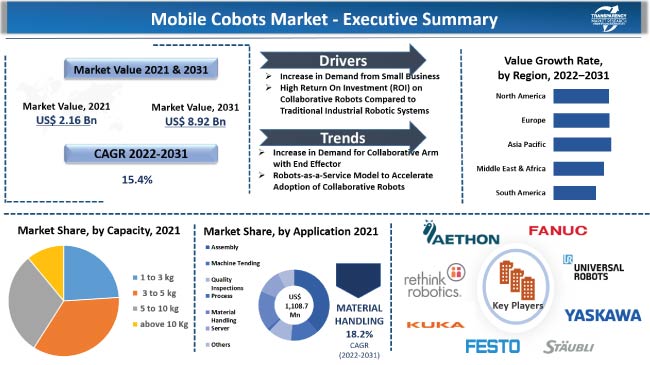
Europe dominated the global mobile cobots market and held around 32.5% share in 2021. The market is expanding owing to the numerous industry participants operating in the region and significant amount of research and development activities being carried out on mobile cobots. North America and Asia Pacific are also major markets of mobile cobots, and they held value shares of 28.2% and 26.7% respectively, in 2021.
Several market players are investing in the market for mobile cobots attracted by the rapidly expanding market and underlying latent demand. Manufacturers of products ranging from sensors to accessories and companies across various industries are striving to strengthen their foothold in the mobile cobots market. Some of the prominent players operating in the mobile cobots market and profiled in the study are Universal Robots, ABB Ltd, Aubo Robotics, Fanuc Corporation, Kawasaki Heavy Industries, Ltd., KUKA AG, Precise Automation, Inc., Rethink Robotics, Robert Bosch, TECHMAN Robots, Universal Robots, and Yasakawa Electric Corporation. These companies are focused on expansion of their business through strategic acquisitions and partnerships.
Each of these players has been profiled in the Mobile Cobots market report based on parameters such as company overview, financial overview, business strategies, product portfolio, business segments, and recent developments
|
Attribute |
Detail |
|
Market Size Value in 2021 |
US$ 2.1 Bn |
|
Market Forecast Value in 2031 |
US$ 8.9 Bn |
|
Growth Rate (CAGR) |
15.4% |
|
Forecast Period |
2022–2031 |
|
Historical Data Available for |
2017–2020 |
|
Quantitative Units |
US$ Bn for Value |
|
Market Analysis |
It includes cross segment analysis at global as well as regional level. Furthermore, qualitative analysis includes drivers, restraints, opportunities, key trends, Porter’s Five Forces analysis, value chain analysis, and key trend analysis. |
|
Competition Landscape |
|
|
Format |
Electronic (PDF) + Excel |
|
Market Segmentation |
|
|
Regions Covered |
|
|
Countries Covered |
|
|
Companies Profiled |
|
|
Customization Scope |
Available upon request |
|
Pricing |
Available upon request |
The mobile cobots market stood at US$ 2.1 Bn in 2021
The mobile cobots market is estimated to advance at a CAGR of 15.4% during the forecast period
The mobile cobots market is expected to reach US$ 8.9 Bn by 2031
KUKA AG, Locus Robotics, Mobile Industrial Robots A/S, OMRON Corporation, Precise Automation, Inc., Rethink Robotics, Robotnik, SICK, Stäubli International AG, TECHMAN ROBOT INC, Universal Robots.
Europe accounted for 32.5% share of the global mobile cobots market in 2021
Increase in demand for small payload cobots from smaller business and rise in demand for collaborative arm with end effector
Asia Pacific is a highly lucrative region of the global mobile cobots market
1. Preface
1.1. Research Scope.
1.2. Mobile Cobots Market Overview
1.3. Market and Segments Definition
1.4. Market Taxonomy
1.5. Research Methodology
1.6. Assumption and Acronyms
2. Executive Summary
2.1. Global Mobile Cobots Market Analysis and Forecast
2.2. Regional Outline
2.3. Market Dynamics Snapshot
2.4. Competition Blueprint
3. Market Dynamics
3.1. Macro-economic Factors
3.2. Key Market Indicator
3.3. Drivers
3.4. Restraints
3.5. Opportunities
3.6. Trends
4. Associated Industry and Key Indicator Assessment
4.1. Parent Industry Overview – Global Robotics Industry Overview
4.2. Supply Chain Analysis
4.3. Pricing Analysis
4.4. Industry SWOT Analysis
4.5. Porter Five Forces Analysis
4.6. COVID-19 Impact Analysis
5. Global Mobile Cobots Market Analysis, by Component
5.1. Global Mobile Cobots Market Size (US$ Bn) Analysis & Forecast, by Component, 2017‒2031
5.1.1. Hardware
5.1.1.1. Arm/End Effector
5.1.1.2. AMR
5.1.1.3. Controller
5.1.1.4. Vision System
5.1.1.5. Accessories
5.1.2. Software
5.1.3. Services
5.2. Global Mobile Cobots Market Attractiveness Analysis, by Component
6. Global Mobile Cobots Market Analysis, by Capacity
6.1. Global Mobile Cobots Market Size (US$ Bn) and Volume (Thousand Units) Analysis & Forecast, by Capacity, 2017‒2031
6.1.1. 1 to 3 kg
6.1.2. 3 to 5 kg
6.1.3. 5 to 10 kg
6.1.4. Above 10 Kg
6.2. Global Mobile Cobots Market Attractiveness Analysis, by Capacity
7. Global Mobile Cobots Market Analysis, by Application
7.1. Global Mobile Cobots Market Size (US$ Bn) Analysis & Forecast, by Application, 2017‒2031
7.1.1. Assembly
7.1.2. Machine Tending
7.1.3. Quality Inspections
7.1.4. Process (Material Removal/gluing/dispensing/welding/finishing)
7.1.5. Material Handling
7.1.6. Others (Maintenances Activities, Packaging, Inventory, etc.)
7.2. Global Mobile Cobots Market Attractiveness Analysis, by Application
8. Global Mobile Cobots Market Analysis, by End-use Industry
8.1. Global Mobile Cobots Market Size (US$ Bn) Analysis & Forecast, by End-use Industry, 2017‒2031
8.1.1. Automotive
8.1.2. Retail
8.1.3. Healthcare
8.1.4. Electronics & Semiconductor
8.1.5. Food and Beverage
8.1.6. Aerospace and Defense
8.1.7. Others (Metal & Machining, Agriculture, etc.)
8.2. Global Mobile Cobots Market Attractiveness Analysis, by End-use Industry
9. Global Mobile Cobots Market Analysis and Forecast, by Region
9.1. Global Mobile Cobots Market Size (US$ Bn) and Volume (Thousand Units) Analysis & Forecast, by Region, 2017 – 2031
9.1.1. North America
9.1.2. Europe
9.1.3. Asia Pacific
9.1.4. Middle East & Africa
9.1.5. South America
9.2. Global Mobile Cobots Market Attractiveness Analysis, by Region
10. North America Mobile Cobots Market Analysis and Forecast
10.1. Market Snapshot
10.2. North America Mobile Cobots Market Size (US$ Bn) Analysis & Forecast, by Component, 2017‒2031
10.2.1. Hardware
10.2.1.1. Arm/End Effector
10.2.1.2. AMR
10.2.1.3. Controller
10.2.1.4. Vision System
10.2.1.5. Accessories
10.2.2. Software
10.2.3. Services
10.3. North America Mobile Cobots Market Size (US$ Bn) and Volume (Thousand Units) Analysis & Forecast, by Capacity, 2017‒2031
10.3.1. 1 to 3 kg
10.3.2. 3 to 5 kg
10.3.3. 5 to 10 kg
10.3.4. Above 10 Kg
10.4. North America Mobile Cobots Market Size (US$ Bn) Analysis & Forecast, by Application, 2017‒2031
10.4.1. Assembly
10.4.2. Machine Tending
10.4.3. Quality Inspections
10.4.4. Process (Material Removal/gluing/dispensing/welding/finishing)
10.4.5. Material Handling
10.4.6. Others (Maintenances Activities, Packaging, Inventory, etc.)
10.5. North America Mobile Cobots Market Size (US$ Bn) Analysis & Forecast, by End-use Industry, 2017‒2031
10.5.1. Automotive
10.5.2. Retail
10.5.3. Healthcare
10.5.4. Electronics & Semiconductor
10.5.5. Food and Beverage
10.5.6. Aerospace and Defense
10.5.7. Others (Metal & Machining, Agriculture, etc.)
10.6. North America Mobile Cobots Market Size (US$ Bn) and Volume (Thousand Units) Analysis & Forecast, by Country & Sub-region, 2017 – 2031
10.6.1. U.S.
10.6.2. Canada
10.6.3. Mexico
10.7. North America Mobile Cobots Market Attractiveness Analysis
10.7.1. By Component
10.7.2. By Capacity
10.7.3. By Application
10.7.4. By End-use Industry
10.7.5. By Country & Sub-region
11. Europe Mobile Cobots Market Analysis and Forecast
11.1. Market Snapshot
11.2. Europe Mobile Cobots Market Size (US$ Bn) Analysis & Forecast, by Component, 2017‒2031
11.2.1. Hardware
11.2.1.1. Arm/End Effector
11.2.1.2. AMR
11.2.1.3. Controller
11.2.1.4. Vision System
11.2.1.5. Accessories
11.2.2. Software
11.2.3. Services
11.3. Europe Mobile Cobots Market Size (US$ Bn) and Volume (Thousand Units) Analysis & Forecast, by Capacity, 2017‒2031
11.3.1. 1 to 3 kg
11.3.2. 3 to 5 kg
11.3.3. 5 to 10 kg
11.3.4. Above 10 Kg
11.4. Europe Mobile Cobots Market Size (US$ Bn) Analysis & Forecast, by Application, 2017‒2031
11.4.1. Assembly
11.4.2. Machine Tending
11.4.3. Quality Inspections
11.4.4. Process(Material Removal/gluing/dispensing/welding/finishing)
11.4.5. Material Handling
11.4.6. Others (Maintenances Activities, Packaging, Inventory, etc.)
11.5. Europe Mobile Cobots Market Size (US$ Bn) Analysis & Forecast, by End-use Industry, 2017‒2031
11.5.1. Automotive
11.5.2. Retail
11.5.3. Healthcare
11.5.4. Electronics & Semiconductor
11.5.5. Food and Beverage
11.5.6. Aerospace and Defense
11.5.7. Others (Metal & Machining, Agriculture, etc.)
11.6. Europe Mobile Cobots Market Size (US$ Bn) and Volume (Thousand Units) Analysis & Forecast, by Country & Sub-region, 2017 – 2031
11.6.1. U.K.
11.6.2. Germany
11.6.3. France
11.6.4. Rest of Europe
11.7. Europe Mobile Cobots Market Attractiveness Analysis
11.7.1. By Component
11.7.2. By Capacity
11.7.3. By Application
11.7.4. By End-use Industry
11.7.5. By Country & Sub-region
12. Asia Pacific Mobile Cobots Market Analysis and Forecast
12.1. Market Snapshot
12.2. Asia Pacific Mobile Cobots Market Size (US$ Bn) Analysis & Forecast, by Component, 2017‒2031
12.2.1. Hardware
12.2.1.1. Arm/End Effector
12.2.1.2. AMR
12.2.1.3. Controller
12.2.1.4. Vision System
12.2.1.5. Accessories
12.2.2. Software
12.2.3. Services
12.3. Asia Pacific Mobile Cobots Market Size (US$ Bn) and Volume (Thousand Units) Analysis & Forecast, by Capacity, 2017‒2031
12.3.1. 1 to 3 kg
12.3.2. 3 to 5 kg
12.3.3. 5 to 10 kg
12.3.4. Above 10 Kg
12.4. Asia Pacific Mobile Cobots Market Size (US$ Bn) Analysis & Forecast, by Application, 2017‒2031
12.4.1. Assembly
12.4.2. Machine Tending
12.4.3. Quality Inspections
12.4.4. Process(Material Removal/gluing/dispensing/welding/finishing)
12.4.5. Material Handling
12.4.6. Others (Maintenances Activities, Packaging, Inventory, etc.)
12.5. Asia Pacific Mobile Cobots Market Size (US$ Bn) Analysis & Forecast, by End-use Industry, 2017‒2031
12.5.1. Automotive
12.5.2. Retail
12.5.3. Healthcare
12.5.4. Electronics & Semiconductor
12.5.5. Food and Beverage
12.5.6. Aerospace and Defense
12.5.7. Others (Metal & Machining, Agriculture, etc.)
12.6. Asia Pacific Mobile Cobots Market Size (US$ Bn) and Volume (Thousand Units) Analysis & Forecast, by Country & Sub-region, 2017 – 2031
12.6.1. China
12.6.2. India
12.6.3. Japan
12.6.4. South Korea
12.6.5. ASEAN
12.6.6. Rest of Asia Pacific
12.7. Asia Pacific Mobile Cobots Market Attractiveness Analysis
12.7.1. By Component
12.7.2. By Capacity
12.7.3. By Application
12.7.4. By End-use Industry
12.7.5. By Country & Sub-region
13. Middle East & Africa (MEA) Mobile Cobots Market Analysis and Forecast
13.1. Market Snapshot
13.2. MEA Mobile Cobots Market Size (US$ Bn) Analysis & Forecast, by Component, 2017‒2031
13.2.1. Hardware
13.2.1.1. Arm/End Effector
13.2.1.2. AMR
13.2.1.3. Controller
13.2.1.4. Vision System
13.2.1.5. Accessories
13.2.2. Software
13.2.3. Services
13.3. MEA Mobile Cobots Market Size (US$ Bn) and Volume (Thousand Units) Analysis & Forecast, by Capacity, 2017‒2031
13.3.1. 1 to 3 kg
13.3.2. 3 to 5 kg
13.3.3. 5 to 10 kg
13.3.4. Above 10 Kg
13.4. MEA Mobile Cobots Market Size (US$ Bn) Analysis & Forecast, by Application, 2017‒2031
13.4.1. Assembly
13.4.2. Machine Tending
13.4.3. Quality Inspections
13.4.4. Process(Material Removal/gluing/dispensing/welding/finishing)
13.4.5. Material Handling
13.4.6. Others (Maintenances Activities, Packaging, Inventory, etc.)
13.5. MEA Mobile Cobots Market Size (US$ Bn) Analysis & Forecast, by End-use Industry, 2017‒2031
13.5.1. Automotive
13.5.2. Retail
13.5.3. Healthcare
13.5.4. Electronics & Semiconductor
13.5.5. Food and Beverage
13.5.6. Aerospace and Defense
13.5.7. Others (Metal & Machining, Agriculture, etc.)
13.6. MEA Mobile Cobots Market Size (US$ Bn) and Volume (Thousand Units) Analysis & Forecast, by Country & Sub-region, 2017 – 2031
13.6.1. GCC
13.6.2. South Africa
13.6.3. North Africa
13.6.4. Rest of Middle East & Africa
13.7. MEA Mobile Cobots Market Attractiveness Analysis
13.7.1. By Component
13.7.2. By Capacity
13.7.3. By Application
13.7.4. By End-use Industry
13.7.5. By Country & Sub-region
14. South America Mobile Cobots Market Analysis and Forecast
14.1. Market Snapshot
14.2. South America Mobile Cobots Market Size (US$ Bn) Analysis & Forecast, by Component, 2017‒2031
14.2.1. Hardware
14.2.1.1. Arm/End Effector
14.2.1.2. AMR
14.2.1.3. Controller
14.2.1.4. Vision System
14.2.1.5. Accessories
14.2.2. Software
14.2.3. Services
14.3. South America Mobile Cobots Market Size (US$ Bn) and Volume (Thousand Units) Analysis & Forecast, by Capacity, 2017‒2031
14.3.1. 1 to 3 kg
14.3.2. 3 to 5 kg
14.3.3. 5 to 10 kg
14.3.4. Above 10 Kg
14.4. South America Mobile Cobots Market Size (US$ Bn) Analysis & Forecast, by Application, 2017‒2031
14.4.1. Assembly
14.4.2. Machine Tending
14.4.3. Quality Inspections
14.4.4. Process (Material Removal/gluing/dispensing/welding/finishing)
14.4.5. Material Handling
14.4.6. Others (Maintenances Activities, Packaging, Inventory, etc.)
14.5. South America Mobile Cobots Market Size (US$ Bn) Analysis & Forecast, by End-use Industry, 2017‒2031
14.5.1. Automotive
14.5.2. Retail
14.5.3. Healthcare
14.5.4. Electronics & Semiconductor
14.5.5. Food and Beverage
14.5.6. Aerospace and Defense
14.5.7. Others (Metal & Machining, Agriculture, etc.)
14.6. South America Mobile Cobots Market Size (US$ Bn) and Volume (Thousand Units) Analysis & Forecast, by Country & Sub-region, 2017 – 2031
14.6.1. Brazil
14.6.2. Rest of South America
14.7. South America Mobile Cobots Market Attractiveness Analysis
14.7.1. By Component
14.7.2. By Capacity
14.7.3. By Application
14.7.4. By End-use Industry
14.7.5. By Country & Sub-region
15. Competition Assessment
15.1. Global Mobile Cobots Market Competition Matrix - a Dashboard View
15.2. Global Mobile Cobots Market Company Share Analysis, by Value (2020)
15.3. Technological Differentiator
16. Company Profiles (Manufacturers/Suppliers)
16.1. ABB
16.1.1. Overview
16.1.2. Product Portfolio
16.1.3. Sales Footprint
16.1.4. Key Subsidiaries or Distributors
16.1.5. Strategy and Recent Developments
16.1.6. Key Financials
16.2. Addverb Technologies Private Limited
16.2.1. Overview
16.2.2. Product Portfolio
16.2.3. Sales Footprint
16.2.4. Key Subsidiaries or Distributors
16.2.5. Strategy and Recent Developments
16.2.6. Key Financials
16.3. Aethon Inc.
16.3.1. Overview
16.3.2. Product Portfolio
16.3.3. Sales Footprint
16.3.4. Key Subsidiaries or Distributors
16.3.5. Strategy and Recent Developments
16.3.6. Key Financials
16.4. Aubo Robotics
16.4.1. Overview
16.4.2. Product Portfolio
16.4.3. Sales Footprint
16.4.4. Key Subsidiaries or Distributors
16.4.5. Strategy and Recent Developments
16.4.6. Key Financials
16.5. Denso Wave Incorporated.
16.5.1. Overview
16.5.2. Product Portfolio
16.5.3. Sales Footprint
16.5.4. Key Subsidiaries or Distributors
16.5.5. Strategy and Recent Developments
16.5.6. Key Financials
16.6. Doosan Robotics Inc.
16.6.1. Overview
16.6.2. Product Portfolio
16.6.3. Sales Footprint
16.6.4. Key Subsidiaries or Distributors
16.6.5. Strategy and Recent Developments
16.6.6. Key Financials
16.7. Fanuc Corporation
16.7.1. Overview
16.7.2. Product Portfolio
16.7.3. Sales Footprint
16.7.4. Key Subsidiaries or Distributors
16.7.5. Strategy and Recent Developments
16.7.6. Key Financials
16.8. HTE Technologies.
16.8.1. Overview
16.8.2. Product Portfolio
16.8.3. Sales Footprint
16.8.4. Key Subsidiaries or Distributors
16.8.5. Strategy and Recent Developments
16.8.6. Key Financials
16.9. Kawasaki Heavy Industries, Ltd.
16.9.1. Overview
16.9.2. Product Portfolio
16.9.3. Sales Footprint
16.9.4. Key Subsidiaries or Distributors
16.9.5. Strategy and Recent Developments
16.9.6. Key Financials
16.10. KUKA AG
16.10.1. Overview
16.10.2. Product Portfolio
16.10.3. Sales Footprint
16.10.4. Key Subsidiaries or Distributors
16.10.5. Strategy and Recent Developments
16.10.6. Key Financials
16.11. Locus Robotics.
16.11.1. Overview
16.11.2. Product Portfolio
16.11.3. Sales Footprint
16.11.4. Key Subsidiaries or Distributors
16.11.5. Strategy and Recent Developments
16.11.6. Key Financials
16.12. Mobile Industrial Robots A/S.
16.12.1. Overview
16.12.2. Product Portfolio
16.12.3. Sales Footprint
16.12.4. Key Subsidiaries or Distributors
16.12.5. Strategy and Recent Developments
16.12.6. Key Financials
16.13. OMRON Corporation
16.13.1. Overview
16.13.2. Product Portfolio
16.13.3. Sales Footprint
16.13.4. Key Subsidiaries or Distributors
16.13.5. Strategy and Recent Developments
16.13.6. Key Financials
16.14. Precise Automation, Inc.
16.14.1. Overview
16.14.2. Product Portfolio
16.14.3. Sales Footprint
16.14.4. Key Subsidiaries or Distributors
16.14.5. Strategy and Recent Developments
16.14.6. Key Financials
16.15. Rethink Robotics
16.15.1. Overview
16.15.2. Product Portfolio
16.15.3. Sales Footprint
16.15.4. Key Subsidiaries or Distributors
16.15.5. Strategy and Recent Developments
16.15.6. Key Financials
16.16. Robotnik
16.16.1. Overview
16.16.2. Product Portfolio
16.16.3. Sales Footprint
16.16.4. Key Subsidiaries or Distributors
16.16.5. Strategy and Recent Developments
16.16.6. Key Financials
16.17. SICK
16.17.1. Overview
16.17.2. Product Portfolio
16.17.3. Sales Footprint
16.17.4. Key Subsidiaries or Distributors
16.17.5. Strategy and Recent Developments
16.17.6. Key Financials
16.18. Stäubli International AG
16.18.1. Overview
16.18.2. Product Portfolio
16.18.3. Sales Footprint
16.18.4. Key Subsidiaries or Distributors
16.18.5. Strategy and Recent Developments
16.18.6. Key Financials
16.19. TECHMAN ROBOT INC
16.19.1. Overview
16.19.2. Product Portfolio
16.19.3. Sales Footprint
16.19.4. Key Subsidiaries or Distributors
16.19.5. Strategy and Recent Developments
16.19.6. Key Financials
16.20. Universal Robots
16.20.1. Overview
16.20.2. Product Portfolio
16.20.3. Sales Footprint
16.20.4. Key Subsidiaries or Distributors
16.20.5. Strategy and Recent Developments
16.20.6. Key Financials
16.21. Wyzo
16.21.1. Overview
16.21.2. Product Portfolio
16.21.3. Sales Footprint
16.21.4. Key Subsidiaries or Distributors
16.21.5. Strategy and Recent Developments
16.21.6. Key Financials
16.22. Yasakawa Electric Corporation
16.22.1. Overview
16.22.2. Product Portfolio
16.22.3. Sales Footprint
16.22.4. Key Subsidiaries or Distributors
16.22.5. Strategy and Recent Developments
16.22.6. Key Financials
17. Recommendation
17.1. Opportunity Assessment
17.1.1. By Component.
17.1.2. By Capacity
17.1.3. By Application
17.1.4. By End-use Industry
17.1.5. By Region
List of Tables
Table 1: Global Mobile Cobots Market Value (US$ Bn) & Forecast, by Component, 2017‒2031
Table 2: Global Mobile Cobots Market Value (US$ Bn) & Forecast, by Capacity, 2017‒2031
Table 3: Global Mobile Cobots Market Volume (Thousand Units) & Forecast, by Capacity, 2017‒2031
Table 4: Global Mobile Cobots Market Value (US$ Bn) & Forecast, by Application, 2017‒2031
Table 5: Global Mobile Cobots Market Value (US$ Bn) & Forecast, by End-use Industry, 2017‒2033
Table 6: Global Mobile Cobots Market Value (US$ Bn) & Forecast, by Region, 2017‒2031
Table 7: Global Mobile Cobots Market Volume (Thousand Units) & Forecast, by Region, 2017‒2031
Table 8: North America Mobile Cobots Market Value (US$ Bn) & Forecast, by Component, 2017‒2031
Table 9: North America Mobile Cobots Market Value (US$ Bn) & Forecast, by Capacity 2017‒2031
Table 10: North America Mobile Cobots Market Volume (Thousand Units) & Forecast, by Capacity 2017‒2031
Table 11: North America Mobile Cobots Market Value (US$ Bn) & Forecast, by Application 2017‒2031
Table 12: North America Mobile Cobots Market Value (US$ Bn) & Forecast, by End-use Industry, 2017‒2033
Table 13: North America Mobile Cobots Market Value (US$ Bn) & Forecast, by Country & Sub-region, 2017‒2031
Table 14: North America Mobile Cobots Market Volume (Thousand Units) & Forecast, by Country & Sub-region, 2017‒2031
Table 15: Europe Mobile Cobots Market Value (US$ Bn) & Forecast, by Component, 2017‒2031
Table 16: Europe Mobile Cobots Market Value (US$ Bn) & Forecast, by Capacity 2017‒2031
Table 17: Europe Mobile Cobots Market Volume (Thousand Units) & Forecast, by Capacity 2017‒2031
Table 18: Europe Mobile Cobots Market Value (US$ Bn) & Forecast, by Application 2017‒2031
Table 19: Europe Mobile Cobots Market Value (US$ Bn) & Forecast, by End-use Industry, 2017‒2033
Table 20: Europe Mobile Cobots Market Value (US$ Bn) & Forecast, by Country & Sub-region, 2017‒2031
Table 21: Europe Mobile Cobots Market Volume (Thousand Units) & Forecast, by Country & Sub-region, 2017‒2031
Table 22: Asia Pacific Mobile Cobots Market Value (US$ Bn) & Forecast, by Component, 2017‒2031
Table 23: Asia Pacific Mobile Cobots Market Value (US$ Bn) & Forecast, by Capacity 2017‒2031
Table 24: Asia Pacific Mobile Cobots Market Volume (Thousand Units) & Forecast, by Capacity 2017‒2031
Table 25: Asia Pacific Mobile Cobots Market Value (US$ Bn) & Forecast, by Application 2017‒2031
Table 26: Asia Pacific Mobile Cobots Market Value (US$ Bn) & Forecast, by End-use Industry, 2017‒2033
Table 27: Asia Pacific Mobile Cobots Market Value (US$ Bn) & Forecast, by Country & Sub-region, 2017‒2031
Table 28: Asia Pacific Mobile Cobots Market Volume (Thousand Units) & Forecast, by Country & Sub-region, 2017‒2031
Table 29: MEA Mobile Cobots Market Value (US$ Bn) & Forecast, by Component, 2017‒2031
Table 30: MEA Mobile Cobots Market Value (US$ Bn) & Forecast, by Capacity 2017‒2031
Table 31: MEA Mobile Cobots Market Volume (Thousand Units) & Forecast, by Capacity 2017‒2031
Table 32: MEA Mobile Cobots Market Value (US$ Bn) & Forecast, by Application 2017‒2031
Table 33: MEA Mobile Cobots Market Value (US$ Bn) & Forecast, by End-use Industry, 2017‒2033
Table 34: MEA Mobile Cobots Market Value (US$ Bn) & Forecast, by Country & Sub-region, 2017‒2031
Table 35: MEA Mobile Cobots Market Volume (Thousand Units) & Forecast, by Country & Sub-region, 2017‒2031
Table 36: South America Mobile Cobots Market Value (US$ Bn) & Forecast, by Component, 2017‒2031
Table 37: South America Mobile Cobots Market Value (US$ Bn) & Forecast, by Capacity 2017‒2031
Table 38: South America Mobile Cobots Market Volume (Thousand Units) & Forecast, by Capacity 2017‒2031
Table 39: South America Mobile Cobots Market Value (US$ Bn) & Forecast, by Application 2017‒2031
Table 40: South America Mobile Cobots Market Value (US$ Bn) & Forecast, by End-use Industry, 2017‒2033
Table 41: South America Mobile Cobots Market Value (US$ Bn) & Forecast, by Country & Sub-region, 2017‒2031
Table 42: South America Mobile Cobots Market Volume (Thousand Units) & Forecast, by Country & Sub-region, 2017‒2031
List of Figures
Figure 01: Global Mobile Cobots Market Size & Forecast, Y-O-Y, Value (US$ Bn), 2017‒2031
Figure 02: Global Mobile Cobots Market Size & Forecast, Volume (Thousand Units), 2017‒2031
Figure 03: Global Mobile Cobots Market Size & Forecast, Value (US$ Bn), 2017‒2031
Figure 04: Global Mobile Cobots Market Projections by Component, Value (US$ Bn), 2017‒2031
Figure 05: Global Mobile Cobots Market Share Analysis, by Component, 2021 and 2031
Figure 06: Global Mobile Cobots Market, Incremental Opportunity, by Component, 2021‒2031
Figure 07: Global Mobile Cobots Market Projections by Capacity, Value (US$ Bn), 2017‒2031
Figure 08: Global Mobile Cobots Market Share Analysis, by Capacity, 2021 and 2031
Figure 09: Global Mobile Cobots Market, Incremental Opportunity, by Capacity, 2021‒2031
Figure 10: Global Mobile Cobots Market Projections by Application, Value (US$ Bn), 2017‒2031
Figure 11: Global Mobile Cobots Market Share Analysis, by Application, 2021 and 2031
Figure 12: Global Mobile Cobots Market, Incremental Opportunity, by Application, 2021‒2031
Figure 13: Global Mobile Cobots Market Projections by End-use Industry, Value (US$ Bn), 2017‒2031
Figure 14: Global Mobile Cobots Market Share Analysis, by End-use Industry, 2021 and 2031
Figure 15: Global Mobile Cobots Market, Incremental Opportunity, by End-use Industry, 2021‒2031
Figure 16: Global Mobile Cobots Market Projections by Region, Value (US$ Bn), 2017‒2031
Figure 17: Global Mobile Cobots Market Share Analysis, by Region 2021 and 2031
Figure 18: Global Mobile Cobots Market, Incremental Opportunity, by Region, 2021‒2031
Figure 19: North America Mobile Cobots Market Size & Forecast, Y-O-Y, Value (US$ Bn), 2017‒2031
Figure 20: North America Mobile Cobots Market Size & Forecast, Volume (Thousand Units), 2017‒2031
Figure 21: North America Mobile Cobots Market Size & Forecast, Value (US$ Bn), 2017‒2031
Figure 22: North America Mobile Cobots Market Projections by Component, Value (US$ Bn), 2017‒2031
Figure 23: North America Mobile Cobots Market Share Analysis, by Component, 2021 and 2031
Figure 24: North America Mobile Cobots Market, Incremental Opportunity, by Component, 2021‒2031
Figure 25: North America Mobile Cobots Market Projections by Capacity, Value (US$ Bn), 2017‒2031
Figure 26: North America Mobile Cobots Market Share Analysis, by Capacity, 2021 and 2031
Figure 27: North America Mobile Cobots Market, Incremental Opportunity, by Capacity, 2021‒2031
Figure 28: North America Mobile Cobots Market Projections by Application, Value (US$ Bn), 2017‒2031
Figure 29: North America Mobile Cobots Market Share Analysis, by Application, 2021 and 2031
Figure 30: North America Mobile Cobots Market, Incremental Opportunity, by Application, 2021‒2031
Figure 31: North America Mobile Cobots Market Projections by End-use Industry, Value (US$ Bn), 2017‒2031
Figure 32: North America Mobile Cobots Market Share Analysis, by End-use Industry, 2021 and 2031
Figure 33: North America Mobile Cobots Market, Incremental Opportunity, by End-use Industry, 2021‒2031
Figure 34: North America Mobile Cobots Market Projections by Country & Sub-region, Value (US$ Bn), 2017‒2031
Figure 35: North America Mobile Cobots Market Share Analysis, by Country & Sub-region, 2021 and 2031
Figure 36: North America Mobile Cobots Market, Incremental Opportunity, by Country & Sub-region, 2021‒2031
Figure 37: Europe Mobile Cobots Market Size & Forecast, Y-O-Y, Value (US$ Bn), 2017‒2031
Figure 38: Europe Mobile Cobots Market Size & Forecast, Volume (Thousand Units), 2017‒2031
Figure 39: Europe Mobile Cobots Market Size & Forecast, Value (US$ Bn), 2017‒2031
Figure 40: Europe Mobile Cobots Market Projections by Component, Value (US$ Bn), 2017‒2031
Figure 41: Europe Mobile Cobots Market Share Analysis, by Component, 2021 and 2031
Figure 42: Europe Mobile Cobots Market, Incremental Opportunity, by Component, 2021‒2031
Figure 43: Europe Mobile Cobots Market Projections by Capacity, Value (US$ Bn), 2017‒2031
Figure 44: Europe Mobile Cobots Market Share Analysis, by Capacity, 2021 and 2031
Figure 45: Europe Mobile Cobots Market, Incremental Opportunity, by Capacity, 2021‒2031
Figure 46: Europe Mobile Cobots Market Projections by Application, Value (US$ Bn), 2017‒2031
Figure 47: Europe Mobile Cobots Market Share Analysis, by Application, 2021 and 2031
Figure 48: Europe Mobile Cobots Market, Incremental Opportunity, by Application, 2021‒2031
Figure 49: Europe Mobile Cobots Market Projections by End-use Industry, Value (US$ Bn), 2017‒2031
Figure 50: Europe Mobile Cobots Market Share Analysis, by End-use Industry, 2021 and 2031
Figure 51: Europe Mobile Cobots Market, Incremental Opportunity, by End-use Industry, 2021‒2031
Figure 52: Europe Mobile Cobots Market Projections by Country & Sub-region, Value (US$ Bn), 2017‒2031
Figure 53: Europe Mobile Cobots Market Share Analysis, by Country & Sub-region, 2021 and 2031
Figure 54: Europe Mobile Cobots Market, Incremental Opportunity, by Country & Sub-region, 2021‒2031
Figure 55: Asia Pacific Mobile Cobots Market Size & Forecast, Y-O-Y, Value (US$ Bn), 2017‒2031
Figure 56: Asia Pacific Mobile Cobots Market Size & Forecast, Volume (Thousand Units), 2017‒2031
Figure 57: Asia Pacific Mobile Cobots Market Size & Forecast, Value (US$ Bn), 2017‒2031
Figure 58: Asia Pacific Mobile Cobots Market Projections by Component, Value (US$ Bn), 2017‒2031
Figure 59: Asia Pacific Mobile Cobots Market Share Analysis, by Component, 2021 and 2031
Figure 60: Asia Pacific Mobile Cobots Market, Incremental Opportunity, by Component, 2021‒2031
Figure 61: Asia Pacific Mobile Cobots Market Projections by Capacity, Value (US$ Bn), 2017‒2031
Figure 62: Asia Pacific Mobile Cobots Market Share Analysis, by Capacity, 2021 and 2031
Figure 63: Asia Pacific Mobile Cobots Market, Incremental Opportunity, by Capacity, 2021‒2031
Figure 64: Asia Pacific Mobile Cobots Market Projections by Application, Value (US$ Bn), 2017‒2031
Figure 65: Asia Pacific Mobile Cobots Market Share Analysis, by Application, 2021 and 2031
Figure 66: Asia Pacific Mobile Cobots Market, Incremental Opportunity, by Application, 2021‒2031
Figure 67: Asia Pacific Mobile Cobots Market Projections by End-use Industry, Value (US$ Bn), 2017‒2031
Figure 68: Asia Pacific Mobile Cobots Market Share Analysis, by End-use Industry, 2021 and 2031
Figure 69: Asia Pacific Mobile Cobots Market, Incremental Opportunity, by End-use Industry, 2021‒2031
Figure 70: Asia Pacific Mobile Cobots Market Projections by Country & Sub-region, Value (US$ Bn), 2017‒2031
Figure 71: Asia Pacific Mobile Cobots Market Share Analysis, by Country & Sub-region, 2021 and 2031
Figure 72: Asia Pacific Mobile Cobots Market, Incremental Opportunity, by Country & Sub-region, 2021‒2031
Figure 73: Middle East & Africa Mobile Cobots Market Size & Forecast, Y-O-Y, Value (US$ Bn), 2017‒2031
Figure 74: Middle East & Africa Mobile Cobots Market Size & Forecast, Volume (Thousand Units), 2017‒2031
Figure 75: Middle East & Africa Mobile Cobots Market Size & Forecast, Value (US$ Bn), 2017‒2031
Figure 76: Middle East & Africa Mobile Cobots Market Projections by Component, Value (US$ Bn), 2017‒2031
Figure 77: Middle East & Africa Mobile Cobots Market Share Analysis, by Component, 2021 and 2031
Figure 78: Middle East & Africa Mobile Cobots Market, Incremental Opportunity, by Component, 2021‒2031
Figure 79: Middle East & Africa Mobile Cobots Market Projections by Capacity, Value (US$ Bn), 2017‒2031
Figure 80: Middle East & Africa Mobile Cobots Market Share Analysis, by Capacity, 2021 and 2031
Figure 81: Middle East & Africa Mobile Cobots Market, Incremental Opportunity, by Capacity, 2021‒2031
Figure 82: Middle East & Africa Mobile Cobots Market Projections by Application, Value (US$ Bn), 2017‒2031
Figure 83: Middle East & Africa Mobile Cobots Market Share Analysis, by Application, 2021 and 2031
Figure 84: Middle East & Africa Mobile Cobots Market, Incremental Opportunity, by Application, 2021‒2031
Figure 85: Middle East & Africa Mobile Cobots Market Projections by End-use Industry, Value (US$ Bn), 2017‒2031
Figure 86: Middle East & Africa Mobile Cobots Market Share Analysis, by End-use Industry, 2021 and 2031
Figure 87: Middle East & Africa Mobile Cobots Market, Incremental Opportunity, by End-use Industry, 2021‒2031
Figure 88: Middle East & Africa Mobile Cobots Market Projections by Country & Sub-region, Value (US$ Bn), 2017‒2031
Figure 89: Middle East & Africa Mobile Cobots Market Share Analysis, by Country & Sub-region, 2021 and 2031
Figure 90: Middle East & Africa Mobile Cobots Market, Incremental Opportunity, by Country & Sub-region, 2021‒2031
Figure 91: South America Mobile Cobots Market Size & Forecast, Y-O-Y, Value (US$ Bn), 2017‒2031
Figure 92: South America Mobile Cobots Market Size & Forecast, Volume (Thousand Units), 2017‒2031
Figure 93: South America Mobile Cobots Market Size & Forecast, Value (US$ Bn), 2017‒2031
Figure 94: South America Mobile Cobots Market Projections by Component, Value (US$ Bn), 2017‒2031
Figure 95: South America Mobile Cobots Market Share Analysis, by Component, 2021 and 2031
Figure 96: South America Mobile Cobots Market, Incremental Opportunity, by Component, 2021‒2031
Figure 97: South America Mobile Cobots Market Projections by Capacity, Value (US$ Bn), 2017‒2031
Figure 98: South America Mobile Cobots Market Share Analysis, by Capacity, 2021 and 2031
Figure 99: South America Mobile Cobots Market, Incremental Opportunity, by Capacity, 2021‒2031
Figure 100: South America Mobile Cobots Market Projections by Application, Value (US$ Bn), 2017‒2031
Figure 101: South America Mobile Cobots Market Share Analysis, by Application, 2021 and 2031
Figure 102: South America Mobile Cobots Market, Incremental Opportunity, by Application, 2021‒2031
Figure 103: South America Mobile Cobots Market Projections by End-use Industry, Value (US$ Bn), 2017‒2031
Figure 104: South America Mobile Cobots Market Share Analysis, by End-use Industry, 2021 and 2031
Figure 105: South America Mobile Cobots Market, Incremental Opportunity, by End-use Industry, 2021‒2031
Figure 106: South America Mobile Cobots Market Projections by Country & Sub-region, Value (US$ Bn), 2017‒2031
Figure 107: South America Mobile Cobots Market Share Analysis, by Country & Sub-region, 2021 and 2031
Figure 108: South America Mobile Cobots Market, Incremental Opportunity, by Country & Sub-region, 2021‒2031
Figure 109: Company Share Analysis (2020)
Copyright © Transparency Market Research, Inc. All Rights reserved
Trust Online

Mobile Cobots Market