
Reports
Reports
Analysts’ Viewpoint on Market Scenario
Companies in the market are focusing on high-growth industries such as BFSI, transportation, academic institutes, and enterprises in order to grow post the peak of the COVID-19 pandemic. Rise in demand for proper authentication methods and increase in number of cyber-attacks worldwide are fueling market statistics.
The Asia Pacific market is expected to grow significantly in the next few years, owing to the increase in number of vendors and growth in adoption of advanced biometrics systems in various industries, such as BFSI and retail, in the region. Top biometrics companies and manufacturers in the world are focusing on developing innovative biometric devices. End-use industries are opting for biometric fingerprint scanners rather than complex password authentication. The e-commerce sector is witnessing a rapid increase in demand for mobile biometric devices owing to an increase in number of small and medium-sized retail businesses across the world.
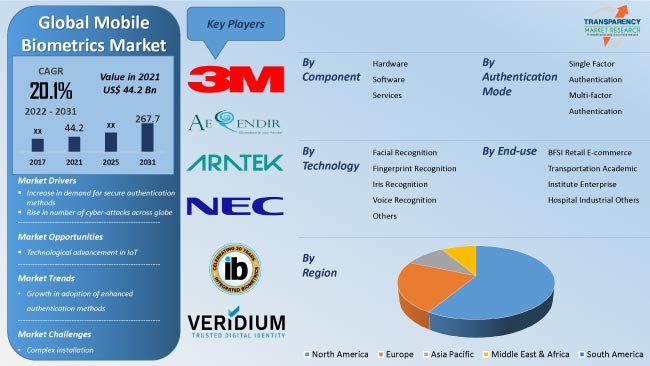
Mobile biometric authentication is used to detect and authenticate the identity of a user trying to access a mobile app. It can be accomplished in a number of ways, including fingerprint readers, facial recognition, and voice recognition. Mobile biometric authentication is most commonly used in banking and e-commerce sectors. In these sectors, customers can use facial recognition technology to authenticate transactions through their mobile applications. The global mobile biometrics market size is likely to increase during the forecast period, owing to the rapid growth in applications of biometric devices along with an increase in number of cyber-attacks across the globe.
Biometric security is gaining traction among individuals, organizations, and businesses to protect cyberspace from hackers and other malicious individuals. Surge in number of cyber-attacks around the world is one of the major factors driving mobile biometrics business growth.
According to PurpleSec, cybercrimes have increased by 600% due to the COVID-19 pandemic. Additionally, the annual number of enterprise security breaches increased by 27.4%. Businesses are investing heavily in two-factor authentication (2FA) or multi-factor authentication (MFA) to combat these cyber threats. According to Getapp data, in 2022, the majority (92 percent) of businesses in the U.S. used 2FA for at least some of their business applications. Therefore, rise in number of cyber-attacks is anticipated to fuel mobile biometrics market development in the next few years.
Rise in demand for appropriate authentication methods is driving the mobile biometrics industry growth. Authentication technology is constantly evolving. Businesses are shifting away from traditional password-based authentication. Popularity of advanced authentication technologies, such as facial recognition and fingerprint recognition, is increasingly due to their enhanced security. Attackers are not able to exploit passwords due to improved authentication methods and technologies, which helps prevent data breach.
Demand for various types of user authentication methods is rising for both online and offline systems. These authenticating methods are being employed in various organizations to secure their database and other resources.
According to the global mobile biometrics market report, the market has been segregated into hardware, software, and services, based on component. The software segment is likely to dominate during the forecast period. Rise in digitalization in developing economies is expected to drive the software segment during the forecast period.
Furthermore, growth of digital media and online content delivery has meant that traditional methods of authentication, such as signatures and text-based credentials, have become more difficult for users. Traditional authentication methods are highly vulnerable to cyber-attacks. Identity verification and management software can be used in healthcare, human resources, defense, and other industries. Biometric software enables users to own and control their identity while ensuring security and convenience. All these factors are contributing toward mobile biometrics market expansion.
Furthermore, rise in adoption of IoT in authentication systems is anticipated to create lucrative mobile biometrics business opportunities in the near future.
In terms of technology, the mobile biometrics market segmentation comprises facial recognition, fingerprint recognition, iris recognition, voice recognition, and others (ear acoustic authentication, vein recognition, etc.). The fingerprint recognition segment held the highest mobile biometrics market share, i.e. nearly 35% of the global market, in 2021.
The identity of an individual can be recognized by automated fingerprint recognition technology, by comparing two fingerprints. It is one of the most common biometric methods that can be used for mobile and computerized system authentication. The popularity of fingerprint recognition technology is increasing rapidly due to the ease of acquisition and benefits associated with it as compared to other biometric solutions. This is likely to propel the mobile biometrics market size during the forecast period.
According to the mobile biometrics market research report, Asia Pacific is expected to be a rapidly expanding market for mobile biometrics during the forecast period. This can be ascribed to the lucrative presence of leading players in major economies such as Japan, South Korea, and China. Furthermore, increase in demand for smartphones, computers, and tablets is creating significant opportunities for manufacturers of mobile biometric solutions in the region. This is projected to augment market progress during the forecast period.
North America dominated the global market and accounted for 34% share in 2021. The North America mobile biometrics market share is expected to increase in the next few years, owing to the high concentration of mobile biometric solution vendors in the region. Furthermore, rise in demand for mobile biometrics in diverse industries, such as BFSI, retail, healthcare, and e-commerce, is projected to fuel market expansion in the region during the forecast period.
The global market is consolidated, with a few large-scale players controlling majority of the share. Expansion of product portfolios, partnerships, and acquisitions are some of the major strategies adopted by key players in the market.
3M, Aerendir, Aratek, Aware, Inc., BioEnable, Integrated Biometrics, iProov, NEC Corporation, Phonexia, secunet Security Networks AG, Stytch, Synaptics Incorporated, and Veridium are some of the best biometrics companies operating in the global market.
The global mobile biometrics market forecast report profiles these key players based on product portfolio, recent developments, financial overview, business segments, business strategies, and company overview.
|
Attribute |
Detail |
|
Market Size Value in 2021 |
US$ 44.2 Bn |
|
Market Forecast Value in 2031 |
US$ 267.7 Bn |
|
Growth Rate (CAGR) |
20.1% |
|
Forecast Period |
2022–2031 |
|
Historical Data Available for |
2017–2020 |
|
Quantitative Units |
US$ Bn for Value & Million Units for Volume |
|
Market Analysis |
It includes cross segment analysis at global as well as regional level. Furthermore, qualitative analysis includes drivers, restraints, opportunities, key trends, Porter’s Five Forces analysis, value chain analysis, and key trend analysis. |
|
Competition Landscape |
|
|
Format |
Electronic (PDF) + Excel |
|
Market Segmentation |
|
|
Regions Covered |
|
|
Countries Covered |
|
|
Companies Profiled |
|
|
Customization Scope |
Available upon request |
|
Pricing |
Available upon request |
It stood at US$ 44.2 Bn in 2021
It is expected to grow at a CAGR of 20.1% by 2031
It is likely to reach US$ 267.7 Bn in 2031
3M, Aerendir, Aratek, Aware, Inc., BioEnable, Integrated Biometrics, iProov, NEC Corporation, Phonexia, secunet Security Networks AG, Stytch, Synaptics Incorporated, and Veridium
The U.S. accounted for approximately 25.0% share in 2021
The fingerprint recognition segment held around 35.0% share in 2021
Increase in demand for secure authentication methods and rise in number of cyber-attacks across globe
North America is a more lucrative region for vendors
1. Preface
1.1. Market Introduction
1.2. Market and Segments Definition
1.3. Market Taxonomy
1.4. Research Methodology
1.5. Assumption and Acronyms
2. Executive Summary
2.1. Mobile Biometrics Market Overview
2.2. Regional Outline
2.3. Industry Outline
2.4. Market Dynamics Snapshot
2.5. Competition Blueprint
3. Market Dynamics
3.1. Macro-economic Factors
3.2. Drivers
3.3. Restraints
3.4. Opportunities
3.5. Key Trends
3.6. Regulatory Scenario
4. Associated Industry and Key Indicator Assessment
4.1. Parent Industry Overview – Global Authentication Industry Overview
4.2. Supply Chain Analysis
4.3. Pricing Analysis
4.4. Technology Roadmap Analysis
4.5. Industry SWOT Analysis
4.6. Porter Five Forces Analysis
4.7. Covid-19 Impact and Recovery Analysis
5. Mobile Biometrics Market Analysis, by Component
5.1. Mobile Biometrics Market Value (US$ Bn) and Volume (Million Units) Analysis & Forecast, by Component, 2017–2031
5.1.1. Hardware
5.1.2. Software
5.1.3. Services
5.2. Market Attractiveness Analysis, By Component
6. Mobile Biometrics Market Analysis, by Authentication Mode
6.1. Mobile Biometrics Market Value (US$ Bn) Analysis & Forecast, by Authentication Mode, 2017–2031
6.1.1. Single Factor Authentication
6.1.2. Multi-factor Authentication
6.2. Market Attractiveness Analysis, By Authentication Mode
7. Mobile Biometrics Market Analysis, by Technology
7.1. Mobile Biometrics Market Value (US$ Bn) Analysis & Forecast, by Technology, 2017–2031
7.1.1. Facial Recognition
7.1.2. Fingerprint Recognition
7.1.3. Iris Recognition
7.1.4. Voice Recognition
7.1.5. Others
7.2. Market Attractiveness Analysis, By Technology
8. Mobile Biometrics Market Analysis, by End-use
8.1. Mobile Biometrics Market Value (US$ Bn) Analysis & Forecast, by End-use, 2017–2031
8.1.1. BFSI
8.1.2. Retail
8.1.3. E-commerce
8.1.4. Transportation
8.1.5. Academic Institute
8.1.6. Enterprise
8.1.7. Hospital
8.1.8. Industrial
8.1.9. Others
8.2. Market Attractiveness Analysis, By End-use
9. Mobile Biometrics Market Analysis and Forecast, by Region
9.1. Mobile Biometrics Market Value (US$ Bn) and Volume (Million Units) Analysis & Forecast, by Region, 2017–2031
9.1.1. North America
9.1.2. Europe
9.1.3. Asia Pacific
9.1.4. Middle East & Africa
9.1.5. South America
9.2. Market Attractiveness Analysis, By Region
10. North America Mobile Biometrics Market Analysis and Forecast
10.1. Market Snapshot
10.2. Drivers and Restraints: Impact Analysis
10.3. Mobile Biometrics Market Value (US$ Bn) and Volume (Million Units) Analysis & Forecast, by Component, 2017–2031
10.3.1. Hardware
10.3.2. Software
10.3.3. Services
10.4. Mobile Biometrics Market Value (US$ Bn) Analysis & Forecast, by Authentication Mode, 2017–2031
10.4.1. Single Factor Authentication
10.4.2. Multi-factor Authentication
10.5. Mobile Biometrics Market Value (US$ Bn) Analysis & Forecast, by Technology, 2017–2031
10.5.1. Facial Recognition
10.5.2. Fingerprint Recognition
10.5.3. Iris Recognition
10.5.4. Voice Recognition
10.5.5. Others
10.6. Mobile Biometrics Market Value (US$ Bn) Analysis & Forecast, by End-use, 2017–2031
10.6.1. BFSI
10.6.2. Retail
10.6.3. E-commerce
10.6.4. Transportation
10.6.5. Academic Institute
10.6.6. Enterprise
10.6.7. Hospital
10.6.8. Industrial
10.6.9. Others
10.7. Mobile Biometrics Value (US$ Bn) and Volume (Million Units) Analysis & Forecast, by Country and Sub-region, 2017–2031
10.7.1. The U.S.
10.7.2. Canada
10.7.3. Rest of North America
10.8. Market Attractiveness Analysis
10.8.1. By Component
10.8.2. By Authentication Mode
10.8.3. By Technology
10.8.4. By End-use
10.8.5. By Country/Sub-region
11. Europe Mobile Biometrics Market Analysis and Forecast
11.1. Market Snapshot
11.2. Drivers and Restraints: Impact Analysis
11.3. Mobile Biometrics Market Value (US$ Bn) and Volume (Million Units) Analysis & Forecast, by Component, 2017–2031
11.3.1. Hardware
11.3.2. Software
11.3.3. Services
11.4. Mobile Biometrics Market Value (US$ Bn) Analysis & Forecast, by Authentication Mode, 2017–2031
11.4.1. Single Factor Authentication
11.4.2. Multi-factor Authentication
11.5. Mobile Biometrics Market Value (US$ Bn) Analysis & Forecast, by Technology, 2017–2031
11.5.1. Facial Recognition
11.5.2. Fingerprint Recognition
11.5.3. Iris Recognition
11.5.4. Voice Recognition
11.5.5. Others
11.6. Mobile Biometrics Market Value (US$ Bn) Analysis & Forecast, by End-use, 2017–2031
11.6.1. BFSI
11.6.2. Retail
11.6.3. E-commerce
11.6.4. Transportation
11.6.5. Academic Institute
11.6.6. Enterprise
11.6.7. Hospital
11.6.8. Industrial
11.6.9. Others
11.7. Mobile Biometrics Value (US$ Bn) and Volume (Million Units) Analysis & Forecast, by Country and Sub-region, 2017–2031
11.7.1. U.K.
11.7.2. Germany
11.7.3. France
11.7.4. Rest of Europe
11.8. Market Attractiveness Analysis
11.8.1. By Component
11.8.2. By Authentication Mode
11.8.3. By Technology
11.8.4. By End-use
11.8.5. By Country/Sub-region
12. Asia Pacific Mobile Biometrics Market Analysis and Forecast
12.1. Market Snapshot
12.2. Drivers and Restraints: Impact Analysis
12.3. Mobile Biometrics Market Value (US$ Bn) and Volume (Million Units) Analysis & Forecast, by Component, 2017–2031
12.3.1. Hardware
12.3.2. Software
12.3.3. Services
12.4. Mobile Biometrics Market Value (US$ Bn) Analysis & Forecast, by Authentication Mode, 2017–2031
12.4.1. Single Factor Authentication
12.4.2. Multi-factor Authentication
12.5. Mobile Biometrics Market Value (US$ Bn) Analysis & Forecast, by Technology, 2017–2031
12.5.1. Facial Recognition
12.5.2. Fingerprint Recognition
12.5.3. Iris Recognition
12.5.4. Voice Recognition
12.5.5. Others
12.6. Mobile Biometrics Market Value (US$ Bn) Analysis & Forecast, by End-use, 2017–2031
12.6.1. BFSI
12.6.2. Retail
12.6.3. E-commerce
12.6.4. Transportation
12.6.5. Academic Institute
12.6.6. Enterprise
12.6.7. Hospital
12.6.8. Industrial
12.6.9. Others
12.7. Mobile Biometrics Value (US$ Bn) and Volume (Million Units) Analysis & Forecast, by Country and Sub-region, 2017–2031
12.7.1. China
12.7.2. India
12.7.3. Japan
12.7.4. South Korea
12.7.5. ASEAN
12.7.6. Rest of Asia Pacific
12.8. Market Attractiveness Analysis
12.8.1. By Component
12.8.2. By Authentication Mode
12.8.3. By Technology
12.8.4. By End-use
12.8.5. By Country/Sub-region
13. Middle East & Africa Mobile Biometrics Market Analysis and Forecast
13.1. Market Snapshot
13.2. Drivers and Restraints: Impact Analysis
13.3. Mobile Biometrics Market Value (US$ Bn) and Volume (Million Units) Analysis & Forecast, by Component, 2017–2031
13.3.1. Hardware
13.3.2. Software
13.3.3. Services
13.4. Mobile Biometrics Market Value (US$ Bn) Analysis & Forecast, by Authentication Mode, 2017–2031
13.4.1. Single Factor Authentication
13.4.2. Multi-factor Authentication
13.5. Mobile Biometrics Market Value (US$ Bn) Analysis & Forecast, by Technology, 2017–2031
13.5.1. Facial Recognition
13.5.2. Fingerprint Recognition
13.5.3. Iris Recognition
13.5.4. Voice Recognition
13.5.5. Others
13.6. Mobile Biometrics Market Value (US$ Bn) Analysis & Forecast, by End-use, 2017–2031
13.6.1. BFSI
13.6.2. Retail
13.6.3. E-commerce
13.6.4. Transportation
13.6.5. Academic Institute
13.6.6. Enterprise
13.6.7. Hospital
13.6.8. Industrial
13.6.9. Others
13.7. Mobile Biometrics Value (US$ Bn) and Volume (Million Units) Analysis & Forecast, by Country and Sub-region, 2017–2031
13.7.1. GCC
13.7.2. South Africa
13.7.3. Rest of the Middle East & Africa
13.8. Market Attractiveness Analysis
13.8.1. By Component
13.8.2. By Authentication Mode
13.8.3. By Technology
13.8.4. By End-use
13.8.5. By Country/Sub-region
14. South America Mobile Biometrics Market Analysis and Forecast
14.1. Market Snapshot
14.2. Drivers and Restraints: Impact Analysis
14.3. Mobile Biometrics Market Value (US$ Bn) and Volume (Million Units) Analysis & Forecast, by Component, 2017–2031
14.3.1. Hardware
14.3.2. Software
14.3.3. Services
14.4. Mobile Biometrics Market Value (US$ Bn) Analysis & Forecast, by Authentication Mode, 2017–2031
14.4.1. Single Factor Authentication
14.4.2. Multi-factor Authentication
14.5. Mobile Biometrics Market Value (US$ Bn) Analysis & Forecast, by Technology, 2017–2031
14.5.1. Facial Recognition
14.5.2. Fingerprint Recognition
14.5.3. Iris Recognition
14.5.4. Voice Recognition
14.5.5. Others
14.6. Mobile Biometrics Market Value (US$ Bn) Analysis & Forecast, by End-use, 2017–2031
14.6.1. BFSI
14.6.2. Retail
14.6.3. E-commerce
14.6.4. Transportation
14.6.5. Academic Institute
14.6.6. Enterprise
14.6.7. Hospital
14.6.8. Industrial
14.6.9. Others
14.7. Mobile Biometrics Value (US$ Bn) and Volume (Million Units) Analysis & Forecast, by Country and Sub-region, 2017–2031
14.7.1. Brazil
14.7.2. Rest of South America
14.8. Market Attractiveness Analysis
14.8.1. By Component
14.8.2. By Authentication Mode
14.8.3. By Technology
14.8.4. By End-use
14.8.5. By Country/Sub-region
15. Competition Assessment
15.1. Global Mobile Biometrics Market Competition Matrix - a Dashboard View
15.1.1. Global Mobile Biometrics Market Company Share Analysis, by Value (2021)
15.1.2. Technological Differentiator
16. Company Profiles (Global Manufacturers/Suppliers)
16.1. 3M
16.1.1. Overview
16.1.2. Product Portfolio
16.1.3. Sales Footprint
16.1.4. Key Subsidiaries or Distributors
16.1.5. Strategy and Recent Developments
16.1.6. Key Financials
16.2. Aerendir
16.2.1. Overview
16.2.2. Product Portfolio
16.2.3. Sales Footprint
16.2.4. Key Subsidiaries or Distributors
16.2.5. Strategy and Recent Developments
16.2.6. Key Financials
16.3. Aratek
16.3.1. Overview
16.3.2. Product Portfolio
16.3.3. Sales Footprint
16.3.4. Key Subsidiaries or Distributors
16.3.5. Strategy and Recent Developments
16.3.6. Key Financials
16.4. Aware, Inc.
16.4.1. Overview
16.4.2. Product Portfolio
16.4.3. Sales Footprint
16.4.4. Key Subsidiaries or Distributors
16.4.5. Strategy and Recent Developments
16.4.6. Key Financials
16.5. BioEnable
16.5.1. Overview
16.5.2. Product Portfolio
16.5.3. Sales Footprint
16.5.4. Key Subsidiaries or Distributors
16.5.5. Strategy and Recent Developments
16.5.6. Key Financials
16.6. Integrated Biometrics
16.6.1. Overview
16.6.2. Product Portfolio
16.6.3. Sales Footprint
16.6.4. Key Subsidiaries or Distributors
16.6.5. Strategy and Recent Developments
16.6.6. Key Financials
16.7. iProov
16.7.1. Overview
16.7.2. Product Portfolio
16.7.3. Sales Footprint
16.7.4. Key Subsidiaries or Distributors
16.7.5. Strategy and Recent Developments
16.7.6. Key Financials
16.8. NEC Corporation
16.8.1. Overview
16.8.2. Product Portfolio
16.8.3. Sales Footprint
16.8.4. Key Subsidiaries or Distributors
16.8.5. Strategy and Recent Developments
16.8.6. Key Financials
16.9. Phonexia
16.9.1. Overview
16.9.2. Product Portfolio
16.9.3. Sales Footprint
16.9.4. Key Subsidiaries or Distributors
16.9.5. Strategy and Recent Developments
16.9.6. Key Financials
16.10. secunet Security Networks AG
16.10.1. Overview
16.10.2. Product Portfolio
16.10.3. Sales Footprint
16.10.4. Key Subsidiaries or Distributors
16.10.5. Strategy and Recent Developments
16.10.6. Key Financials
16.11. Stytch
16.11.1. Overview
16.11.2. Product Portfolio
16.11.3. Sales Footprint
16.11.4. Key Subsidiaries or Distributors
16.11.5. Strategy and Recent Developments
16.11.6. Key Financials
16.12. Synaptics Incorporated
16.12.1. Overview
16.12.2. Product Portfolio
16.12.3. Sales Footprint
16.12.4. Key Subsidiaries or Distributors
16.12.5. Strategy and Recent Developments
16.12.6. Key Financials
16.13. Veridium
16.13.1. Overview
16.13.2. Product Portfolio
16.13.3. Sales Footprint
16.13.4. Key Subsidiaries or Distributors
16.13.5. Strategy and Recent Developments
16.13.6. Key Financials
17. Recommendation
17.1. Opportunity Assessment
17.1.1. By Component
17.1.2. By Authentication Mode
17.1.3. By Technology
17.1.4. By End-use
17.1.5. By Region
List of Tables
Table 01: Global Mobile Biometrics Market Size & Forecast, by Component, Value (US$ Bn), 2017-2031
Table 02: Global Mobile Biometrics Market Size & Forecast, by Component, Volume (Million Units), 2017-2031
Table 03: Global Mobile Biometrics Market Size & Forecast, by Authentication Mode, Value (US$ Bn), 2017-2031
Table 04: Global Mobile Biometrics Market Size & Forecast, by Technology, Value (US$ Bn), 2017-2031
Table 05: Global Mobile Biometrics Market Size & Forecast, by End-use, Value (US$ Bn), 2017-2031
Table 06: Global Mobile Biometrics Market Size & Forecast, by Region, Value (US$ Bn), 2017-2031
Table 07: Global Mobile Biometrics Market Size & Forecast, by Region, Volume (Million Units), 2017-2031
Table 08: North America Mobile Biometrics Market Size & Forecast, by Component, Value (US$ Bn), 2017-2031
Table 09: North America Mobile Biometrics Market Size & Forecast, by Component, Volume (Million Units), 2017-2031
Table 10: North America Mobile Biometrics Market Size & Forecast, by Authentication Mode, Value (US$ Bn), 2017-2031
Table 11: North America Mobile Biometrics Market Size & Forecast, by Technology, Value (US$ Bn), 2017-2031
Table 12: North America Mobile Biometrics Market Size & Forecast, by End-use, Value (US$ Bn), 2017-2031
Table 13: North America Mobile Biometrics Market Size & Forecast, by Country, Value (US$ Bn), 2017-2031
Table 14: North America Mobile Biometrics Market Size & Forecast, by Country, Volume (Million Units), 2017-2031
Table 15: Europe Mobile Biometrics Market Size & Forecast, by Component, Value (US$ Bn), 2017-2031
Table 16: Europe Mobile Biometrics Market Size & Forecast, by Component, Volume (Million Units), 2017-2031
Table 17: Europe Mobile Biometrics Market Size & Forecast, by Authentication Mode, Value (US$ Bn), 2017-2031
Table 18: Europe Mobile Biometrics Market Size & Forecast, by Technology, Value (US$ Bn), 2017-2031
Table 19: Europe Mobile Biometrics Market Size & Forecast, by End-use, Value (US$ Bn), 2017-2031
Table 20: Europe Mobile Biometrics Market Size & Forecast, by Country, Value (US$ Bn), 2017-2031
Table 21: Europe Mobile Biometrics Market Size & Forecast, by Country, Volume (Million Units), 2017-2031
Table 22: Asia Pacific Mobile Biometrics Market Size & Forecast, by Component, Value (US$ Bn), 2017-2031
Table 23: Asia Pacific Mobile Biometrics Market Size & Forecast, by Component, Volume (Million Units), 2017-2031
Table 24: Asia Pacific Mobile Biometrics Market Size & Forecast, by Authentication Mode, Value (US$ Bn), 2017-2031
Table 25: Asia Pacific Mobile Biometrics Market Size & Forecast, by Technology, Value (US$ Bn), 2017-2031
Table 26: Asia Pacific Mobile Biometrics Market Size & Forecast, by End-use, Value (US$ Bn), 2017-2031
Table 27: Asia Pacific Mobile Biometrics Market Size & Forecast, by Country, Value (US$ Bn), 2017-2031
Table 28: Asia Pacific Mobile Biometrics Market Size & Forecast, by Country, Volume (Million Units), 2017-2031
Table 29: Middle East & Africa Mobile Biometrics Market Size & Forecast, by Component, Value (US$ Bn), 2017-2031
Table 30: Middle East & Africa Mobile Biometrics Market Size & Forecast, by Component, Volume (Million Units), 2017-2031
Table 31: Middle East & Africa Mobile Biometrics Market Size & Forecast, by Authentication Mode, Value (US$ Bn), 2017-2031
Table 32: Middle East & Africa Mobile Biometrics Market Size & Forecast, by Technology, Value (US$ Bn), 2017-2031
Table 33: Middle East & Africa Mobile Biometrics Market Size & Forecast, by End-use, Value (US$ Bn), 2017-2031
Table 34: Middle East & Africa Mobile Biometrics Market Size & Forecast, by Country, Value (US$ Bn), 2017-2031
Table 35: Middle East & Africa Mobile Biometrics Market Size & Forecast, by Country, Volume (Million Units), 2017-2031
Table 36: South America Mobile Biometrics Market Size & Forecast, by Component, Value (US$ Bn), 2017-2031
Table 37: South America Mobile Biometrics Market Size & Forecast, by Component, Volume (Million Units), 2017-2031
Table 38: South America Mobile Biometrics Market Size & Forecast, by Authentication Mode, Value (US$ Bn), 2017-2031
Table 39: South America Mobile Biometrics Market Size & Forecast, by Technology, Value (US$ Bn), 2017-2031
Table 40: South America Mobile Biometrics Market Size & Forecast, by End-use, Value (US$ Bn), 2017-2031
Table 41: South America Mobile Biometrics Market Size & Forecast, by Country, Value (US$ Bn), 2017-2031
Table 42: South America Mobile Biometrics Market Size & Forecast, by Country, Volume (Million Units), 2017-2031
List of Figures
Figure 01: Global Mobile Biometrics Market Share Analysis, by Region
Figure 02: Global Mobile Biometrics Price Trend Analysis (Average Price, US$)
Figure 03: Global Mobile Biometrics Market, Value (US$ Bn), 2017-2031
Figure 04: Global Mobile Biometrics Market, Volume (Million Units), 2017-2031
Figure 05: Global Mobile Biometrics Market Size & Forecast, by Component, Revenue (US$ Bn), 2017-2031
Figure 06: Global Mobile Biometrics Market Attractiveness, by Component, Value (US$ Bn), 2022-2031
Figure 07: Global Mobile Biometrics Market Size & Forecast, by Component, Value (US$ Bn), 2022-2031
Figure 08: Global Mobile Biometrics Market Size & Forecast, by Authentication Mode, Revenue (US$ Bn), 2017-2031
Figure 09: Global Mobile Biometrics Market Attractiveness, by Authentication Mode, Value (US$ Bn), 2022-2031
Figure 10: Global Mobile Biometrics Market Size & Forecast, by Authentication Mode, Value (US$ Bn), 2022-2031
Figure 11: Global Mobile Biometrics Market Size & Forecast, by Technology, Revenue (US$ Bn), 2017-2031
Figure 12: Global Mobile Biometrics Market Attractiveness, by Technology, Value (US$ Bn), 2022-2031
Figure 13: Global Mobile Biometrics Market Size & Forecast, by Technology, Value (US$ Bn), 2022-2031
Figure 14: Global Mobile Biometrics Market Size & Forecast, by End-use, Revenue (US$ Bn), 2017-2031
Figure 15: Global Mobile Biometrics Market Attractiveness, by End-use, Value (US$ Bn), 2022-2031
Figure 16: Global Mobile Biometrics Market Size & Forecast, by End-use, Value (US$ Bn), 2022-2031
Figure 17: Global Mobile Biometrics Market Size & Forecast, by Region, Revenue (US$ Bn), 2017-2031
Figure 18: Global Mobile Biometrics Market Attractiveness, by Region, Value (US$ Bn), 2022-2031
Figure 19: Global Mobile Biometrics Market Size & Forecast, by Region, Value (US$ Bn), 2022-2031
Figure 20: North America Mobile Biometrics Market, Value (US$ Bn), 2017-2031
Figure 21: North America Mobile Biometrics Market, Volume (Million Units), 2017-2031
Figure 22: North America Mobile Biometrics Market Size & Forecast, by Component, Revenue (US$ Bn), 2017-2031
Figure 23: North America Mobile Biometrics Market Attractiveness, by Component, Value (US$ Bn), 2022-2031
Figure 24: North America Mobile Biometrics Market Size & Forecast, by Component, Value (US$ Bn), 2022-2031
Figure 25: North America Mobile Biometrics Market Size & Forecast, by Authentication Mode, Revenue (US$ Bn), 2017-2031
Figure 26: North America Mobile Biometrics Market Attractiveness, by Authentication Mode, Value (US$ Bn), 2022-2031
Figure 27: North America Mobile Biometrics Market Size & Forecast, by Authentication Mode, Value (US$ Bn), 2022-2031
Figure 28: North America Mobile Biometrics Market Size & Forecast, by Technology, Revenue (US$ Bn), 2017-2031
Figure 29: North America Mobile Biometrics Market Attractiveness, by Technology, Value (US$ Bn), 2022-2031
Figure 30: North America Mobile Biometrics Market Size & Forecast, by Technology, Value (US$ Bn), 2022-2031
Figure 31: North America Mobile Biometrics Market Size & Forecast, by End-use, Revenue (US$ Bn), 2017-2031
Figure 32: North America Mobile Biometrics Market Attractiveness, by End-use, Value (US$ Bn), 2022-2031
Figure 33: North America Mobile Biometrics Market Size & Forecast, by End-use, Value (US$ Bn), 2022-2031
Figure 34: North America Mobile Biometrics Market Size & Forecast, by Country, Revenue (US$ Bn), 2017-2031
Figure 35: North America Mobile Biometrics Market Attractiveness, by Country, Value (US$ Bn), 2022-2031
Figure 36: North America Mobile Biometrics Market Size & Forecast, by Country, Value (US$ Bn), 2022-2031
Figure 37: Europe Mobile Biometrics Market, Value (US$ Bn), 2017-2031
Figure 38: Europe Mobile Biometrics Market, Volume (Million Units), 2017-2031
Figure 39: Europe Mobile Biometrics Market Size & Forecast, by Component, Revenue (US$ Bn), 2017-2031
Figure 40: Europe Mobile Biometrics Market Attractiveness, by Component, Value (US$ Bn), 2022-2031
Figure 41: Europe Mobile Biometrics Market Size & Forecast, by Component, Value (US$ Bn), 2022-2031
Figure 42: Europe Mobile Biometrics Market Size & Forecast, by Authentication Mode, Revenue (US$ Bn), 2017-2031
Figure 43: Europe Mobile Biometrics Market Attractiveness, by Authentication Mode, Value (US$ Bn), 2022-2031
Figure 44: Europe Mobile Biometrics Market Size & Forecast, by Authentication Mode, Value (US$ Bn), 2022-2031
Figure 45: Europe Mobile Biometrics Market Size & Forecast, by Technology, Revenue (US$ Bn), 2017-2031
Figure 46: Europe Mobile Biometrics Market Attractiveness, by Technology, Value (US$ Bn), 2022-2031
Figure 47: Europe Mobile Biometrics Market Size & Forecast, by Technology, Value (US$ Bn), 2022-2031
Figure 48: Europe Mobile Biometrics Market Size & Forecast, by End-use, Revenue (US$ Bn), 2017-2031
Figure 49: Europe Mobile Biometrics Market Attractiveness, by End-use, Value (US$ Bn), 2022-2031
Figure 50: Europe Mobile Biometrics Market Size & Forecast, by End-use, Value (US$ Bn), 2022-2031
Figure 51: Europe Mobile Biometrics Market Size & Forecast, by Country, Revenue (US$ Bn), 2017-2031
Figure 52: Europe Mobile Biometrics Market Attractiveness, by Country, Value (US$ Bn), 2022-2031
Figure 53: Europe Mobile Biometrics Market Size & Forecast, by Country, Value (US$ Bn), 2022-2031
Figure 54: Asia Pacific Mobile Biometrics Market, Value (US$ Bn), 2017-2031
Figure 55: Asia Pacific Mobile Biometrics Market, Volume (Million Units), 2017-2031
Figure 56: Asia Pacific Mobile Biometrics Market Size & Forecast, by Component, Revenue (US$ Bn), 2017-2031
Figure 57: Asia Pacific Mobile Biometrics Market Attractiveness, by Component, Value (US$ Bn), 2022-2031
Figure 58: Asia Pacific Mobile Biometrics Market Size & Forecast, by Component, Value (US$ Bn), 2022-2031
Figure 59: Asia Pacific Mobile Biometrics Market Size & Forecast, by Authentication Mode, Revenue (US$ Bn), 2017-2031
Figure 60: Asia Pacific Mobile Biometrics Market Attractiveness, by Authentication Mode, Value (US$ Bn), 2022-2031
Figure 61: Asia Pacific Mobile Biometrics Market Size & Forecast, by Authentication Mode, Value (US$ Bn), 2022-2031
Figure 62: Asia Pacific Mobile Biometrics Market Size & Forecast, by Technology, Revenue (US$ Bn), 2017-2031
Figure 63: Asia Pacific Mobile Biometrics Market Attractiveness, by Technology, Value (US$ Bn), 2022-2031
Figure 64: Asia Pacific Mobile Biometrics Market Size & Forecast, by Technology, Value (US$ Bn), 2022-2031
Figure 65: Asia Pacific Mobile Biometrics Market Size & Forecast, by End-use, Revenue (US$ Bn), 2017-2031
Figure 66: Asia Pacific Mobile Biometrics Market Attractiveness, by End-use, Value (US$ Bn), 2022-2031
Figure 67: Asia Pacific Mobile Biometrics Market Size & Forecast, by End-use, Value (US$ Bn), 2022-2031
Figure 68: Asia Pacific Mobile Biometrics Market Size & Forecast, by Country, Revenue (US$ Bn), 2017-2031
Figure 69: Asia Pacific Mobile Biometrics Market Attractiveness, by Country, Value (US$ Bn), 2022-2031
Figure 70: Asia Pacific Mobile Biometrics Market Size & Forecast, by Country, Value (US$ Bn), 2022-2031
Figure 71: Middle East & Africa Mobile Biometrics Market, Value (US$ Bn), 2017-2031
Figure 72: Middle East & Africa Mobile Biometrics Market, Volume (Million Units), 2017-2031
Figure 73: Middle East & Africa Mobile Biometrics Market Size & Forecast, by Component, Revenue (US$ Bn), 2017-2031
Figure 74: Middle East & Africa Mobile Biometrics Market Attractiveness, by Component, Value (US$ Bn), 2022-2031
Figure 75: Middle East & Africa Mobile Biometrics Market Size & Forecast, by Component, Value (US$ Bn), 2022-2031
Figure 76: Middle East & Africa Mobile Biometrics Market Size & Forecast, by Authentication Mode, Revenue (US$ Bn), 2017-2031
Figure 77: Middle East & Africa Mobile Biometrics Market Attractiveness, by Authentication Mode, Value (US$ Bn), 2022-2031
Figure 78: Middle East & Africa Mobile Biometrics Market Size & Forecast, by Authentication Mode, Value (US$ Bn), 2022-2031
Figure 79: Middle East & Africa Mobile Biometrics Market Size & Forecast, by Technology, Revenue (US$ Bn), 2017-2031
Figure 80: Middle East & Africa Mobile Biometrics Market Attractiveness, by Technology, Value (US$ Bn), 2022-2031
Figure 81: Middle East & Africa Mobile Biometrics Market Size & Forecast, by Technology, Value (US$ Bn), 2022-2031
Figure 82: Middle East & Africa Mobile Biometrics Market Size & Forecast, by End-use, Revenue (US$ Bn), 2017-2031
Figure 83: Middle East & Africa Mobile Biometrics Market Attractiveness, by End-use, Value (US$ Bn), 2022-2031
Figure 84: Middle East & Africa Mobile Biometrics Market Size & Forecast, by End-use, Value (US$ Bn), 2022-2031
Figure 85: Middle East & Africa Mobile Biometrics Market Size & Forecast, by Country, Revenue (US$ Bn), 2017-2031
Figure 86: Middle East & Africa Mobile Biometrics Market Attractiveness, by Country, Value (US$ Bn), 2022-2031
Figure 87: Middle East & Africa Mobile Biometrics Market Size & Forecast, by Country, Value (US$ Bn), 2022-2031
Figure 88: South America Mobile Biometrics Market, Value (US$ Bn), 2017-2031
Figure 89: South America Mobile Biometrics Market, Volume (Million Units), 2017-2031
Figure 90: South America Mobile Biometrics Market Size & Forecast, by Component, Revenue (US$ Bn), 2017-2031
Figure 91: South America Mobile Biometrics Market Attractiveness, by Component, Value (US$ Bn), 2022-2031
Figure 92: South America Mobile Biometrics Market Size & Forecast, by Component, Value (US$ Bn), 2022-2031
Figure 93: South America Mobile Biometrics Market Size & Forecast, by Authentication Mode, Revenue (US$ Bn), 2017-2031
Figure 94: South America Mobile Biometrics Market Attractiveness, by Authentication Mode, Value (US$ Bn), 2022-2031
Figure 95: South America Mobile Biometrics Market Size & Forecast, by Authentication Mode, Value (US$ Bn), 2022-2031
Figure 96: South America Mobile Biometrics Market Size & Forecast, by Technology, Revenue (US$ Bn), 2017-2031
Figure 97: South America Mobile Biometrics Market Attractiveness, by Technology, Value (US$ Bn), 2022-2031
Figure 98: South America Mobile Biometrics Market Size & Forecast, by Technology, Value (US$ Bn), 2022-2031
Figure 99: South America Mobile Biometrics Market Size & Forecast, by End-use, Revenue (US$ Bn), 2017-2031
Figure 100: South America Mobile Biometrics Market Attractiveness, by End-use, Value (US$ Bn), 2022-2031
Figure 101: South America Mobile Biometrics Market Size & Forecast, by End-use, Value (US$ Bn), 2022-2031
Figure 102: South America Mobile Biometrics Market Size & Forecast, by Country, Revenue (US$ Bn), 2017-2031
Figure 103: South America Mobile Biometrics Market Attractiveness, by Country, Value (US$ Bn), 2022-2031
Figure 104: South America Mobile Biometrics Market Size & Forecast, by Country, Value (US$ Bn), 2022-2031
Figure 105: Global Mobile Biometrics Market Share Analysis, by Company
Copyright © Transparency Market Research, Inc. All Rights reserved
Trust Online

Mobile Biometrics Market