

Reports
Reports
The global linen supply & management services market size was valued at USD 63.2 Billion in 2025 and is projected to reach USD 166.6 Billion by 2036, expanding at a CAGR of 9.2% from 2026 to 2036. The market growth is driven by the rising demand for efficient and reliable linen supply & management services, increasing adoption of outsourced linen management across healthcare, hospitality, industrial, and commercial applications.
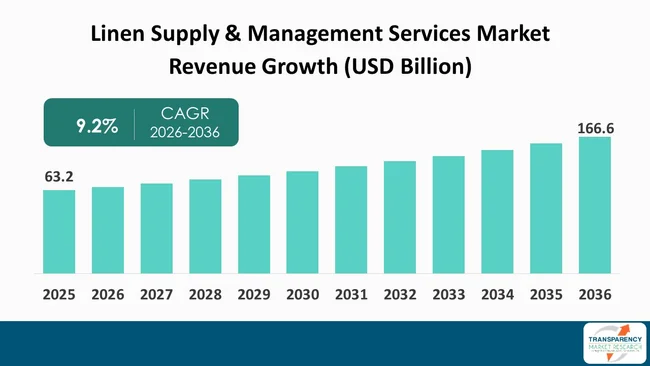
The global linen supply & management services market is being driven by stronger outsourcing, hygiene expectations, operational efficiency, and sustainability priorities among healthcare, hospitality, industrial, and institutional customers. More linen supply & management providers are offering integrated service models that bundle rental, collection, laundering, inspection, repair, replacement and delivery.
In 2024, the World Health Organization reported that only 6% of countries met all of its minimum requirements for infection prevention and control programs, highlighting ongoing gaps in healthcare hygiene systems. This environment highlights the need for reliable linen supply & management processes, particularly where clean textiles contribute to infection prevention, patient comfort and workplace hygiene.
Another key trend is the shift toward lifecycle-based service models in the linen supply & management services market. Through rental programs, customers can access textiles without the burden of ownership. Centralized laundry services also facilitate standardized cleaning and replacement procedures. Digital inventory controls, route planning, textile identification and usage monitoring are enhancing visibility across linen supply & management networks.
In the future, service consistency, processing capability, customer coverage, textile lifecycle control and environmental performance will drive competitive positioning in linen supply & management. Complex accounts can be served by providers with scalable laundries, strong logistics, specialized healthcare capabilities and disciplined inventory management. Reliable availability, consistent processing, responsive delivery, and clear textile lifecycle management are becoming increasingly important customer expectations. Providers are increasingly emphasizing process discipline, service transparency, and inventory visibility.
The linen supply & management services market covers the coordinated provision, rental, collection, laundering, processing, delivery, maintenance, and replacement of reusable textiles. These services support hospitals, hotels, restaurants, care facilities, industrial workplaces, and institutions requiring reliable access to clean textiles.
Linen supply & management programs may include bed linen, towels, uniforms, patient wear, table linen, kitchen textiles and specialty healthcare textiles. Operational activities typically include collection scheduling, sorting, washing, drying, finishing, quality inspection, packaging, storage, and distribution. Service models vary according to customer requirements.
The linen supply & management services market is also adopting digital instruments to provide inventory visibility, route coordination, textile identification, maintenance planning and service monitoring. Sustainability is becoming increasingly important as customers seek longer textile lifecycles, resource-efficient processing, responsible water and energy use, and reduced unnecessary replacement. These developments are driving providers to extend capabilities and enhance end-to-end linen supply & management solutions. This framework allows customers to select the right mix of services for their global operating model.
| Attribute | Detail |
|---|---|
| Market Drivers |
|
Increasingly stringent requirements for hygiene in healthcare are supporting the growing need for healthcare linen supply & management services in hospitals, clinics, care homes and other healthcare settings. There is a strong link between clean textiles and patient comfort, environmental hygiene and infection prevention practices. By outsourcing linen supply & management activities, healthcare organizations can rely on controlled processes for collection, washing, finishing, inspection, packaging and distribution, instead of doing every activity in-house.
Basic hygiene infrastructure remains patchy: globally, only four in ten healthcare facilities met basic sanitation standards in 2026, according to WHO and UNICEF. This condition places added emphasis on sound operational controls over environmental cleaning and related support services. Linen supply & management suppliers can respond with standardized processing procedures, segregation practices, quality controls and traceability systems that help customers maintain consistent textile handling.
Healthcare organizations also feel pressured to focus internal resources on patient care instead of non-core laundry operations. Linen supply & management outsourcing can consolidate textile procurement, inventory planning, collection, processing, replacement and delivery into a single service contract. Specialty providers can develop linen supply & management programs for operating rooms, patient wards, outpatient areas, laboratories and long-term care facilities. These services ensure a steady supply of textiles.
As healthcare systems expand their quality and infection prevention programs, linen supply & management is being viewed as an operational support service and not simply a laundry function. Providers with hygienic processing, reliable delivery, inventory discipline, textile lifecycle management, and responsive customer support can deliver additional value to healthcare customers. This drives ongoing demand for professional linen supply & management solutions across different care settings. Providers can also support documented processing controls and service-level procedures, strengthening service reliability and operational consistency.
Increasing urbanization and fast-paced lifestyles are supporting broader adoption of outsourced linen supply & management services in hospitality, foodservice, healthcare and institutional operations. As companies focus on dense urban markets, customers are increasingly seeking reliable service networks to collect used textiles, process them in a centralized location and deliver clean products with predictable schedules.
According to the cited 2025 United Nations data, cities accounted for 45% of the global population, highlighting the growing concentration of commercial and institutional activity in urban areas. Urban concentration is a driver of demand for linen supply & management as hotels, restaurants, hospitals, care facilities and commercial workplaces often require frequent textile turnover but have limited space for internal laundry operations. Dense customer clusters can also improve route efficiency for service providers.
The linen supply & management model allows multi-site businesses to standardize textile quality and service procedures. Centralized processing enables uniform washing, drying, finishing, inspection, packing, and distribution across locations. Inventory tracking and route optimization support efficient delivery scheduling and reduce disruptions caused by shortages, lost items, or fluctuating demand. Digital service records can give better visibility into customer networks.
Urban service density also incentivizes providers to increase local processing capacity and route coverage. Linen supply & management companies can create customer clusters that both improve collection and delivery efficiency and enable faster response times. Increasingly, hospitality operators, healthcare networks, restaurants and institutional customers want outsourced textile programs that provide dependable logistics and professional processing. This reinforces the role of linen supply & management as an integrated operational service in developing urban economies.
Increasing sustainability priorities are creating a significant opportunity for the linen supply & management services market through reusable textiles, longer product lifecycles, controlled processing, and resource-efficient operations. Customers are increasingly assessing services not only in terms of cleanliness and availability, but also in terms of how effectively textiles are procured, processed, repaired, reused, and ultimately replaced. Linen supply & management providers can respond to these expectations to build measurable service models that are lifecycle oriented.
In 2024 the United Nations Environment Program projected that global material extraction would rise by 60% by 2060 if action to boost resource efficiency is not intensified. This broader sustainability agenda allows linen supply & management providers to enhance their practices in the areas of reuse, textile repair, optimized washing, responsible chemical selection, efficient transport and end-of-life recovery.
Technology can open up this opportunity even further. Linen supply & management providers can use digital textile identification, automated inventory records, demand forecasting, route management and condition monitoring to gain insights into usage patterns and reduce unnecessary replacement. Data-driven controls further enable customer reporting on service frequency, textile utilization, loss and lifecycle performance. Such capabilities can improve the transparency of sustainability performance during procurement decisions.
This opportunity is particularly relevant for large healthcare, hospitality and institutional customers that need consistent service across multiple sites. Providers who combine linen supply & management with transparent lifecycle reporting, efficient processing, durable textile portfolios and sustainability-focused operating practices can differentiate their service. As procurement teams focus more on resource efficiency, linen supply & management providers can strengthen customer relationships by demonstrating improvements in resource efficiency, hygiene, textile availability, and cost control.
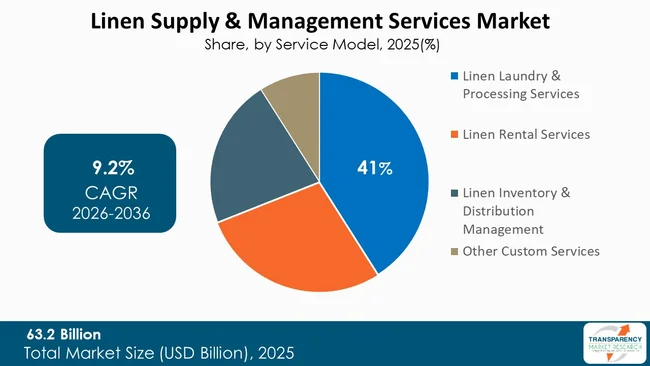
The linen laundry and processing services segment dominated the global linen supply & management services market in 2025, accounting for approximately 41% of the market. Its leading position is supported by increasing preference among healthcare, hospitality, foodservice, and industrial customers for outsourced washing, drying, ironing, folding, finishing, disinfection, stain removal, and quality-control services. Professional processing allows customers to maintain consistent hygiene and textile quality while reducing investment in in-house laundry infrastructure, equipment, labor, water, energy, and maintenance. Rising hygiene requirements and the need for reliable turnaround times are further supporting demand for specialized linen processing providers.
Linen rental services provide businesses with a reliable supply of clean, ready-to-use textiles while reducing ownership and inventory requirements. These services are particularly relevant for healthcare facilities, hospitality businesses, restaurants, and industrial establishments seeking predictable supply, lower storage requirements, and outsourced linen management.
Linen inventory and distribution management services support customers through inventory tracking, stock replenishment, collection scheduling, delivery coordination, and distribution management. These services help improve linen availability while reducing shortages, losses, excess inventory, and operational inefficiencies.
Other custom services include customer-specific offerings such as linen customization, embroidery, alterations, repair, specialized treatments, emergency replacement, and other value-added support. Demand for these services is supported by the need for greater flexibility and service differentiation. Overall, linen laundry and processing services are expected to remain the leading service segment, supported by their critical role in maintaining hygiene, textile quality, and operational consistency across major end-use industries.
| Attribute | Detail |
|---|---|
| Leading Region |
|
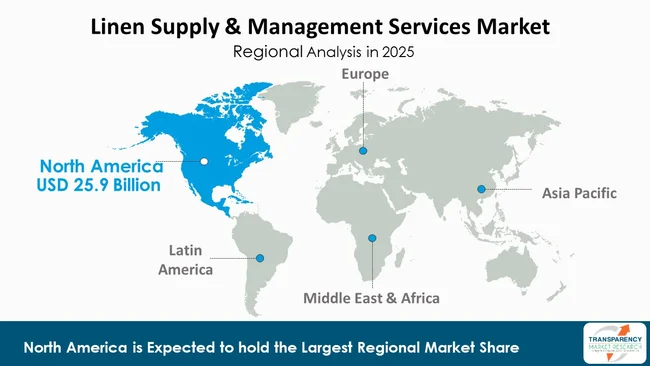
North America dominated the global linen supply & management services market in 2025, supported by its large and expanding healthcare, hospitality, foodservice, institutional, and commercial base. The region combines major urban centers with strong tourism and healthcare activity, creating broad requirements for recurring textile collection, professional processing, rental programs, inventory control, and lifecycle services. These conditions support sustained demand for integrated linen supply & management solutions.
Within North America, linen supply & management providers are strengthening service coverage around hospitals, hotels, restaurants, care facilities, and industrial customers. Urban concentration encourages centralized laundry operations and route-based distribution, while growing expectations for hygiene and service consistency support outsourcing. The region also offers opportunities for linen supply & management providers to introduce digital inventory controls, textile tracking, automated processing, and sustainability-focused operating practices.
North America is therefore positioned as the dominant region for linen supply & management, with market development supported by service outsourcing, urbanization, hospitality expansion, healthcare requirements, and operational modernization. Providers with scalable processing facilities and strong logistics networks can strengthen their regional presence. The competitive environment favors providers that efficiently integrate rental, processing, inventory visibility, maintenance, and lifecycle management across multiple customer locations.
ACE Hospitality linen, Braun Linen, Cintas Corporation, CleanCare Linen, Crown Linen Service, Elis SA, Elite Linen, Florida Linen Services, Healthcare Linen Services Group (HLSG), ImageFIRST Healthcare Laundry Specialist, K-Bro Linen Inc., Lindstrom Group, Mission Linen Supply, Prestige Linen Services, SALESIANER MIETTEX GmbH, TOKAI Corp., Unitex Textile Rental Services, Inc, Vestis Corporation are some of the leading manufacturers operating in the global linen supply & management services market. Each of these companies has been profiled in the global linen supply & management market report based on parameters such as company overview, business strategies, financial overview, business segments, product portfolio, and recent developments.
| Attribute | Detail |
|---|---|
| Market Size Value in 2025 (Base Year) | USD 63.2 Billion |
| Market Forecast Value in 2036 | USD 166.6 Billion |
| Growth Rate (CAGR 2026 to 2036) | 9.2% |
| Forecast Period | 2026-2036 |
| Historical data Available for | 2021-2025 |
| Quantitative Units | USD Billion for Value |
| Linen Supply & Management Services Market Analysis | Global qualitative analysis includes drivers, restraints, opportunities, key trends, key market indicators, Porter’s Five Forces analysis, value chain analysis, SWOT analysis, etc. Furthermore, at the regional level, qualitative analysis includes key trends, price trends, and key supplier analysis. |
| Competition Landscape |
|
| Format | Electronic (PDF) + Excel |
| Market Segmentation | Service Model
|
| Regions Covered |
|
| Countries Covered |
|
| Companies Profiled |
|
| Customization Scope | Available upon request |
| Pricing | Available upon request |
The linen supply & management services market was valued at USD 63.2 Billion in 2025.
The linen supply & management services industry is projected to reach USD 166.6 Billion by 2036.
Key driving factors include growing healthcare hygiene requirements and increasing urbanization and fast-paced lifestyles.
The linen supply & management services market is anticipated to expand at a CAGR of 9.2% from 2026 to 2036.
The linen laundry & processing services segment accounted for the largest share of the linen supply & management service market in 2025.
Asia Pacific dominated the linen supply & management services market in 2025.
ACE Hospitality Linen, Braun Linen, Cintas Corporation, CleanCare Linen, Crown Linen Service, Elis SA, Elite Linen, Florida Linen Services, Healthcare Linen Services Group (HLSG), ImageFIRST Healthcare Laundry Specialist, K-Bro Linen Inc., Lindstrom Group, Mission Linen Supply, Prestige Linen Services, SALESIANER MIETTEX GmbH, TOKAI Corp., Unitex Textile Rental Services, Inc., and Vestis Corporation are among the prominent players operating in the global linen supply & management services market
Table 01: Global Linen Supply & Management Services Market Value (USD Billion) Projection, By Service Model 2021 to 2036
Table 02: Global Linen Supply & Management Services Market Value (USD Billion) Projection, By Linen Category 2021 to 2036
Table 03: Global Linen Supply & Management Services Market Value (USD Billion) Projection, By Customer Ownership Model 2021 to 2036
Table 04: Global Linen Supply & Management Services Market Value (USD Billion) Projection, By End-use Industry 2021 to 2036
Table 05: Global Linen Supply & Management Services Market Value (USD Billion) Projection, By Region 2021 to 2036
Table 06: North America Linen Supply & Management Services Market Value (USD Billion) Projection, By Service Model 2021 to 2036
Table 07: North America Linen Supply & Management Services Market Value (USD Billion) Projection, By Linen Category 2021 to 2036
Table 08: North America Linen Supply & Management Services Market Value (USD Billion) Projection, By Customer Ownership Model 2021 to 2036
Table 09: North America Linen Supply & Management Services Market Value (USD Billion) Projection, By End-use Industry 2021 to 2036
Table 10: North America Linen Supply & Management Services Market Value (USD Billion) Projection, By Country 2021 to 2036
Table 11: U.S. Linen Supply & Management Services Market Value (USD Billion) Projection, By Service Model 2021 to 2036
Table 12: U.S. Linen Supply & Management Services Market Value (USD Billion) Projection, By Linen Category 2021 to 2036
Table 13: U.S. Linen Supply & Management Services Market Value (USD Billion) Projection, By Customer Ownership Model 2021 to 2036
Table 14: U.S. Linen Supply & Management Services Market Value (USD Billion) Projection, By End-use Industry 2021 to 2036
Table 15: Canada Linen Supply & Management Services Market Value (USD Billion) Projection, By Service Model 2021 to 2036
Table 16: Canada Linen Supply & Management Services Market Value (USD Billion) Projection, By Linen Category 2021 to 2036
Table 17: Canada Linen Supply & Management Services Market Value (USD Billion) Projection, By Customer Ownership Model 2021 to 2036
Table 18: Canada Linen Supply & Management Services Market Value (USD Billion) Projection, By End-use Industry 2021 to 2036
Table 19: Europe Linen Supply & Management Services Market Value (USD Billion) Projection, By Service Model 2021 to 2036
Table 20: Europe Linen Supply & Management Services Market Value (USD Billion) Projection, By Linen Category 2021 to 2036
Table 21: Europe Linen Supply & Management Services Market Value (USD Billion) Projection, By Customer Ownership Model 2021 to 2036
Table 22: Europe Linen Supply & Management Services Market Value (USD Billion) Projection, By End-use Industry 2021 to 2036
Table 23: Europe Linen Supply & Management Services Market Value (USD Billion) Projection, By Country 2021 to 2036
Table 24: U.K. Linen Supply & Management Services Market Value (USD Billion) Projection, By Service Model 2021 to 2036
Table 25: U.K. Linen Supply & Management Services Market Value (USD Billion) Projection, By Linen Category 2021 to 2036
Table 26: U.K. Linen Supply & Management Services Market Value (USD Billion) Projection, By Customer Ownership Model 2021 to 2036
Table 27: U.K. Linen Supply & Management Services Market Value (USD Billion) Projection, By End-use Industry 2021 to 2036
Table 28: Germany Linen Supply & Management Services Market Value (USD Billion) Projection, By Service Model 2021 to 2036
Table 29: Germany Linen Supply & Management Services Market Value (USD Billion) Projection, By Linen Category 2021 to 2036
Table 30: Germany Linen Supply & Management Services Market Value (USD Billion) Projection, By Customer Ownership Model 2021 to 2036
Table 31: Germany Linen Supply & Management Services Market Value (USD Billion) Projection, By End-use Industry 2021 to 2036
Table 32: France Linen Supply & Management Services Market Value (USD Billion) Projection, By Service Model 2021 to 2036
Table 33: France Linen Supply & Management Services Market Value (USD Billion) Projection, By Linen Category 2021 to 2036
Table 34: France Linen Supply & Management Services Market Value (USD Billion) Projection, By Customer Ownership Model 2021 to 2036
Table 35: France Linen Supply & Management Services Market Value (USD Billion) Projection, By End-use Industry 2021 to 2036
Table 36: Italy Linen Supply & Management Services Market Value (USD Billion) Projection, By Service Model 2021 to 2036
Table 37: Italy Linen Supply & Management Services Market Value (USD Billion) Projection, By Linen Category 2021 to 2036
Table 38: Italy Linen Supply & Management Services Market Value (USD Billion) Projection, By Customer Ownership Model 2021 to 2036
Table 39: Italy Linen Supply & Management Services Market Value (USD Billion) Projection, By End-use Industry 2021 to 2036
Table 40: Spain Linen Supply & Management Services Market Value (USD Billion) Projection, By Service Model 2021 to 2036
Table 41: Spain Linen Supply & Management Services Market Value (USD Billion) Projection, By Linen Category 2021 to 2036
Table 42: Spain Linen Supply & Management Services Market Value (USD Billion) Projection, By Customer Ownership Model 2021 to 2036
Table 43: Spain Linen Supply & Management Services Market Value (USD Billion) Projection, By End-use Industry 2021 to 2036
Table 44: The Netherlands Linen Supply & Management Services Market Value (USD Billion) Projection, By Service Model 2021 to 2036
Table 45: The Netherlands Linen Supply & Management Services Market Value (USD Billion) Projection, By Linen Category 2021 to 2036
Table 46: The Netherlands Linen Supply & Management Services Market Value (USD Billion) Projection, By Customer Ownership Model 2021 to 2036
Table 47: The Netherlands Linen Supply & Management Services Market Value (USD Billion) Projection, By End-use Industry 2021 to 2036
Table 48: Asia Pacific Linen Supply & Management Services Market Value (USD Billion) Projection, By Service Model 2021 to 2036
Table 49: Asia Pacific Linen Supply & Management Services Market Value (USD Billion) Projection, By Linen Category 2021 to 2036
Table 50: Asia Pacific Linen Supply & Management Services Market Value (USD Billion) Projection, By Customer Ownership Model 2021 to 2036
Table 51: Asia Pacific Linen Supply & Management Services Market Value (USD Billion) Projection, By End-use Industry 2021 to 2036
Table 52: Asia Pacific Linen Supply & Management Services Market Value (USD Billion) Projection, By Country 2021 to 2036
Table 53: China Linen Supply & Management Services Market Value (USD Billion) Projection, By Service Model 2021 to 2036
Table 54: China Linen Supply & Management Services Market Value (USD Billion) Projection, By Linen Category 2021 to 2036
Table 55: China Linen Supply & Management Services Market Value (USD Billion) Projection, By Customer Ownership Model 2021 to 2036
Table 56: China Linen Supply & Management Services Market Value (USD Billion) Projection, By End-use Industry 2021 to 2036
Table 57: India Linen Supply & Management Services Market Value (USD Billion) Projection, By Service Model 2021 to 2036
Table 58: India Linen Supply & Management Services Market Value (USD Billion) Projection, By Linen Category 2021 to 2036
Table 59: India Linen Supply & Management Services Market Value (USD Billion) Projection, By Customer Ownership Model 2021 to 2036
Table 60: India Linen Supply & Management Services Market Value (USD Billion) Projection, By End-use Industry 2021 to 2036
Table 61: Japan Linen Supply & Management Services Market Value (USD Billion) Projection, By Service Model 2021 to 2036
Table 62: Japan Linen Supply & Management Services Market Value (USD Billion) Projection, By Linen Category 2021 to 2036
Table 63: Japan Linen Supply & Management Services Market Value (USD Billion) Projection, By Customer Ownership Model 2021 to 2036
Table 64: Japan Linen Supply & Management Services Market Value (USD Billion) Projection, By End-use Industry 2021 to 2036
Table 65: Australia Linen Supply & Management Services Market Value (USD Billion) Projection, By Service Model 2021 to 2036
Table 66: Australia Linen Supply & Management Services Market Value (USD Billion) Projection, By Linen Category 2021 to 2036
Table 67: Australia Linen Supply & Management Services Market Value (USD Billion) Projection, By Customer Ownership Model 2021 to 2036
Table 68: Australia Linen Supply & Management Services Market Value (USD Billion) Projection, By End-use Industry 2021 to 2036
Table 69: South Korea Linen Supply & Management Services Market Value (USD Billion) Projection, By Service Model 2021 to 2036
Table 70: South Korea Linen Supply & Management Services Market Value (USD Billion) Projection, By Linen Category 2021 to 2036
Table 71: South Korea Linen Supply & Management Services Market Value (USD Billion) Projection, By Customer Ownership Model 2021 to 2036
Table 72: South Korea Linen Supply & Management Services Market Value (USD Billion) Projection, By End-use Industry 2021 to 2036
Table 73: ASEAN Linen Supply & Management Services Market Value (USD Billion) Projection, By Service Model 2021 to 2036
Table 74: ASEAN Linen Supply & Management Services Market Value (USD Billion) Projection, By Linen Category 2021 to 2036
Table 75: ASEAN Linen Supply & Management Services Market Value (USD Billion) Projection, By Customer Ownership Model 2021 to 2036
Table 76: ASEAN Linen Supply & Management Services Market Value (USD Billion) Projection, By End-use Industry 2021 to 2036
Table 77: Middle East & Africa Linen Supply & Management Services Market Value (USD Billion) Projection, By Service Model 2021 to 2036
Table 78: Middle East & Africa Linen Supply & Management Services Market Value (USD Billion) Projection, By Linen Category 2021 to 2036
Table 79: Middle East & Africa Linen Supply & Management Services Market Value (USD Billion) Projection, By Customer Ownership Model 2021 to 2036
Table 80: Middle East & Africa Linen Supply & Management Services Market Value (USD Billion) Projection, By End-use Industry 2021 to 2036
Table 81: Middle East & Africa Linen Supply & Management Services Market Value (USD Billion) Projection, By Country 2021 to 2036
Table 82: GCC Countries Linen Supply & Management Services Market Value (USD Billion) Projection, By Service Model 2021 to 2036
Table 83: GCC Countries Linen Supply & Management Services Market Value (USD Billion) Projection, By Linen Category 2021 to 2036
Table 84: GCC Countries Linen Supply & Management Services Market Value (USD Billion) Projection, By Customer Ownership Model 2021 to 2036
Table 85: GCC Countries Linen Supply & Management Services Market Value (USD Billion) Projection, By End-use Industry 2021 to 2036
Table 86: South Africa Linen Supply & Management Services Market Value (USD Billion) Projection, By Service Model 2021 to 2036
Table 87: South Africa Linen Supply & Management Services Market Value (USD Billion) Projection, By Linen Category 2021 to 2036
Table 88: South Africa Linen Supply & Management Services Market Value (USD Billion) Projection, By Customer Ownership Model 2021 to 2036
Table 89: South Africa Linen Supply & Management Services Market Value (USD Billion) Projection, By End-use Industry 2021 to 2036
Table 90: Latin America Linen Supply & Management Services Market Value (USD Billion) Projection, By Service Model 2021 to 2036
Table 91: Latin America Linen Supply & Management Services Market Value (USD Billion) Projection, By Linen Category 2021 to 2036
Table 92: Latin America Linen Supply & Management Services Market Value (USD Billion) Projection, By Customer Ownership Model 2021 to 2036
Table 93: Latin America Linen Supply & Management Services Market Value (USD Billion) Projection, By End-use Industry 2021 to 2036
Table 94: Latin America Linen Supply & Management Services Market Value (USD Billion) Projection, By Country 2021 to 2036
Table 95: Brazil Linen Supply & Management Services Market Value (USD Billion) Projection, By Service Model 2021 to 2036
Table 96: Brazil Linen Supply & Management Services Market Value (USD Billion) Projection, By Linen Category 2021 to 2036
Table 97: Brazil Linen Supply & Management Services Market Value (USD Billion) Projection, By Customer Ownership Model 2021 to 2036
Table 98: Brazil Linen Supply & Management Services Market Value (USD Billion) Projection, By End-use Industry 2021 to 2036
Table 99: Mexico Linen Supply & Management Services Market Value (USD Billion) Projection, By Service Model 2021 to 2036
Table 100: Mexico Linen Supply & Management Services Market Value (USD Billion) Projection, By Linen Category 2021 to 2036
Table 101: Mexico Linen Supply & Management Services Market Value (USD Billion) Projection, By Customer Ownership Model 2021 to 2036
Table 102: Mexico Linen Supply & Management Services Market Value (USD Billion) Projection, By End-use Industry 2021 to 2036
Table 103: Argentina Linen Supply & Management Services Market Value (USD Billion) Projection, By Service Model 2021 to 2036
Table 104: Argentina Linen Supply & Management Services Market Value (USD Billion) Projection, By Linen Category 2021 to 2036
Table 105: Argentina Linen Supply & Management Services Market Value (USD Billion) Projection, By Customer Ownership Model 2021 to 2036
Table 106: Argentina Linen Supply & Management Services Market Value (USD Billion) Projection, By End-use Industry 2021 to 2036
Figure 01: Global Linen Supply & Management Services Market Value (USD Billion) Projection, By Service Model 2021 to 2036
Figure 02: Global Linen Supply & Management Services Market Incremental Opportunities (USD Billion) Forecast, By Service Model 2026 to 2036
Figure 03: Global Linen Supply & Management Services Market Value (USD Billion) Projection, By Linen Category 2021 to 2036
Figure 04: Global Linen Supply & Management Services Market Incremental Opportunities (USD Billion) Forecast, By Linen Category 2026 to 2036
Figure 05: Global Linen Supply & Management Services Market Value (USD Billion) Projection, By Customer Ownership Model 2021 to 2036
Figure 06: Global Linen Supply & Management Services Market Incremental Opportunities (USD Billion) Forecast, By Customer Ownership Model 2026 to 2036
Figure 07: Global Linen Supply & Management Services Market Value (USD Billion) Projection, By End-use Industry 2021 to 2036
Figure 08: Global Linen Supply & Management Services Market Incremental Opportunities (USD Billion) Forecast, By End-use Industry 2026 to 2036
Figure 09: Global Linen Supply & Management Services Market Value (USD Billion) Projection, By Region 2021 to 2036
Figure 10: Global Linen Supply & Management Services Market Incremental Opportunities (USD Billion) Forecast, By Country 2026 to 2036
Figure 11: North America Linen Supply & Management Services Market Value (USD Billion) Projection, By Service Model 2021 to 2036
Figure 12: North America Linen Supply & Management Services Market Incremental Opportunities (USD Billion) Forecast, By Service Model 2026 to 2036
Figure 13: North America Linen Supply & Management Services Market Value (USD Billion) Projection, By Linen Category 2021 to 2036
Figure 14: North America Linen Supply & Management Services Market Incremental Opportunities (USD Billion) Forecast, By Linen Category 2026 to 2036
Figure 15: North America Linen Supply & Management Services Market Value (USD Billion) Projection, By Customer Ownership Model 2021 to 2036
Figure 16: North America Linen Supply & Management Services Market Incremental Opportunities (USD Billion) Forecast, By Customer Ownership Model 2026 to 2036
Figure 17: North America Linen Supply & Management Services Market Value (USD Billion) Projection, By End-use Industry 2021 to 2036
Figure 18: North America Linen Supply & Management Services Market Incremental Opportunities (USD Billion) Forecast, By End-use Industry 2026 to 2036
Figure 19: North America Linen Supply & Management Services Market Value (USD Billion) Projection, By Country 2021 to 2036
Figure 20: North America Linen Supply & Management Services Market Incremental Opportunities (USD Billion) Forecast, By Country 2026 to 2036
Figure 21: U.S. Linen Supply & Management Services Market Value (USD Billion) Projection, By Service Model 2021 to 2036
Figure 22: U.S. Linen Supply & Management Services Market Incremental Opportunities (USD Billion) Forecast, By Service Model 2026 to 2036
Figure 23: U.S. Linen Supply & Management Services Market Value (USD Billion) Projection, By Linen Category 2021 to 2036
Figure 24: U.S. Linen Supply & Management Services Market Incremental Opportunities (USD Billion) Forecast, By Linen Category 2026 to 2036
Figure 25: U.S. Linen Supply & Management Services Market Value (USD Billion) Projection, By Customer Ownership Model 2021 to 2036
Figure 26: U.S. Linen Supply & Management Services Market Incremental Opportunities (USD Billion) Forecast, By Customer Ownership Model 2026 to 2036
Figure 27: U.S. Linen Supply & Management Services Market Value (USD Billion) Projection, By End-use Industry 2021 to 2036
Figure 28: U.S. Linen Supply & Management Services Market Incremental Opportunities (USD Billion) Forecast, By End-use Industry 2026 to 2036
Figure 29: Canada Linen Supply & Management Services Market Value (USD Billion) Projection, By Service Model 2021 to 2036
Figure 30: Canada Linen Supply & Management Services Market Incremental Opportunities (USD Billion) Forecast, By Service Model 2026 to 2036
Figure 31: Canada Linen Supply & Management Services Market Value (USD Billion) Projection, By Linen Category 2021 to 2036
Figure 32: Canada Linen Supply & Management Services Market Incremental Opportunities (USD Billion) Forecast, By Linen Category 2026 to 2036
Figure 33: Canada Linen Supply & Management Services Market Value (USD Billion) Projection, By Customer Ownership Model 2021 to 2036
Figure 34: Canada Linen Supply & Management Services Market Incremental Opportunities (USD Billion) Forecast, By Customer Ownership Model 2026 to 2036
Figure 35: Canada Linen Supply & Management Services Market Value (USD Billion) Projection, By End-use Industry 2021 to 2036
Figure 36: Canada Linen Supply & Management Services Market Incremental Opportunities (USD Billion) Forecast, By End-use Industry 2026 to 2036
Figure 37: Europe Linen Supply & Management Services Market Value (USD Billion) Projection, By Service Model 2021 to 2036
Figure 38: Europe Linen Supply & Management Services Market Incremental Opportunities (USD Billion) Forecast, By Service Model 2026 to 2036
Figure 39: Europe Linen Supply & Management Services Market Value (USD Billion) Projection, By Linen Category 2021 to 2036
Figure 40: Europe Linen Supply & Management Services Market Incremental Opportunities (USD Billion) Forecast, By Linen Category 2026 to 2036
Figure 41: Europe Linen Supply & Management Services Market Value (USD Billion) Projection, By Customer Ownership Model 2021 to 2036
Figure 42: Europe Linen Supply & Management Services Market Incremental Opportunities (USD Billion) Forecast, By Customer Ownership Model 2026 to 2036
Figure 43: Europe Linen Supply & Management Services Market Value (USD Billion) Projection, By End-use Industry 2021 to 2036
Figure 44: Europe Linen Supply & Management Services Market Incremental Opportunities (USD Billion) Forecast, By End-use Industry 2026 to 2036
Figure 45: Europe Linen Supply & Management Services Market Value (USD Billion) Projection, By Country 2021 to 2036
Figure 46: Europe Linen Supply & Management Services Market Incremental Opportunities (USD Billion) Forecast, By Country 2026 to 2036
Figure 47: U.K. Linen Supply & Management Services Market Value (USD Billion) Projection, By Service Model 2021 to 2036
Figure 48: U.K. Linen Supply & Management Services Market Incremental Opportunities (USD Billion) Forecast, By Service Model 2026 to 2036
Figure 49: U.K. Linen Supply & Management Services Market Value (USD Billion) Projection, By Linen Category 2021 to 2036
Figure 50: U.K. Linen Supply & Management Services Market Incremental Opportunities (USD Billion) Forecast, By Linen Category 2026 to 2036
Figure 51: U.K. Linen Supply & Management Services Market Value (USD Billion) Projection, By Customer Ownership Model 2021 to 2036
Figure 52: U.K. Linen Supply & Management Services Market Incremental Opportunities (USD Billion) Forecast, By Customer Ownership Model 2026 to 2036
Figure 53: U.K. Linen Supply & Management Services Market Value (USD Billion) Projection, By End-use Industry 2021 to 2036
Figure 54: U.K. Linen Supply & Management Services Market Incremental Opportunities (USD Billion) Forecast, By End-use Industry 2026 to 2036
Figure 55: Germany Linen Supply & Management Services Market Value (USD Billion) Projection, By Service Model 2021 to 2036
Figure 56: Germany Linen Supply & Management Services Market Incremental Opportunities (USD Billion) Forecast, By Service Model 2026 to 2036
Figure 57: Germany Linen Supply & Management Services Market Value (USD Billion) Projection, By Linen Category 2021 to 2036
Figure 58: Germany Linen Supply & Management Services Market Incremental Opportunities (USD Billion) Forecast, By Linen Category 2026 to 2036
Figure 59: Germany Linen Supply & Management Services Market Value (USD Billion) Projection, By Customer Ownership Model 2021 to 2036
Figure 60: Germany Linen Supply & Management Services Market Incremental Opportunities (USD Billion) Forecast, By Customer Ownership Model 2026 to 2036
Figure 61: Germany Linen Supply & Management Services Market Value (USD Billion) Projection, By End-use Industry 2021 to 2036
Figure 62: Germany Linen Supply & Management Services Market Incremental Opportunities (USD Billion) Forecast, By End-use Industry 2026 to 2036
Figure 63: France Linen Supply & Management Services Market Value (USD Billion) Projection, By Service Model 2021 to 2036
Figure 64: France Linen Supply & Management Services Market Incremental Opportunities (USD Billion) Forecast, By Service Model 2026 to 2036
Figure 65: France Linen Supply & Management Services Market Value (USD Billion) Projection, By Linen Category 2021 to 2036
Figure 66: France Linen Supply & Management Services Market Incremental Opportunities (USD Billion) Forecast, By Linen Category 2026 to 2036
Figure 67: France Linen Supply & Management Services Market Value (USD Billion) Projection, By Customer Ownership Model 2021 to 2036
Figure 68: France Linen Supply & Management Services Market Incremental Opportunities (USD Billion) Forecast, By Customer Ownership Model 2026 to 2036
Figure 69: France Linen Supply & Management Services Market Value (USD Billion) Projection, By End-use Industry 2021 to 2036
Figure 70: France Linen Supply & Management Services Market Incremental Opportunities (USD Billion) Forecast, By End-use Industry 2026 to 2036
Figure 71: Italy Linen Supply & Management Services Market Value (USD Billion) Projection, By Service Model 2021 to 2036
Figure 72: Italy Linen Supply & Management Services Market Incremental Opportunities (USD Billion) Forecast, By Service Model 2026 to 2036
Figure 73: Italy Linen Supply & Management Services Market Value (USD Billion) Projection, By Linen Category 2021 to 2036
Figure 74: Italy Linen Supply & Management Services Market Incremental Opportunities (USD Billion) Forecast, By Linen Category 2026 to 2036
Figure 75: Italy Linen Supply & Management Services Market Value (USD Billion) Projection, By Customer Ownership Model 2021 to 2036
Figure 76: Italy Linen Supply & Management Services Market Incremental Opportunities (USD Billion) Forecast, By Customer Ownership Model 2026 to 2036
Figure 77: Italy Linen Supply & Management Services Market Value (USD Billion) Projection, By End-use Industry 2021 to 2036
Figure 78: Italy Linen Supply & Management Services Market Incremental Opportunities (USD Billion) Forecast, By End-use Industry 2026 to 2036
Figure 79: Spain Linen Supply & Management Services Market Value (USD Billion) Projection, By Service Model 2021 to 2036
Figure 80: Spain Linen Supply & Management Services Market Incremental Opportunities (USD Billion) Forecast, By Service Model 2026 to 2036
Figure 81: Spain Linen Supply & Management Services Market Value (USD Billion) Projection, By Linen Category 2021 to 2036
Figure 82: Spain Linen Supply & Management Services Market Incremental Opportunities (USD Billion) Forecast, By Linen Category 2026 to 2036
Figure 83: Spain Linen Supply & Management Services Market Value (USD Billion) Projection, By Customer Ownership Model 2021 to 2036
Figure 84: Spain Linen Supply & Management Services Market Incremental Opportunities (USD Billion) Forecast, By Customer Ownership Model 2026 to 2036
Figure 85: Spain Linen Supply & Management Services Market Value (USD Billion) Projection, By End-use Industry 2021 to 2036
Figure 86: Spain Linen Supply & Management Services Market Incremental Opportunities (USD Billion) Forecast, By End-use Industry 2026 to 2036
Figure 87: The Netherlands Linen Supply & Management Services Market Value (USD Billion) Projection, By Service Model 2021 to 2036
Figure 88: The Netherlands Linen Supply & Management Services Market Incremental Opportunities (USD Billion) Forecast, By Service Model 2026 to 2036
Figure 89: The Netherlands Linen Supply & Management Services Market Value (USD Billion) Projection, By Linen Category 2021 to 2036
Figure 90: The Netherlands Linen Supply & Management Services Market Incremental Opportunities (USD Billion) Forecast, By Linen Category 2026 to 2036
Figure 91: The Netherlands Linen Supply & Management Services Market Value (USD Billion) Projection, By Customer Ownership Model 2021 to 2036
Figure 92: The Netherlands Linen Supply & Management Services Market Incremental Opportunities (USD Billion) Forecast, By Customer Ownership Model 2026 to 2036
Figure 93: The Netherlands Linen Supply & Management Services Market Value (USD Billion) Projection, By End-use Industry 2021 to 2036
Figure 94: The Netherlands Linen Supply & Management Services Market Incremental Opportunities (USD Billion) Forecast, By End-use Industry 2026 to 2036
Figure 95: Asia Pacific Linen Supply & Management Services Market Value (USD Billion) Projection, By Service Model 2021 to 2036
Figure 96: Asia Pacific Linen Supply & Management Services Market Incremental Opportunities (USD Billion) Forecast, By Service Model 2026 to 2036
Figure 97: Asia Pacific Linen Supply & Management Services Market Value (USD Billion) Projection, By Linen Category 2021 to 2036
Figure 98: Asia Pacific Linen Supply & Management Services Market Incremental Opportunities (USD Billion) Forecast, By Linen Category 2026 to 2036
Figure 99: Asia Pacific Linen Supply & Management Services Market Value (USD Billion) Projection, By Customer Ownership Model 2021 to 2036
Figure 100: Asia Pacific Linen Supply & Management Services Market Incremental Opportunities (USD Billion) Forecast, By Customer Ownership Model 2026 to 2036
Figure 101: Asia Pacific Linen Supply & Management Services Market Value (USD Billion) Projection, By End-use Industry 2021 to 2036
Figure 102: Asia Pacific Linen Supply & Management Services Market Incremental Opportunities (USD Billion) Forecast, By End-use Industry 2026 to 2036
Figure 103: Asia Pacific Linen Supply & Management Services Market Value (USD Billion) Projection, By Country 2021 to 2036
Figure 104: Asia Pacific Linen Supply & Management Services Market Incremental Opportunities (USD Billion) Forecast, By Country 2026 to 2036
Figure 105: China Linen Supply & Management Services Market Value (USD Billion) Projection, By Service Model 2021 to 2036
Figure 106: China Linen Supply & Management Services Market Incremental Opportunities (USD Billion) Forecast, By Service Model 2026 to 2036
Figure 107: China Linen Supply & Management Services Market Value (USD Billion) Projection, By Linen Category 2021 to 2036
Figure 108: China Linen Supply & Management Services Market Incremental Opportunities (USD Billion) Forecast, By Linen Category 2026 to 2036
Figure 109: China Linen Supply & Management Services Market Value (USD Billion) Projection, By Customer Ownership Model 2021 to 2036
Figure 110: China Linen Supply & Management Services Market Incremental Opportunities (USD Billion) Forecast, By Customer Ownership Model 2026 to 2036
Figure 111: China Linen Supply & Management Services Market Value (USD Billion) Projection, By End-use Industry 2021 to 2036
Figure 112: China Linen Supply & Management Services Market Incremental Opportunities (USD Billion) Forecast, By End-use Industry 2026 to 2036
Figure 113: India Linen Supply & Management Services Market Value (USD Billion) Projection, By Service Model 2021 to 2036
Figure 114: India Linen Supply & Management Services Market Incremental Opportunities (USD Billion) Forecast, By Service Model 2026 to 2036
Figure 115: India Linen Supply & Management Services Market Value (USD Billion) Projection, By Linen Category 2021 to 2036
Figure 116: India Linen Supply & Management Services Market Incremental Opportunities (USD Billion) Forecast, By Linen Category 2026 to 2036
Figure 117: India Linen Supply & Management Services Market Value (USD Billion) Projection, By Customer Ownership Model 2021 to 2036
Figure 118: India Linen Supply & Management Services Market Incremental Opportunities (USD Billion) Forecast, By Customer Ownership Model 2026 to 2036
Figure 119: India Linen Supply & Management Services Market Value (USD Billion) Projection, By End-use Industry 2021 to 2036
Figure 120: India Linen Supply & Management Services Market Incremental Opportunities (USD Billion) Forecast, By End-use Industry 2026 to 2036
Figure 121: Japan Linen Supply & Management Services Market Value (USD Billion) Projection, By Service Model 2021 to 2036
Figure 122: Japan Linen Supply & Management Services Market Incremental Opportunities (USD Billion) Forecast, By Service Model 2026 to 2036
Figure 123: Japan Linen Supply & Management Services Market Value (USD Billion) Projection, By Linen Category 2021 to 2036
Figure 124: Japan Linen Supply & Management Services Market Incremental Opportunities (USD Billion) Forecast, By Linen Category 2026 to 2036
Figure 125: Japan Linen Supply & Management Services Market Value (USD Billion) Projection, By Customer Ownership Model 2021 to 2036
Figure 126: Japan Linen Supply & Management Services Market Incremental Opportunities (USD Billion) Forecast, By Customer Ownership Model 2026 to 2036
Figure 127: Japan Linen Supply & Management Services Market Value (USD Billion) Projection, By End-use Industry 2021 to 2036
Figure 128: Japan Linen Supply & Management Services Market Incremental Opportunities (USD Billion) Forecast, By End-use Industry 2026 to 2036
Figure 129: Australia Linen Supply & Management Services Market Value (USD Billion) Projection, By Service Model 2021 to 2036
Figure 130: Australia Linen Supply & Management Services Market Incremental Opportunities (USD Billion) Forecast, By Service Model 2026 to 2036
Figure 131: Australia Linen Supply & Management Services Market Value (USD Billion) Projection, By Linen Category 2021 to 2036
Figure 132: Australia Linen Supply & Management Services Market Incremental Opportunities (USD Billion) Forecast, By Linen Category 2026 to 2036
Figure 133: Australia Linen Supply & Management Services Market Value (USD Billion) Projection, By Customer Ownership Model 2021 to 2036
Figure 134: Australia Linen Supply & Management Services Market Incremental Opportunities (USD Billion) Forecast, By Customer Ownership Model 2026 to 2036
Figure 135: Australia Linen Supply & Management Services Market Value (USD Billion) Projection, By End-use Industry 2021 to 2036
Figure 136: Australia Linen Supply & Management Services Market Incremental Opportunities (USD Billion) Forecast, By End-use Industry 2026 to 2036
Figure 137: South Korea Linen Supply & Management Services Market Value (USD Billion) Projection, By Service Model 2021 to 2036
Figure 138: South Korea Linen Supply & Management Services Market Incremental Opportunities (USD Billion) Forecast, By Service Model 2026 to 2036
Figure 139: South Korea Linen Supply & Management Services Market Value (USD Billion) Projection, By Linen Category 2021 to 2036
Figure 140: South Korea Linen Supply & Management Services Market Incremental Opportunities (USD Billion) Forecast, By Linen Category 2026 to 2036
Figure 141: South Korea Linen Supply & Management Services Market Value (USD Billion) Projection, By Customer Ownership Model 2021 to 2036
Figure 142: South Korea Linen Supply & Management Services Market Incremental Opportunities (USD Billion) Forecast, By Customer Ownership Model 2026 to 2036
Figure 143: South Korea Linen Supply & Management Services Market Value (USD Billion) Projection, By End-use Industry 2021 to 2036
Figure 144: South Korea Linen Supply & Management Services Market Incremental Opportunities (USD Billion) Forecast, By End-use Industry 2026 to 2036
Figure 145: ASEAN Linen Supply & Management Services Market Value (USD Billion) Projection, By Service Model 2021 to 2036
Figure 146: ASEAN Linen Supply & Management Services Market Incremental Opportunities (USD Billion) Forecast, By Service Model 2026 to 2036
Figure 147: ASEAN Linen Supply & Management Services Market Value (USD Billion) Projection, By Linen Category 2021 to 2036
Figure 148: ASEAN Linen Supply & Management Services Market Incremental Opportunities (USD Billion) Forecast, By Linen Category 2026 to 2036
Figure 149: ASEAN Linen Supply & Management Services Market Value (USD Billion) Projection, By Customer Ownership Model 2021 to 2036
Figure 150: ASEAN Linen Supply & Management Services Market Incremental Opportunities (USD Billion) Forecast, By Customer Ownership Model 2026 to 2036
Figure 151: ASEAN Linen Supply & Management Services Market Value (USD Billion) Projection, By End-use Industry 2021 to 2036
Figure 152: ASEAN Linen Supply & Management Services Market Incremental Opportunities (USD Billion) Forecast, By End-use Industry 2026 to 2036
Figure 153: Middle East & Africa Linen Supply & Management Services Market Value (USD Billion) Projection, By Service Model 2021 to 2036
Figure 154: Middle East & Africa Linen Supply & Management Services Market Incremental Opportunities (USD Billion) Forecast, By Service Model 2026 to 2036
Figure 155: Middle East & Africa Linen Supply & Management Services Market Value (USD Billion) Projection, By Linen Category 2021 to 2036
Figure 156: Middle East & Africa Linen Supply & Management Services Market Incremental Opportunities (USD Billion) Forecast, By Linen Category 2026 to 2036
Figure 157: Middle East & Africa Linen Supply & Management Services Market Value (USD Billion) Projection, By Customer Ownership Model 2021 to 2036
Figure 158: Middle East & Africa Linen Supply & Management Services Market Incremental Opportunities (USD Billion) Forecast, By Customer Ownership Model 2026 to 2036
Figure 159: Middle East & Africa Linen Supply & Management Services Market Value (USD Billion) Projection, By End-use Industry 2021 to 2036
Figure 160: Middle East & Africa Linen Supply & Management Services Market Incremental Opportunities (USD Billion) Forecast, By End-use Industry 2026 to 2036
Figure 161: Middle East & Africa Linen Supply & Management Services Market Value (USD Billion) Projection, By Country 2021 to 2036
Figure 162: Middle East & Africa Linen Supply & Management Services Market Incremental Opportunities (USD Billion) Forecast, By Country 2026 to 2036
Figure 163: GCC Countries Linen Supply & Management Services Market Value (USD Billion) Projection, By Service Model 2021 to 2036
Figure 164: GCC Countries Linen Supply & Management Services Market Incremental Opportunities (USD Billion) Forecast, By Service Model 2026 to 2036
Figure 165: GCC Countries Linen Supply & Management Services Market Value (USD Billion) Projection, By Linen Category 2021 to 2036
Figure 166: GCC Countries Linen Supply & Management Services Market Incremental Opportunities (USD Billion) Forecast, By Linen Category 2026 to 2036
Figure 167: GCC Countries Linen Supply & Management Services Market Value (USD Billion) Projection, By Customer Ownership Model 2021 to 2036
Figure 168: GCC Countries Linen Supply & Management Services Market Incremental Opportunities (USD Billion) Forecast, By Customer Ownership Model 2026 to 2036
Figure 169: GCC Countries Linen Supply & Management Services Market Value (USD Billion) Projection, By End-use Industry 2021 to 2036
Figure 170: GCC Countries Linen Supply & Management Services Market Incremental Opportunities (USD Billion) Forecast, By End-use Industry 2026 to 2036
Figure 171: South Africa Linen Supply & Management Services Market Value (USD Billion) Projection, By Service Model 2021 to 2036
Figure 172: South Africa Linen Supply & Management Services Market Incremental Opportunities (USD Billion) Forecast, By Service Model 2026 to 2036
Figure 173: South Africa Linen Supply & Management Services Market Value (USD Billion) Projection, By Linen Category 2021 to 2036
Figure 174: South Africa Linen Supply & Management Services Market Incremental Opportunities (USD Billion) Forecast, By Linen Category 2026 to 2036
Figure 175: South Africa Linen Supply & Management Services Market Value (USD Billion) Projection, By Customer Ownership Model 2021 to 2036
Figure 176: South Africa Linen Supply & Management Services Market Incremental Opportunities (USD Billion) Forecast, By Customer Ownership Model 2026 to 2036
Figure 177: South Africa Linen Supply & Management Services Market Value (USD Billion) Projection, By End-use Industry 2021 to 2036
Figure 178: South Africa Linen Supply & Management Services Market Incremental Opportunities (USD Billion) Forecast, By End-use Industry 2026 to 2036
Figure 179: Latin America Linen Supply & Management Services Market Value (USD Billion) Projection, By Service Model 2021 to 2036
Figure 180: Latin America Linen Supply & Management Services Market Incremental Opportunities (USD Billion) Forecast, By Service Model 2026 to 2036
Figure 181: Latin America Linen Supply & Management Services Market Value (USD Billion) Projection, By Linen Category 2021 to 2036
Figure 182: Latin America Linen Supply & Management Services Market Incremental Opportunities (USD Billion) Forecast, By Linen Category 2026 to 2036
Figure 183: Latin America Linen Supply & Management Services Market Value (USD Billion) Projection, By Customer Ownership Model 2021 to 2036
Figure 184: Latin America Linen Supply & Management Services Market Incremental Opportunities (USD Billion) Forecast, By Customer Ownership Model 2026 to 2036
Figure 185: Latin America Linen Supply & Management Services Market Value (USD Billion) Projection, By End-use Industry 2021 to 2036
Figure 186: Latin America Linen Supply & Management Services Market Incremental Opportunities (USD Billion) Forecast, By End-use Industry 2026 to 2036
Figure 187: Latin America Linen Supply & Management Services Market Value (USD Billion) Projection, By Country 2021 to 2036
Figure 188: Latin America Linen Supply & Management Services Market Incremental Opportunities (USD Billion) Forecast, By Country 2026 to 2036
Figure 189: Brazil Linen Supply & Management Services Market Value (USD Billion) Projection, By Service Model 2021 to 2036
Figure 190: Brazil Linen Supply & Management Services Market Incremental Opportunities (USD Billion) Forecast, By Service Model 2026 to 2036
Figure 191: Brazil Linen Supply & Management Services Market Value (USD Billion) Projection, By Linen Category 2021 to 2036
Figure 192: Brazil Linen Supply & Management Services Market Incremental Opportunities (USD Billion) Forecast, By Linen Category 2026 to 2036
Figure 193: Brazil Linen Supply & Management Services Market Value (USD Billion) Projection, By Customer Ownership Model 2021 to 2036
Figure 194: Brazil Linen Supply & Management Services Market Incremental Opportunities (USD Billion) Forecast, By Customer Ownership Model 2026 to 2036
Figure 195: Brazil Linen Supply & Management Services Market Value (USD Billion) Projection, By End-use Industry 2021 to 2036
Figure 196: Brazil Linen Supply & Management Services Market Incremental Opportunities (USD Billion) Forecast, By End-use Industry 2026 to 2036
Figure 197: Mexico Linen Supply & Management Services Market Value (USD Billion) Projection, By Service Model 2021 to 2036
Figure 198: Mexico Linen Supply & Management Services Market Incremental Opportunities (USD Billion) Forecast, By Service Model 2026 to 2036
Figure 199: Mexico Linen Supply & Management Services Market Value (USD Billion) Projection, By Linen Category 2021 to 2036
Figure 200: Mexico Linen Supply & Management Services Market Incremental Opportunities (USD Billion) Forecast, By Linen Category 2026 to 2036
Figure 201: Mexico Linen Supply & Management Services Market Value (USD Billion) Projection, By Customer Ownership Model 2021 to 2036
Figure 202: Mexico Linen Supply & Management Services Market Incremental Opportunities (USD Billion) Forecast, By Customer Ownership Model 2026 to 2036
Figure 203: Mexico Linen Supply & Management Services Market Value (USD Billion) Projection, By End-use Industry 2021 to 2036
Figure 204: Mexico Linen Supply & Management Services Market Incremental Opportunities (USD Billion) Forecast, By End-use Industry 2026 to 2036
Figure 205: Argentina Linen Supply & Management Services Market Value (USD Billion) Projection, By Service Model 2021 to 2036
Figure 206: Argentina Linen Supply & Management Services Market Incremental Opportunities (USD Billion) Forecast, By Service Model 2026 to 2036
Figure 207: Argentina Linen Supply & Management Services Market Value (USD Billion) Projection, By Linen Category 2021 to 2036
Figure 208: Argentina Linen Supply & Management Services Market Incremental Opportunities (USD Billion) Forecast, By Linen Category 2026 to 2036
Figure 209: Argentina Linen Supply & Management Services Market Value (USD Billion) Projection, By Customer Ownership Model 2021 to 2036
Figure 210: Argentina Linen Supply & Management Services Market Incremental Opportunities (USD Billion) Forecast, By Customer Ownership Model 2026 to 2036
Figure 211: Argentina Linen Supply & Management Services Market Value (USD Billion) Projection, By End-use Industry 2021 to 2036
Figure 212: Argentina Linen Supply & Management Services Market Incremental Opportunities (USD Billion) Forecast, By End-use Industry 2026 to 2036
Copyright © Transparency Market Research, Inc. All Rights reserved
Trust Online


Linen Supply & Management Services Market
