
Reports
Reports
Gene therapies, intelligent drug discovery, telemedicine, and the likes are bringing about a change in the life sciences BPO market. Companies in the market for life sciences BPO are innovating through AI and machine learning (ML) for drug discovery. For instance, in June 2019, Navitas Life Sciences— a company that delivers platform-driven clinical solutions and services, announced to partner with ThoughtSphere— a cloud-based clinical data hub and analytics SaaS company, to use AI and ML in order to deliver unparalleled data collection.
The life sciences BPO market is estimated to grow at a favorable CAGR of 7.9% during the forecast period. Companies in the market landscape are increasing their efficiency to develop analytical platforms that offer best-in-class clinical data oversight and actionable insights for faster decision making. Companies in the market for life sciences BPO are using the advantages of AI and ML to deliver improved data collection, while significantly reducing costs involved with mapping highly complex studies.
Pharmacovigilance (PV) is shaping the future of the life sciences BPO market. This explains why the revenue of contract research organizations is predicted for aggressive growth during the forecast period and the life sciences BPO market is expected to reach a value of US$ 419.6 Bn by the end of 2027. Pharmaceutical companies in market for life sciences BPO are increasing their R&D activities and clinical trials to ensure drug safety in a patient-centric and digital era where companies are introducing innovative mechanisms to avoid adverse events following a drug’s launch.
Pharmaceutical firms are increasing efforts to engage with patients who are willingly taking ownership of their health outcomes. The life sciences BPO market is witnessing a wave of transformation, as PV is evolving from a regulation-driven, transactional exercise to a more proactive and intelligent model. Such transformations are forming an integral part of the clinical and R&D lifecycle of pharma companies.
The life sciences BPO market is largely fragmented with 10 key players accounting for ~54% of the market share. This indicates that new entrants and startups are giving a tough competition to leading players. Hence, there is a growing need for strategic alliances between big companies and startups to address challenges in the market for life sciences BPO.
As suggested by the Everest Group-a Texas-based management consulting and research firm, as big companies join forces with new entrants, they can cohesively tackle challenges of stagnating growth and stringent regulations with next-gen technology tenets such cognitive computing to improve operational efficiency.
Blockchain and serialization techniques are addressing the issues of counterfeit drugs in the market for life sciences BPO. Several drivers such as data management and virtual trials are offering a big-picture view of clinical results and are speeding up go/no-go decisions. Growing awareness about investments in specialist therapies and personalized medicines are triggering market growth.
The robotic process automation (RPA) technology is sweeping the life sciences BPO market. Outsourcing repetitive tasks and manual processes using the RPA technology is anticipated to become increasingly mainstream in developing economies of Asia Pacific. Apart from Asia Pacific, this market in both North America and Europe is estimated to witness growth in terms of revenue during the forecast period. Thus, the RPA technology is expected to generate incremental opportunities for companies in the life sciences BPO market.
The life sciences industry is in its transformative stage where there is a growing need for effective medicines and personalized digital therapeutics that improve quality of life in patients. Hence, companies in the market for life sciences BPO are increasing their focus in the RPA technology and other software robots to provide cognitive automation in medical drug research. Intelligent RPA is helping companies to address patient-centricity and eliminating manual processes. Moreover, AI and ML are helping to optimize processes, streamline costs, and improve care outcomes.
Analysts’ Viewpoint
Next-gen technologies such as AI and ML are the most prominent drivers for the life sciences BPO market. Data-driven technologies are offering biopharma and medtech organizations with actionable insights and helping them to automate mundane tasks. The recent outbreak of COVID-19 is another key driver generating value-grab opportunities for CROs.
Companies are developing platforms with workflow-enabled issue management that helps clients to lower risks of associated with clinical trials. However, challenges such as the need to rethink customer experience and compliance with industry standards poses as a barrier for market growth. Hence, companies should aim toward blockchain-powered applications to enhance compliance and improve consumer experience.
Life sciences BPO market to reach a value of US$ 419.6 Bn by the end of 2027
Life sciences BPO market is estimated to grow at a favorable CAGR of 7.9% during 2019 - 2027
Life sciences BPO market is driven by rise in demand for low cost drugs and patent expirations
The contract manufacturing organizations segment dominated the global life sciences BPO market
Key players in the global life sciences BPO market include IQVIA, Laboratory Corporation of America Holdings, Syneos Health, Inc., Parexel International Corporation, PRA Health Sciences, Inc.
1. Preface
1.1. Market Definition and Scope
1.2. Market Segmentation
1.3. Key Research Objectives
1.4. Research Highlights
2. Assumptions and Research Methodology
3. Executive Summary: Global Life Sciences BPO Market
4. Market Overview
4.1. Introduction
4.1.1. Industry Evolution/ Developments
4.2. Overview
4.3. Market Dynamics
4.3.1. Drivers
4.3.2. Restraints
4.4. Global Life Sciences BPO Market Analysis and Forecast, 2017–2027
5. Market Outlook
5.1. List of Key market players in CMO and CRO
5.2. Regulatory Scenario, by Region/Global
5.3. Global Clinical Trials Analysis
5.4. Key Mergers & Acquisitions
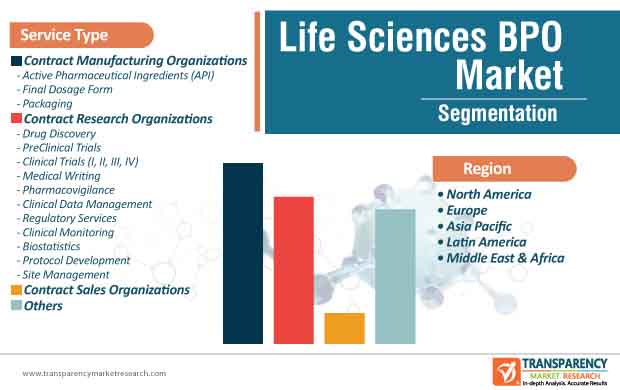
6. Global Life Sciences BPO Market Analysis and Forecast, by Service Type
6.1. Introduction & Definition
6.2. Key Findings / Developments
6.3. Market Value Forecast, by Service Type, 2017–2027
6.3.1. Contract Manufacturing Organizations
6.3.1.1. Active Pharmaceutical Ingredients
6.3.1.2. Final Dosage Form
6.3.1.3. Packaging
6.3.2. Contract Research Organizations
6.3.2.1. Drug Discovery
6.3.2.2. PreClinical Trials
6.3.2.3. Clinical Trials (I, II, III, IV)
6.3.2.4. Medical Writing
6.3.2.5. Pharmacovigilance
6.3.2.6. Clinical Data Management
6.3.2.7. Regulatory Services
6.3.2.8. Clinical Monitoring
6.3.2.9. Biostatistics
6.3.2.10. Protocol Development
6.3.2.11. Site Management
6.3.3. Contract Sales Organizations (CSO)
6.4. Market Attractiveness Analysis, by Service Type
7. Global Life Sciences BPO Market Analysis and Forecast, by Region
7.1. Key Findings / Developments
7.2. Market Value Forecast, by Region, 2017–2027
7.2.1. North America
7.2.2. Europe
7.2.3. Asia Pacific
7.2.4. Latin America
7.2.5. Middle East & Africa
7.3. Market Attractiveness Analysis, by Region
8. North America Life Sciences BPO Market Analysis and Forecast
8.1. Key Findings
8.2. Market Value Forecast, by Service Type, 2017–2027
8.2.1. Contract Manufacturing Organizations
8.2.1.1. Active Pharmaceutical Ingredients
8.2.1.2. Final Dosage Form
8.2.1.3. Packaging
8.2.2. Contract Research Organizations
8.2.2.1. Drug Discovery
8.2.2.2. PreClinical Trials
8.2.2.3. Clinical Trials (I, II, III, IV)
8.2.2.4. Medical Writing
8.2.2.5. Pharmacovigilance
8.2.2.6. Clinical Data Management
8.2.2.7. Regulatory Services
8.2.2.8. Clinical Monitoring
8.2.2.9. Biostatistics
8.2.2.10. Protocol Development
8.2.2.11. Site Management
8.2.3. Contract Sales Organizations (CSO)
8.3. Market Value Forecast, by Country, 2017–2027
8.3.1. U.S.
8.3.2. Canada
8.4. Market Attractiveness Analysis
8.4.1. By Service Type
8.4.2. By Country
9. Europe Life Sciences BPO Market Analysis and Forecast
9.1. Key Findings
9.2. Market Value Forecast, by Service Type, 2017–2027
9.2.1. Contract Manufacturing Organizations
9.2.1.1. Active Pharmaceutical Ingredients
9.2.1.2. Final Dosage Form
9.2.1.3. Packaging
9.2.2. Contract Research Organizations
9.2.2.1. Drug Discovery
9.2.2.2. PreClinical Trials
9.2.2.3. Clinical Trials (I, II, III, IV)
9.2.2.4. Medical Writing
9.2.2.5. Pharmacovigilance
9.2.2.6. Clinical Data Management
9.2.2.7. Regulatory Services
9.2.2.8. Clinical Monitoring
9.2.2.9. Biostatistics
9.2.2.10. Protocol Development
9.2.2.11. Site Management
9.2.3. Contract Sales Organizations (CSO)Market Value Forecast, 2017–2027
9.3. Market Attractiveness Analysis, by Country/Sub-region, 2017–2027
9.3.1. Germany
9.3.2. U.K.
9.3.3. France
9.3.4. Italy
9.3.5. Spain
9.3.6. Rest of Europe
9.4. Market Attractiveness Analysis
9.4.1. By Service Type
9.4.2. By Country/Sub-region
10. Asia Pacific Life Sciences BPO Market Analysis and Forecast
10.1. Key Findings
10.2. Market Value Forecast, by Service Type, 2017–2027
10.2.1. Contract Manufacturing Organizations
10.2.1.1. Active Pharmaceutical Ingredients
10.2.1.2. Final Dosage Form
10.2.1.3. Packaging
10.2.2. Contract Research Organizations
10.2.2.1. Drug Discovery
10.2.2.2. PreClinical Trials
10.2.2.3. Clinical Trials (I, II, III, IV)
10.2.2.4. Medical Writing
10.2.2.5. Pharmacovigilance
10.2.2.6. Clinical Data Management
10.2.2.7. Regulatory Services
10.2.2.8. Clinical Monitoring
10.2.2.9. Biostatistics
10.2.2.10. Protocol Development
10.2.2.11. Site Management
10.2.3. Contract Sales Organizations (CSO)Market Value Forecast, 2017–2027
10.3. Market Attractiveness Analysis, by Country/Sub-region, 2017–2027
10.3.1. Australia & New Zealand
10.3.2. Japan
10.3.3. China
10.3.4. India
10.3.5. Rest of Asia Pacific
10.4. Market Attractiveness Analysis
10.4.1. By Service Type
10.4.2. By Country/Sub-region
11. Latin America Life Sciences BPO Market Analysis and Forecast
11.1. Key Findings
11.2. Market Value Forecast, by Service Type, 2017–2027
11.2.1. Contract Manufacturing Organizations
11.2.1.1. Active Pharmaceutical Ingredients
11.2.1.2. Final Dosage Form
11.2.1.3. Packaging
11.2.2. Contract Research Organizations
11.2.2.1. Drug Discovery
11.2.2.2. PreClinical Trials
11.2.2.3. Clinical Trials (I, II, III, IV)
11.2.2.4. Medical Writing
11.2.2.5. Pharmacovigilance
11.2.2.6. Clinical Data Management
11.2.2.7. Regulatory Services
11.2.2.8. Clinical Monitoring
11.2.2.9. Biostatistics
11.2.2.10. Protocol Development
11.2.2.11. Site Management
11.2.3. Contract Sales Organizations (CSO)Market Value Forecast, 2017–2027
11.3. Market Attractiveness Analysis, by Country/Sub-region, 2017–2027
11.3.1. Brazil
11.3.2. Mexico
11.3.3. Rest of Latin America
11.4. Market Attractiveness Analysis
11.4.1. By Service Type
11.4.2. By Country/Sub-region
12. Middle East & Africa Life Sciences BPO Market Analysis and Forecast
12.1. Key Findings
12.2. Market Value Forecast, by Service Type, 2017–2027
12.2.1. Contract Manufacturing Organizations
12.2.1.1. Active Pharmaceutical Ingredients
12.2.1.2. Final Dosage Form
12.2.1.3. Packaging
12.2.2. Contract Research Organizations
12.2.2.1. Drug Discovery
12.2.2.2. PreClinical Trials
12.2.2.3. Clinical Trials (I, II, III, IV)
12.2.2.4. Medical Writing
12.2.2.5. Pharmacovigilance
12.2.2.6. Clinical Data Management
12.2.2.7. Regulatory Services
12.2.2.8. Clinical Monitoring
12.2.2.9. Biostatistics
12.2.2.10. Protocol Development
12.2.2.11. Site Management
12.2.3. Contract Sales Organizations (CSO) Market Value Forecast, 2017–2027
12.3. Market Attractiveness Analysis, by Country/Sub-region, 2017–2027
12.3.1. GCC Countries
12.3.2. South Africa
12.3.3. Rest of Middle East & Africa
12.4. Market Attractiveness Analysis
12.4.1. By Service Type
12.4.2. By Country/Sub-region
13. Competition Landscape
13.1. Market Share Analysis, by Company, 2018
13.2. Company Profiles
13.2.1. Laboratory Corporation of America Holdings
13.2.1.1. Company Overview
13.2.1.2. Company Financials
13.2.1.3. Growth Strategies
13.2.1.4. SWOT Analysis
13.2.2. IQVIA, Inc.
13.2.2.1. Company Overview
13.2.2.2. Company Financials
13.2.2.3. Growth Strategies
13.2.2.4. SWOT Analysis
13.2.3. Syneos Health, Inc.
13.2.3.1. Company Overview
13.2.3.2. Company Financials
13.2.3.3. Growth Strategies
13.2.3.4. SWOT Analysis
13.2.4. Parexel International Corporation
13.2.4.1. Company Overview
13.2.4.2. Company Financials
13.2.4.3. Growth Strategies
13.2.4.4. SWOT Analysis
13.2.5. PRA Health Sciences, Inc.
13.2.5.1. Company Overview
13.2.5.2. Company Financials
13.2.5.3. Growth Strategies
13.2.5.4. SWOT Analysis
13.2.6. Charles River Laboratories International, Inc.
13.2.6.1. Company Overview
13.2.6.2. Company Financials
13.2.6.3. Growth Strategies
13.2.6.4. SWOT Analysis
13.2.7. WuXi AppTec Co., Ltd.
13.2.7.1. Company Overview
13.2.7.2. Company Financials
13.2.7.3. Growth Strategies
13.2.7.4. SWOT Analysis
13.2.8. ICON plc
13.2.8.1. Company Overview
13.2.8.2. Company Financials
13.2.8.3. Growth Strategies
13.2.8.4. SWOT Analysis
13.2.9. Medpace Holdings, Inc.
13.2.9.1. Company Overview
13.2.9.2. Company Financials
13.2.9.3. Growth Strategies
13.2.9.4. SWOT Analysis
13.2.10. Pharmaceutical Product Development, LLC.
13.2.10.1. Company Overview
13.2.10.2. Company Financials
13.2.10.3. Growth Strategies
13.2.10.4. SWOT Analysis
List of Tables
Table 01: CROs - Heat Map Analysis
Table 02: CROs - Business Models
Table 03: Global Life Sciences BPO Market Value (US$ Bn) Forecast, by Service Type, 2017–2027
Table 04: Global Life Sciences BPO Market Value (US$ Bn) Forecast, by Contract Manufacturing Organizations (CMO), 2017–2027
Table 05: Global Life Sciences BPO Market Value (US$ Bn) Forecast, by Contract Research Organizations (CRO), 2017–2027
Table 06: Global Life Sciences BPO Market Value (US$ Bn) Forecast, by Region, 2017–2027
Table 07: North America Life Sciences BPO Market Value (US$ Bn) Forecast, by Country, 2017–2027
Table 08: North America Life Sciences BPO Market Value (US$ Bn) Forecast, by Service Type, 2017–2027
Table 09: North America Life Sciences BPO Market Value (US$ Bn) Forecast, by Contract Manufacturing Organizations (CMO), 2017–2027
Table 10: North America Life Sciences BPO Market Value (US$ Bn) Forecast, by Contract Research Organizations (CRO), 2017–2027
Table 11: Europe Life Sciences BPO Market Value (US$ Bn) Forecast, by Country/Sub-region, 2017–2027
Table 12: Europe Life Sciences BPO Market Value (US$ Bn) Forecast, by Service Type, 2017–2027
Table 13: Europe Life Sciences BPO Market Value (US$ Bn) Forecast, by Contract Manufacturing Organizations (CMO), 2017–2027
Table 14: Europe Life Sciences BPO Market Value (US$ Bn) Forecast, by Contract Research Organizations (CRO), 2017–2027
Table 15: Asia Pacific Life Sciences BPO Market Value (US$ Bn) Forecast, by Country/Sub-region, 2017–2027
Table 16: Asia Pacific Life Sciences BPO Market Value (US$ Bn) Forecast, by Service Type, 2017–2027
Table 17: Asia Pacific Life Sciences BPO Market Value (US$ Bn) Forecast, by Contract Manufacturing Organizations (CMO), 2017–2027
Table 18: Asia Pacific Life Sciences BPO Market Value (US$ Bn) Forecast, by Contract Research Organizations (CRO), 2017–2027
Table 19: Latin America Life Sciences BPO Market Value (US$ Bn) Forecast, by Country, 2017–2027
Table 20: Latin America Life Sciences BPO Market Value (US$ Bn) Forecast, by Service Type, 2017–2027
Table 21: Latin America Life Sciences BPO Market Value (US$ Bn) Forecast, by Contract Manufacturing Organizations (CMO), 2017–2027
Table 22: Latin America Life Sciences BPO Market Value (US$ Bn) Forecast, by Contract Research Organizations (CRO), 2017–2027
Table 23: Middle East & Africa Life Sciences BPO Market Value (US$ Bn) Forecast, by Country/Sub-region, 2017–2027
Table 24: Middle East & Africa Life Sciences BPO Market Value (US$ Bn) Forecast, by Service Type, 2017–2027
Table 25: Middle East & Africa Life Sciences BPO Market Value (US$ Bn) Forecast, by Contract Manufacturing Organizations (CMO), 2017–2027
Table 26: Middle East & Africa Life Sciences BPO Market Value (US$ Mn) Forecast, by Contract Research Organizations (CRO), 2017–2027
List of Figures
Figure 01: Healthcare Contract Research Outsourcing Market Snapshot
Figure 02: Global Life Sciences BPO Services Market Value (US$ Bn) and Distribution (%), by Region, 2019 and 2027
Figure 03: Global Life Sciences BPO Market Value (US$ Bn) Forecast, 2017–2027
Figure 04: Global Life Sciences BPO Market Value Share (%), by Service Type, 2018
Figure 05: Global Life Sciences BPO Market Value Share (%), by Therapeutic Indication, 2018
Figure 06: Global Life Sciences BPO Market Value Share (%), by End-user, 2018
Figure 07: Global Life Sciences BPO Market Value Share (%), by Region, 2018
Figure 08: Regulatory Scenario - North America
Figure 09: Regulatory Scenario - Europe
Figure 10: Regulatory Scenario - Asia Pacific
Figure 11: Number of Registered Studies, by Location
Figure 12: Number of Registered Studies, by Intervention
Figure 13: Life Sciences BPO Market - Key Mergers and Acquisitions
Figure 14: CROs- Pricing Strategies
Figure 15: Key Strategies - Laboratory Corporation of America Holdings (LabCorp)
Figure 16: Key Strategies - IQVIA
Figure 17: Global Life Sciences BPO Market Value Share Analysis, by Service Type, 2018 and 2027
Figure 18: Global Life Sciences BPO Market Attractiveness Analysis, by Service Type, 2019?2027
Figure 19: Global Life Sciences BPO Market Value Share Analysis, by CMO, 2018 and 2027
Figure 20: Global Life Sciences BPO Market Attractiveness Analysis, by CMO, 2019?2027
Figure 21: Global Life Sciences BPO Market Attractiveness Analysis, by CRO, 2019?2027
Figure 22: Global Life Sciences BPO Market Attractiveness Analysis, by CRO, 2019?2027
Figure 23: Global Life Sciences BPO Market Value (US$ Bn) and Forecast, by Contract Manufacturing Organizations (CMO), 2017–2027
Figure 24: Global Life Sciences BPO Market Value (US$ Bn) and Forecast, by Contract Research Organizations (CRO), 2017–2027
Figure 25: Global Life Sciences BPO Market Value (US$ Bn) and Forecast, by Contract Sales Organizations (CSO), 2017–2027
Figure 26: Global Life Sciences BPO Market Value (US$ Bn) and Forecast, by Consulting Services, 2017–2027
Figure 27: Global Life Sciences BPO Market Value (US$ Bn) and Forecast, by Active Pharmaceutical Ingredient (API), 2017–2027
Figure 28: Global Life Sciences BPO Market Value (US$ Bn) and Forecast, by Final Dosage Form (FDF) Manufacturing, 2017–2027
Figure 29: Global Life Sciences BPO Market Value (US$ Bn) and Forecast, by Packaging, 2017–2027
Figure 30: Global Life Sciences BPO Market Value (US$ Bn) and Forecast, by Drug Discovery, 2017–2027
Figure 31: Global Life Sciences BPO Market Value (US$ Bn) and Forecast, by PreClinical Trials, 2017–2027
Figure 32: Global Life Sciences BPO Market Value (US$ Bn) and Forecast, by Clinical Trials (I, II, III, IV), 2017–2027
Figure 33: Global Life Sciences BPO Market Value (US$ Bn) and Forecast, by Medical Writing, 2017–2027
Figure 34: Global Life Sciences BPO Market Value (US$ Bn) and Forecast, by Pharmacovigilance, 2017–2027
Figure 35: Global Life Sciences BPO Market Value (US$ Bn) and Forecast, by Clinical Data Management, 2017–2027
Figure 36: Global Life Sciences BPO Market Value (US$ Bn) and Forecast, by Regulatory Services, 2017–2027
Figure 37: Global Life Sciences BPO Market Value (US$ Bn) and Forecast, by Clinical Monitoring, 2017–2027
Figure 38: Global Life Sciences BPO Market Value (US$ Bn) and Forecast, by Biostatistics, 2017–2027
Figure 39: Global Life Sciences BPO Market Value (US$ Bn) and Forecast, by Protocol Development, 2017–2027
Figure 40: Global Life Sciences BPO Market Value (US$ Bn) and Forecast, by Site management, 2017–2027
Figure 41: Life Sciences BPO Market: Regional Outlook
Figure 42: Global Life Sciences BPO Market Value (US$ Bn) Forecast, 2017–2027
Figure 43: Global Life Sciences BPO Market Value Share Analysis, by Region, 2018 and 2027
Figure 44: Global Life Sciences BPO Market Attractiveness Analysis, by Region, 2019-2027
Figure 45: North America Life Sciences BPO Market Value (US$ Bn) Forecast, 2017–2027
Figure 46: North America Life Sciences BPO Market Attractiveness Analysis, by Country, 2019–2027
Figure 47: North America Life Sciences BPO Market Value Share Analysis, by Country, 2018 and 2027
Figure 48: North America Life Sciences BPO Market Value Share Analysis, by Service Type, 2018 and 2027
Figure 49: North America Life Sciences BPO Market Attractiveness Analysis, by Service Type, 2019?2027
Figure 50: Europe Life Sciences BPO Market Value (US$ Bn) Forecast, 2017–2027
Figure 51: Europe Life Sciences BPO Market Attractiveness Analysis, by Country, 2019–2027
Figure 52: Europe Life Sciences BPO Market Value Share Analysis, by Country/Sub-region, 2018 and 2027
Figure 53: Europe Life Sciences BPO Market Value Share Analysis, by Service Type, 2018 and 2027
Figure 54: Europe Life Sciences BPO Market Attractiveness Analysis, by Service Type, 2019?2027
Figure 55: Asia Pacific Life Sciences BPO Market Value (US$ Bn) Forecast, 2017–2027
Figure 56: Asia Pacific Life Sciences BPO Market Attractiveness Analysis, by Country, 2019–2027
Figure 57: Asia Pacific Life Sciences BPO Market Value Share Analysis, by Country/Sub-region, 2018 and 2027
Figure 58: Asia Pacific Life Sciences BPO Market Value Share Analysis, by Service Type, 2018 and 2027
Figure 59: Asia Pacific Life Sciences BPO Market Attractiveness Analysis, by Service Type, 2019?2027
Figure 60: Latin America Life Sciences BPO Market Value (US$ Bn) Forecast, 2017–2027
Figure 61: Latin America Life Sciences BPO Market Attractiveness Analysis, by Country, 2019–2027
Figure 62: Latin America Life Sciences BPO Market Value Share Analysis, by Country/Sub-region, 2018 and 2027
Figure 63: Latin America Life Sciences BPO Market Value Share Analysis, by Service Type, 2018 and 2027
Figure 64: Latin America Life Sciences BPO Market Attractiveness Analysis, by Service Type, 2019?2027
Figure 65: Middle East & Africa Life Sciences BPO Market Value (US$ Bn) Forecast, 2017–2027
Figure 66: Middle East & Africa Life Sciences BPO Market Attractiveness Analysis, by Country/Sub-region, 2019–2027
Figure 67: Middle East & Africa Life Sciences BPO Market Value Share Analysis, by Country/Sub-region, 2018 and 2027
Figure 68: Middle East & Africa Life Sciences BPO Market Value Share Analysis, by Service Type, 2018 and 2027
Figure 69: Middle East & Africa Life Sciences BPO Market Attractiveness Analysis, by Service Type, 2019?2027
Figure 70: Global Life Sciences BPO Market Share, by Company, 2018
Figure 71: Laboratory Corporation of America Holdings Revenue (US$ Mn) and Y-o-Y Growth (%), 2016–2018
Figure 72: Laboratory Corporation of America Holdings Breakdown of Net Sales (%), by Geography, 2018
Figure 73: Laboratory Corporation of America Holdings Breakdown of Net Sales (%), by Business Segment, 2018
Figure 74: Laboratory Corporation of America Holdings Selling, General and Administrative Expenses (US$ Mn), 2017 and 2018
Figure 75: IQVIA, Inc. Revenue (US$ Mn) and Y-o-Y Growth (%), 2014–2018
Figure 76: IQVIA, Inc. Breakdown of Net Sales (%), by Region, 2018
Figure 77: IQVIA, Inc. Breakdown of Net Sales (%), by Business Segment, 2018
Figure 78: IQVIA, Inc. Selling, General and Administrative Expenses (US$ Mn), 2017 and 2018
Figure 79: Syneos Health, Inc. Revenue (US$ Mn) and Y-o-Y Growth (%), 2014–2018
Figure 80: Syneos Health, Inc. Breakdown of Net Sales (%), by Region, 2018
Figure 81: Syneos Health, Inc. Breakdown of Net Sales (%), by Business Segment, 2018
Figure 82: Syneos Health, Inc. Selling, General and Administrative Expenses (US$ Mn), 2017 and 2018
Figure 83: PRA Health Sciences, Inc. Revenue (US$ Mn) and Y-o-Y Growth (%), 2014–2018
Figure 84: PRA Health Sciences, Inc. Breakdown of Net Sales (%), by Region, 2018
Figure 85: PRA Health Sciences, Inc. Breakdown of Net Sales (%), by Business Segment, 2018
Figure 86: PRA Health Sciences, Inc. Selling, general and administrative Cost (US$ Mn), 2017 and 2018
Figure 87: Charles River Laboratories International, Inc. Revenue (US$ Mn) and Y-o-Y Growth (%), 2012–2018
Figure 88: Charles River Laboratories International, Inc. Breakdown of Net Sales (%), by Business Segment, 2018
Figure 89: Charles River Laboratories International, Inc. Breakdown of Net Sales (%) by Products & Services, 2016
Figure 90: WuXi AppTec Co., Ltd. Revenue (US$ Mn) and Y-o-Y Growth (%), 2015–2018
Figure 91: WuXi AppTec Co., Ltd. Breakdown of Net Sales (%), by Segment, 2018
Figure 92: WuXi AppTec Co., Ltd. Breakdown of Net Sales (%), by Geography, 2018
Figure 93: ICON PLC Revenue (US$ Mn) and Y-o-Y Growth (%), 2014–2018
Figure 94: ICON plc Breakdown of Operating Expenses, 2014–2018 (US$ Mn)
Figure 95: ICON plc Breakdown of Net Sales (%), by Geography, 2018
Figure 96: Medpace Holdings, Inc. Revenue (US$ Mn) and Y-o-Y Growth (%), 2015–2018
Figure 97: Medpace Holdings, Inc. Breakdown of Operating Expenses (US$ Mn), 2017–2018
Figure 98: Medpace Holdings, Inc. Breakdown of Net Revenues (%), by Category, 2018
Figure 99: Medpace Holdings, Inc. Breakdown of Net Service Revenues (%), by Geography, 2018
Copyright © Transparency Market Research, Inc. All Rights reserved
Trust Online

Life Sciences BPO Market