
Reports
Reports
Global Digital Therapeutic Devices Market: Snapshot
In a highly competitive global digital therapeutic devices market, savvy players are focused on collaborations and partnerships to improve their technical expertise for competitive gains. Established players are also tapping into the emerging economies of Asia Pacific that have vast growth potential in the digital therapeutic devices space.
The global digital therapeutic devices market is primarily driven by the rising use of technology for treating medical conditions. The demand for technologically advanced products for treating medical conditions coupled with rising disposable incomes is positively influencing the global digital therapeutic devices market. Several governments are also supporting the adoption of digital therapeutic devices that marks a significant change from traditional healthcare practices.
On the downside, the high price factor and risk of data breach are slowing the adoption of digital therapeutic devices.
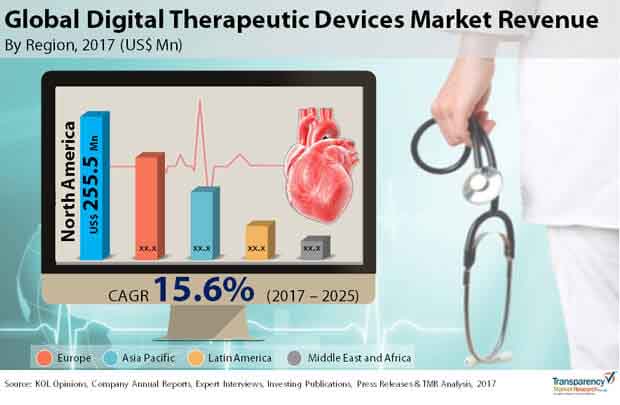
According to projections by Transparency Market Research (TMR), the global digital therapeutic devices market will expand at impressive CAGR of 15.6% during the 2017-2025 forecast period. At this pace, the market will attract a revenue valuation of US$2,082.3 mn by the end of 2025 from US$590.8 mn in 2016.
Treatment/Care Application Segment to Remain Attractive through 2025
Based on product, the global digital therapeutic devices market has been segmented into pain management devices, respiratory therapy devices, rehabilitation devices, and insulin pumps. Among them, the segment of insulin pumps constituted the leading market share in 2016 due to the increasing prevalence of diabetes. In terms of application, the digital therapeutic devices market has been segmented into preventive and treatment/care. Of the two, treatment/care is anticipated to hold the leading share and display a significant growth rate over the forecast period.
The segments of the global digital therapeutic devices market depending upon end user are B2C and B2B. While B2C is further segmented into patients and caregivers, B2B is sub-segmented into providers, payers, employers, pharmaceutical companies, and others. B2B held the leading market share in 2016 on the back of increasing adoption of digital therapeutic devices by employers and health insurance companies for ease of processing medical claims.
Popularity of Growth Funding Initiatives Make North America Leader
Geographically, the report gauges the potential of digital therapeutic devices market in the regions of North America, Asia Pacific, Europe, Latin America, and the Middle East and Africa. In 2016, North America accounted for the leading share in the global digital therapeutic devices market. The early adoption of technology coupled with increasing investment in digital therapeutic devices companies through government funding, venture capitalists, and mergers and acquisitions are supporting the growth of this regional market. For example, in March 2017, Livongo Health – the developer of an app for diabetes management and the developer of a cellular-connected blood glucose meter raised US$52.5 million by growth funding.
The Europe market for digital therapeutic devices market is predominantly led by Germany, France, Spain, the U.K., and Italy. Amongst them, the U.K. and Germany constituted the leading share in this regional market. Increasing prevalence of chronic diseases such as cancer, diabetes, and obesity and government initiatives for adoption of technology for treating medical conditions are contributing to the growth of Europe digital therapeutic devices market.
However, Asia Pacific is expected to display the leading growth rate over the forecast period. Increasing penetration of smartphone and government initiatives to promote the adoption of technology for treating medical conditions is likely to propel the growth of this regional market.
Leading companies in the global digital therapeutic devices market include Proteus Digital Health, WellDoc Inc., Noom Inc., Propeller Health, BiogeniQ Inc., Claritas MindSciences, Jintronix Inc., Zest Health LLC, HealthMine Inc., BioTelemetry Inc., Digital Twine health Inc., Firstbeat Technologies Ltd, Big Health, Dthera Sciences, Virta Health Corp, Pear Therapeutics Inc., Blue Mesa, Meru Health Inc., Canary Health, Glooko Inc., Nanobiosys Inc., Digital Therapeutics, Omada Health Inc., Ginger. Io Inc., Livongo Health, and 2Morrow Inc.
Efficacy for treatment of host of Medical Conditions boosts Digital Therapeutic Devices Market
Exponential rise in demand for technologically advanced medical services is creating opportunities in the digital therapeutic devices market. Digital therapeutic devices are available for a host of medical conditions with a product range, which includes pain management devices, rehabilitation devices, respiratory therapy devices, and insulin pumps. Among them, insulin pumps accounts for leading share in the digital therapeutic devices market.
Rising burden on healthcare institutions to serve large number of patients with chronic conditions is resulting in adoption of digital therapeutic devices. The use of digital therapeutic devices reduces dependency on human personnel to provide medical care through the course of treatment.
Emergence of super specialty and multispecialty healthcare institutions in developing countries is boosting the digital therapeutic devices market. Due to substantial funding from private trusts that run these healthcare institutions, these institutions are usually equipped with technologically advanced medical devices and boast state-of-the-art infrastructure. This indirectly fuels the digital therapeutic devices market.
Digital therapeutic devices are primarily used for preventive care and for treatment purpose. Of the two, treatment application segment holds larger share in the digital therapeutic devices market. Meanwhile, digital therapeutic devices find use for B2B and B2C end-use segments; the former is sub-segmented into providers, employers, payers, pharmaceutical companies, and others, and the latter is divided into patients and caregivers.
North America is the leading region among other key regions in the digital therapeutic devices. Early adoption of technology and increasing investment of governments for adoption of digital therapeutic devices in public healthcare institutions is favorable to the digital therapeutic devices market in the region. The region being home to some large players in the digital therapeutic devices market that are engaged in R&D and business collaborations further creates opportunities in the digital therapeutic devices market in North America.
Powered by the U.K. and Germany, Europe holds significant share in the digital therapeutic devices market.
Section 1 Preface
1.1 Report Scope and Market Segmentation
1.2 Research Highlights
Section 2 Assumptions and Research Methodology
2.1 Research Methodology
Section 3 Executive Summary
3.1 Global Digital Therapeutic Devices Market Snapshot
3.2 Global Digital Therapeutic Devices Market Size ($ Mn) and Distribution, by Geography, 2017 and 2025
Section 4 Market Overview
4.1 Overview
4.2 Global Digital Therapeutic Devices Market: Porter's Analysis
4.3 Global Digital Therapeutic Devices Market Size (US$ Mn) Forecast, 2015–2025
4.4 Global Digital Therapeutic Devices Market Outlook
Section 5 Market Dynamic
5.1 Drivers
5.1.1 Increasing Government Initiatives
5.1.2 Strategic Acquisitions enable Product Distribution in Other Regions, and also strengthening their Presence
5.1.3 Rising incidence of Diabetes, Cardiovascular Diseases and other Chronic Diseases
5.1.4 Increasing Collaborations between Companies for Technological Advancements
5.1.5 Increasing Adoption of Digital Therapeutic Devices Product by Health Care Providers
5.2 Restrains
5.2.1 High Costs Associated with Installation
5.2.2 Cyber Threat
5.3 Opportunities
5.3.1 Adoption of cloud-based systems by health care organization and hospitals
5.3.2 Penetration of smartphones in the health care sector & increase in demand for mobile apps
5.4 Trends
5.4.1 Increasing adoption of cloud-based systems
5.4.2 Virtualization technologies and technological advancements add new dimension to health care IT
5.5 Digital Therapeutics Business, Opportunities and Entry Barriers for New Market Entrants - 2016
5.6 Qualitative Information on Business Models in Digital Therapeutic Devices Market
5.7 Traditional Business Models: Challenges to Traditional Business models
5.8 New Digital Therapeutic Devices Business Models
5.9 Adoption of Digital Therapeutic Devicescare by End-users
5.10 Impact Factors for Digital Therapeutics Demand
5.11 Global Health Care Expenditure, by Major Countries
5.12 Digital Medicine Business Model
5.13 Factors Increasing Traction of Digital Therapeutics Products
5.13.1 Health Care Costs
5.13.2 Value-based Payment Models
5.13.3 Venture Funding
5.13.4 Others
Section 6 Global Digital Therapeutic Devices Market Analysis, by Product
6.1 Introduction
6.2 Global Digital Therapeutic Devices Market Value Share Analysis, by Product
6.3 Digital Therapeutic Devices Market Analysis, by Product
6.3.1 Pain management devices
6.3.2 Rehabilitation devices
6.3.3 Respiratory therapy devices
6.3.4 Insulin Pumps
6.4 Global Digital Therapeutic Devices Market Attractiveness Analysis, by Product
Section 7 Global Digital Therapeutic Devices (Digital Therapeutic Devices) Market Analysis, by Application
7.1 Introduction
7.2 Global Digital Therapeutic Devices (Digital Therapeutic Devices) Market Value Share Analysis, by Application
7.3 Global Digital Therapeutic Devices (Digital Therapeutic Devices) Market Analysis, by Application
7.3.1 Preventive
7.3.1.1 Pre diabetes
7.3.1.2 Obesity
7.3.1.3 Smoking Cessation
7.3.1.4 Others
7.3.2 Treatment/Care
7.3.2.1 Diabetes
7.3.2.2 Cardiovascular Diseases
7.3.2.3 Central Nervous System Disease
7.3.2.4 Respiratory Diseases
7.3.2.5 Musculoskeletal Diseases
7.3.2.6 Medication Adherence
7.3.2.7 Others
Section 8 Global Digital Therapeutic Devices Market Analysis, by End-user
8.1 Introduction
8.2 Global Digital Therapeutic Devices Market Value Share Analysis, by End-user
8.3 Global Digital Therapeutic Devices Market Analysis, by End-user
8.3.1 B2C
8.3.1.1 Patients
8.3.1.2 Caregivers
8.3.2 B2B
8.3.2.1 Providers
8.3.2.2 Payers
8.3.2.3 Employers
8.3.2.4 Pharmaceutical Companies
8.3.2.5 Others
8.4 Global Digital Therapeutic Devices Market Attractiveness Analysis, by End-user
Section 9 Global Digital Therapeutic Devices Market Analysis, by Region
9.1 Global Digital Therapeutic Devices Market Snapshot, by Country
9.2 Global Digital Therapeutic Devices Market Value Share Analysis, by Region
9.3 Digital Therapeutic Devices Market Forecast, by Region
9.4 Digital Therapeutic Devices Market Attractiveness Analysis, by Region
Section 10 North America Digital Therapeutic Devices Market Analysis
10.1 Key Findings
10.2 North America Digital Therapeutic Devices Market Overview
10.3 North America Digital Therapeutic Devices Market Value Share Analysis, by Product
10.4 North America Market Size (US$ Mn) Forecast, by Product, 2017–2025
10.4.1 Pain management devices
10.4.2 Rehabilitation devices
10.4.3 Respiratory therapy devices
10.4.4 Insulin Pumps
10.5 North America Digital Therapeutic Devices (Digital Therapeutic Devices) Market Value Share Analysis, by Application
10.6 North America Market Size (US$ Mn) Forecast, by Application (Digital Therapeutic Devices) 2017–2025
10.6.1 Preventive
10.6.1.1 Pre diabetes
10.6.1.2 Obesity
10.6.1.3 Smoking Cessation
10.6.1.4 Others
10.6.2 Treatment/Care
10.6.2.1 Diabetes
10.6.2.2 Cardiovascular Diseases
10.6.2.3 Central Nervous System Disease
10.6.2.4 Respiratory Diseases
10.6.2.5 Musculoskeletal Diseases
10.6.2.6 Medication Adherence
10.6.2.7 Others
10.7 North America Digital Therapeutic Devices Market Value Share Analysis, by End-user
10.8 North America Market Size (US$ Mn) Forecast, by End-user 2017–2025
10.8.1 B2C
10.8.1.1 Patients
10.8.1.2 Caregivers
10.8.2 B2B
10.8.2.1 Providers
10.8.2.2 Payers
10.8.2.3 Employers
10.8.2.4 Pharmaceutical Companies
10.8.2.5 Others
10.9 North America Market Value Share Analysis, by Country
10.10 North America Market Size (US$ Mn) Forecast, by Country, 2017–2025
10.10.1 U.S.
10.10.2 Canada
10.11 Market Attractiveness Analysis
10.11.1 By Product
10.11.2 By Application
10.11.3 By End User
10.11.4 By Country
Section 11 Europe Digital Therapeutic Devices Market Analysis
11.1 Key Findings
11.2 Europe Digital Therapeutic Devices Market Overview
11.3 Europe Digital Therapeutic Devices Market Value Share Analysis, by Product
11.4 Europe Market Size (US$ Mn) Forecast, by Product, 2017–2025
11.4.1 Pain management devices
11.4.2 Rehabilitation devices
11.4.3 Respiratory therapy devices
11.4.4 Insulin Pumps
11.5 Europe Digital Therapeutic Devices (Digital Therapeutic Devices) Market Value Share Analysis, by Application
11.6 Europe Market Size (US$ Mn) Forecast, by Application (Digital Therapeutic Devices) 2017–2025
11.6.1 Preventive
11.6.1.1 Pre diabetes
11.6.1.2 Obesity
11.6.1.3 Smoking Cessation
11.6.1.4 Others
11.6.2 Treatment/Care
11.6.2.1 Diabetes
11.6.2.2 Cardiovascular Diseases
11.6.2.3 Central Nervous System Disease
11.6.2.4 Respiratory Diseases
11.6.2.5 Musculoskeletal Diseases
11.6.2.6 Medication Adherence
11.6.2.7 Others
11.7 Europe Digital Therapeutic Devices Market Value Share Analysis, by End-user
11.8 Europe Market Size (US$ Mn) Forecast, by End-user 2017–2025
11.8.1 B2C
11.8.1.1 Patients
11.8.1.2 Caregivers
11.8.2 B2B
11.8.2.1 Providers
11.8.2.2 Payers
11.8.2.3 Employers
11.8.2.4 Pharmaceutical Companies
11.8.2.5 Others
11.9 Europe Market Value Share Analysis, by Country
11.10 Europe Market Size (US$ Mn) Forecast, by Country, 2017–2025
11.10.1 U.K.
11.10.2 Germany
11.10.3 France
11.10.4 Italy
11.10.5 Spain
11.10.6 Rest of Europe
11.11 Market Attractiveness Analysis
11.11.1 By Product
11.11.2 By Application
11.11.3 By End User
11.11.4 By Country
Section 12 Asia Pacific Digital Therapeutic Devices Market Analysis
12.1 Key Findings
12.2 Asia Pacific Digital Therapeutic Devices Market Overview
12.3 Asia Pacific Digital Therapeutic Devices Market Value Share Analysis, by Product
12.4 Asia Pacific Market Size (US$ Mn) Forecast, by Product, 2017–2025
12.4.1 Pain management devices
12.4.2 Rehabilitation devices
12.4.3 Respiratory therapy devices
12.4.4 Insulin Pumps
12.5 Asia Pacific Digital Therapeutic Devices (Digital Therapeutic Devices) Market Value Share Analysis, by Application
12.6 Asia Pacific Market Size (US$ Mn) Forecast, by Application (Digital Therapeutic Devices) 2017–2025
12.6.1 Preventive
12.6.1.1 Pre diabetes
12.6.1.2 Obesity
12.6.1.3 Smoking Cessation
12.6.1.4 Others
12.6.2 Treatment/Care
12.6.2.1 Diabetes
12.6.2.2 Cardiovascular Diseases
12.6.2.3 Central Nervous System Disease
12.6.2.4 Respiratory Diseases
12.6.2.5 Musculoskeletal Diseases
12.6.2.6 Medication Adherence
12.6.2.7 Others
12.7 Asia Pacific Digital Therapeutic Devices Market Value Share Analysis, by End-user
12.8 Asia Pacific Market Size (US$ Mn) Forecast, by End-user 2017–2025
12.8.1 B2C
12.8.1.1 Patients
12.8.1.2 Caregivers
12.8.2 B2B
12.8.2.1 Providers
12.8.2.2 Payers
12.8.2.3 Employers
12.8.2.4 Pharmaceutical Companies
12.8.2.5 Others
12.9 Asia Pacific Market Value Share Analysis, by Country
12.10 Asia Pacific Market Size (US$ Mn) Forecast, by Country, 2017–2025
12.10.1 China
12.10.2 Japan
12.10.3 Rest of Asia Pacific
12.11 Market Attractiveness Analysis
12.11.1 By Product
12.11.2 By Application
12.11.3 By End User
12.11.4 By Country
Section 13 Latin America Digital Therapeutic Devices Market Analysis
13.1 Key Findings
13.2 Latin America Digital Therapeutic Devices Market Overview
13.3 Latin America Digital Therapeutic Devices Market Value Share Analysis, by Product
13.4 Latin America Market Size (US$ Mn) Forecast, by Product, 2017–2025
13.4.1 Pain management devices
13.4.2 Rehabilitation devices
13.4.3 Respiratory therapy devices
13.4.4 Insulin Pumps
13.5 Latin America Digital Therapeutic Devices (Digital Therapeutic Devices) Market Value Share Analysis, by Application
13.6 Latin America Market Size (US$ Mn) Forecast, by Application (Digital Therapeutic Devices) 2017–2025
13.6.1 Preventive
13.6.1.1 Pre diabetes
13.6.1.2 Obesity
13.6.1.3 Smoking Cessation
13.6.1.4 Others
13.6.2 Treatment/Care
13.6.2.1 Diabetes
13.6.2.2 Cardiovascular Diseases
13.6.2.3 Central Nervous System Disease
13.6.2.4 Respiratory Diseases
13.6.2.5 Musculoskeletal Diseases
13.6.2.6 Medication Adherence
13.6.2.7 Others
13.7 Latin America Digital Therapeutic Devices Market Value Share Analysis, by End-user
13.8 Latin America Market Size (US$ Mn) Forecast, by End-user 2017–2025
13.8.1 B2C
13.8.1.1 Patients
13.8.1.2 Caregivers
13.8.2 B2B
13.8.2.1 Providers
13.8.2.2 Payers
13.8.2.3 Employers
13.8.2.4 Pharmaceutical Companies
13.8.2.5 Others
13.9 Market Attractiveness Analysis
13.9.1 By Product
13.9.2 By Application
13.9.3 By End User
Section 14 Middle East & Africa Digital Therapeutic Devices Market Analysis
14.1 Key Findings
14.2 Middle East & Africa Digital Therapeutic Devices Market Overview
14.3 Middle East & Africa Digital Therapeutic Devices Market Value Share Analysis, by Product
14.4 Middle East & Africa Market Size (US$ Mn) Forecast, by Product, 2017–2025
14.4.1 Pain management devices
14.4.2 Rehabilitation devices
14.4.3 Respiratory therapy devices
14.4.4 Insulin Pumps
14.5 Middle East & Africa Digital Therapeutic Devices (Digital Therapeutic Devices) Market Value Share Analysis, by Application
14.6 Middle East & Africa Market Size (US$ Mn) Forecast, by Application (Digital Therapeutic Devices) 2017–2025
14.6.1 Preventive
14.6.1.1 Pre diabetes
14.6.1.2 Obesity
14.6.1.3 Smoking Cessation
14.6.1.4 Others
14.6.2 Treatment/Care
14.6.2.1 Diabetes
14.6.2.2 Cardiovascular Diseases
14.6.2.3 Central Nervous System Disease
14.6.2.4 Respiratory Diseases
14.6.2.5 Musculoskeletal Diseases
14.6.2.6 Medication Adherence
14.6.2.7 Others
14.7 Middle East & Africa Digital Therapeutic Devices Market Value Share Analysis, by End-user
14.8 Middle East & Africa Market Size (US$ Mn) Forecast, by End-user 2017–2025
14.8.1 B2C
14.8.1.1 Patients
14.8.1.2 Caregivers
14.8.2 B2B
14.8.2.1 Providers
14.8.2.2 Payers
14.8.2.3 Employers
14.8.2.4 Pharmaceutical Companies
14.8.2.5 Others
14.9 Market Attractiveness Analysis
14.9.1 By Product
14.9.2 By Application
14.9.3 By End User
Section 15 Company Profiles
15.1 Company Share Analysis
15.2 Company Profiles
15.2.1 Proteus Digital Therapeutic Devices
15.2.1.1. Company Overview (HQ, Business Segments, Employee Strength)
15.2.1.2. Revenue Model
15.2.1.3. Product Portfolio
15.2.1.4. SWOT Analysis
15.2.1.5. Strategic Overview
15.2.1.6. Funding Overview
15.2.2 Omada Health, Inc.
15.2.2.1. Company Overview (HQ, Business Segments, Employee Strength)
15.2.2.2. Revenue Model
15.2.2.3. Product Portfolio
15.2.2.4. SWOT Analysis
15.2.2.5. Strategic Overview
15.2.2.6. Funding Overview
15.2.3 WellDoc, Inc.
15.2.3.1. Company Overview (HQ, Business Segments, Employee Strength)
15.2.3.2. Product Portfolio
15.2.3.3. SWOT Analysis
15.2.3.4. Strategic Overview
15.2.4 Livongo Health
15.2.4.1. Company Overview (HQ, Business Segments, Employee Strength)
15.2.4.2. Product Portfolio
15.2.4.3. SWOT Analysis
15.2.4.4. Strategic Overview
15.2.4.5. Funding Overview
15.2.5 Noom, Inc.
15.2.5.1. Company Overview (HQ, Business Segments, Employee Strength)
15.2.5.2. Product Portfolio
15.2.5.3. SWOT Analysis
15.2.5.4. Strategic Overview
15.2.5.5. Funding Overview
15.2.6 Ginger.io, Inc.
15.2.6.1. Company Overview (HQ, Business Segments, Employee Strength)
15.2.6.2. Product Portfolio
15.2.6.3. SWOT Analysis
15.2.6.4. Strategic Overview
15.2.7 Propeller Health
15.2.7.1. Company Overview (HQ, Business Segments, Employee Strength)
15.2.7.2. Product Portfolio
15.2.7.3. SWOT Analysis
15.2.7.4. Strategic Overview
15.2.7.5. Funding Overview
15.2.8 2Morrow, Inc.
15.2.8.1. Company Overview (HQ, Business Segments, Employee Strength)
15.2.8.2. Product Portfolio
15.2.8.3. SWOT Analysis
15.2.8.4. Strategic Overview
15.2.9 Canary Health
15.2.9.1. Company Overview (HQ, Business Segments, Employee Strength)
15.2.9.2. Product Portfolio
15.2.9.3. SWOT Analysis
15.2.9.4. Strategic Overview
15.2.10 Mango Health
15.2.10.1. Company Overview (HQ, Business Segments, Employee Strength)
15.2.10.2. Product Portfolio
15.2.10.3. SWOT Analysis
15.2.10.4. Strategic Overview
15.2.10.5. Funding Overview
15.2.11 BiogeniQ Inc.
15.2.11.1. Company Overview (HQ, Business Segments, Employee Strength)
15.2.11.2. Product Portfolio
15.2.11.3. SWOT Analysis
15.2.11.4. Strategic Overview
15.2.12 Twine Health, Inc.
15.2.12.1. Company Overview (HQ, Business Segments, Employee Strength)
15.2.12.2. Product Portfolio
15.2.12.3. SWOT Analysis
15.2.12.4. Strategic Overview
15.2.13 Glooko, Inc.
15.2.13.1. Company Overview (HQ, Business Segments, Employee Strength)
15.2.13.2. Product Portfolio
15.2.13.3. SWOT Analysis
15.2.13.4. Strategic Overview
15.2.13.5. Funding Overview
15.2.14 Firstbeat Technologies Ltd
15.2.14.1. Company Overview (HQ, Business Segments, Employee Strength)
15.2.14.2. Product Portfolio
15.2.14.3. SWOT Analysis
15.2.14.4. Strategic Overview
15.2.15 Claritas MindSciences
15.2.15.1. Company Overview (HQ, Business Segments, Employee Strength)
15.2.15.2. Product Portfolio
15.2.15.3. SWOT Analysis
15.2.15.4. Strategic Overview
15.2.16 Big Health
15.2.16.1. Company Overview (HQ, Business Segments, Employee Strength)
15.2.16.2. Product Portfolio
15.2.16.3. SWOT Analysis
15.2.16.4. Strategic Overview
15.2.16.5. Revenue Model
15.2.17 Nanobiosym, Inc.
15.2.17.1. Company Overview (HQ, Business Segments, Employee Strength)
15.2.17.2. Product Portfolio
15.2.17.3. SWOT Analysis
15.2.17.4. Strategic Overview
15.2.18 Dthera Sciences
15.2.17.1. Company Overview (HQ, Business Segments, Employee Strength)
15.2.17.2. Financial Overview
15.2.17.3. Product Portfolio
15.2.17.4. SWOT Analysis
15.2.17.5. Strategic Overview
15.2.19 Jintronix, Inc.
15.2.19.1. Company Overview (HQ, Business Segments, Employee Strength)
15.2.19.2. Product Portfolio
15.2.19.3. SWOT Analysis
15.2.19.4. Strategic Overview
15.2.19.5. Funding Overview
15.2.20 Virta Health Corp
15.2.20.1. Company Overview (HQ, Business Segments, Employee Strength)
15.2.20.2. Product Portfolio
15.2.20.3. SWOT Analysis
15.2.20.4. Strategic Overview
15.2.21 Zest Health, LLC
15.2.21.1. Company Overview (HQ, Business Segments, Employee Strength)
15.2.21.2. Product Portfolio
15.2.21.3. SWOT Analysis
15.2.21.4. Strategic Overview
15.2.21.5. Funding Overview
15.2.22 Meru Health, Inc.
15.2.22.1. Company Overview (HQ, Business Segments, Employee Strength)
15.2.22.2. Product Portfolio
15.2.22.3. SWOT Analysis
15.2.22.4. Strategic Overview
15.2.22.5. Funding Overview
15.2.23 HealthMine, Inc.
15.2.23.1. Company Overview (HQ, Business Segments, Employee Strength)
15.2.23.2. Product Portfolio
15.2.23.3. SWOT Analysis
15.2.23.4. Strategic Overview
15.2.23.5. Funding Overview
15.2.24 Pear Therapeutics, Inc.
15.2.24.1. Company Overview (HQ, Business Segments, Employee Strength)
15.2.24.2. Product Portfolio
15.2.24.3. SWOT Analysis
15.2.24.4. Strategic Overview
15.2.24.5. Funding Overview
15.2.25 BioTelemetry, Inc.
15.2.25.1. Company Overview (HQ, Business Segments, Employee Strength)
15.2.25.2. Financial Overview
15.2.25.3. Product Portfolio
15.2.25.4. SWOT Analysis
15.2.25.5. Strategic Overview
15.2.26 Blue Mesa Health
15.2.27.1. Company Overview (HQ, Business Segments, Employee Strength)
15.2.27.2. Financial Overview
15.2.27.3. Product Portfolio
15.2.27.4. SWOT Analysis
15.2.27.5. Strategic Overview
15.2.27 Digital Therapeutics
15.2.27.1. Company Overview (HQ, Business Segments, Employee Strength)
15.2.27.2. Financial Overview
15.2.27.3. Product Portfolio
15.2.27.4. SWOT Analysis
15.2.27.5. Strategic Overview
15.3 M&A Deals - Digital Health
15.3.1 M&A Deals in the Digital Therapeutic Devices Market (2015)
15.3.2 M&A Deals in the Digital Therapeutic Devices Market (2016)
15.3.3 M&A Deals in the Digital Therapeutic Devices Market (2015)
15.4 Funding Deals - Digital Health
15.4.1 Funding Deals in the Digital Therapeutic Devices Market (2015)
15.4.2 Funding Deals in the Digital Therapeutic Devices Market (2016)
15.4.3 Funding Deals in the Digital Therapeutic Devices Market (2015)
List of Tables
Table 01: Diabetes Prevalence
Table 02: Data Security Breach
Table 03: Global Digital Therapeutic Devices Market Size (US$ Mn) Forecast, by Product, 2015–2025
Table 04: Global Digital Therapeutic Devices Market Size (US$ Mn) Forecast, by Application, 2015–2025
Table 05: Global Digital Therapeutic Devices Market Size (US$ Mn) Forecast, by Application (Preventive), 2015–2025
Table 06: Global Digital Therapeutic Devices Market Size (US$ Mn) Forecast, by Application (Treatment/Care),
Table 07: Global Digital Therapeutic Devices Market Size (US$ Mn) Forecast, by End-user, 2015–2025
Table 08: Global B2C Market Size (US$ Mn) Forecast, by End-user, 2015–2025
Table 09: Global B2B Market Size (US$ Mn) Forecast, by End-user, 2015–2025
Table 10: Global Digital Therapeutic Devices Market Size (US$ Mn) Forecast, by Region, 2015–2025
Table 11: North America Digital Therapeutic Devices Market Size (US$ Mn) Forecast, by Country, 2015–2025
Table 12: North America Digital Therapeutic Devices Market Size (US$ Mn) Forecast, by Product, 2015–2025
Table 13: North America Digital Therapeutic Devices Market Size (US$ Mn) Forecast, by Application, 2015–2025
Table 14: North America Digital Therapeutic Devices Application Market Size (US$ Mn) Forecast, by Preventive, 2015–2025
Table 15: North America Digital Therapeutic Devices Application Market Size (US$ Mn) Forecast, by Treatment/Care, 2015–2025
Table 16: North America Digital Therapeutic Devices Market Size (US$ Mn) Forecast, by End-user, 2015–2025
Table 17: North America Digital Therapeutic Devices Market Size (US$ Mn) Forecast, by End-user (B2C), 2015–2025
Table 18: North America Digital Therapeutic Devices Market Size (US$ Mn) Forecast, by End-user (B2B), 2015–2025
Table 19: Europe Digital Therapeutic Devices Market Size (US$ Mn) Forecast, by Country, 2015–2025
Table 20: Europe Digital Therapeutic Devices Market Size (US$ Mn) Forecast, by Product, 2015–2025
Table 21: Europe Digital Therapeutic Devices Market Size (US$ Mn) Forecast, by Application, 2015–2025
Table 22: Europe Digital Therapeutic Devices Application Market Size (US$ Mn) Forecast, by Preventive, 2015–2025
Table 23: Europe Digital Therapeutic Devices Application Market Size (US$ Mn) Forecast, by Treatment/Care, 2015–2025
Table 24: Europe Digital Therapeutic Devices Market Size (US$ Mn) Forecast, by End-user, 2015–2025
Table 25: Europe Digital Therapeutic Devices Market Size (US$ Mn) Forecast, by End-user (B2C), 2015–2025
Table 26: Europe Digital Therapeutic Devices Market Size (US$ Mn) Forecast, by End-user (B2B), 2015–2025
Table 27: Asia Pacific Digital Therapeutic Devices Market Size (US$ Mn) Forecast, by Country, 2015–2025
Table 28: Asia Pacific Digital Therapeutic Devices Market Size (US$ Mn) Forecast, by Product, 2015–2025
Table 29: Asia Pacific Digital Therapeutic Devices Market Size (US$ Mn) Forecast, by Application, 2015–2025
Table 30: Asia Pacific Digital Therapeutic Devices Application Market Size (US$ Mn) Forecast, by Preventive, 2015–2025
Table 31: Asia Pacific Digital Therapeutic Devices Application Market Size (US$ Mn) Forecast, by Treatment/Care, 2015–2025
Table 32: Asia Pacific Digital Therapeutic Devices Market Size (US$ Mn) Forecast, by End-user, 2015–2025
Table 33: Asia Pacific Digital Therapeutic Devices Market Size (US$ Mn) Forecast, by End-user (B2C), 2015–2025
Table 34: Asia Pacific Digital Therapeutic Devices Market Size (US$ Mn) Forecast, by End-user (B2B), 2015–2025
Table 35: Latin America Digital Therapeutic Devices Market Size (US$ Mn) Forecast, by Product, 2015–2025
Table 36: Latin America Digital Therapeutic Devices Market Size (US$ Mn) Forecast, by Application, 2015–2025
Table 37: Latin America Digital Therapeutic Devices Application Market Size (US$ Mn) Forecast, by Preventive, 2015–2025
Table 38: Latin America Digital Therapeutic Devices Application Market Size (US$ Mn) Forecast, by Treatment/Care, 2015–2025
Table 39: Latin America Digital Therapeutic Devices Market Size (US$ Mn) Forecast, by End-user, 2015–2025
Table 40: Latin America Digital Therapeutic Devices Market Size (US$ Mn) Forecast, by End-user (B2C), 2015–2025
Table 41: Latin America Digital Therapeutic Devices Market Size (US$ Mn) Forecast, by End-user (B2B), 2015–2025
Table 42: Middle East & Africa Digital Therapeutic Devices Market Size (US$ Mn) Forecast, by Product, 2015–2025
Table 43: Middle East & Africa Digital Therapeutic Devices Market Size (US$ Mn) Forecast, by Application, 2015–2025
Table 44: Middle East & Africa Digital Therapeutic Devices Application Market Size (US$ Mn) Forecast, by Preventive, 2015–2025
Table 45: Middle East & Africa Digital Therapeutic Devices Application Market Size (US$ Mn) Forecast, by Treatment/Care, 2015–2025
Table 46: Middle East & Africa Digital Therapeutic Devices Market Size (US$ Mn) Forecast, by End-user, 2015–2025
Table 47: Middle East & Africa Digital Therapeutic Devices Market Size (US$ Mn) Forecast, by End-user (B2C), 2015–2025
Table 48: Middle East & Africa Digital Therapeutic Devices Market Size (US$ Mn) Forecast, by End-user (B2B), 2015–2025
List of Figures
Figure 01: Global Digital Therapeutic Devices Market Size (US$ Mn) Forecast, 2015–2025
Figure 02: Market Value Share, by Product (2016)
Figure 03: Market Value Share, by Application (2016)
Figure 04: Market Value Share, by End-user (2016)
Figure 05: Market Value Share, by Region (2016)
Figure 06: Global Digital Therapeutic Devices Market Value Share Analysis, by Product, 2017 and 2025
Figure 07: Global Digital Therapeutic Devices Market Revenue (US$ Mn) and Y-o-Y Growth (%) Forecast, by Pain Management Devices, 2015–2025
Figure 08: Global Digital Therapeutic Devices Market Revenue (US$ Mn) and Y-o-Y Growth (%) Forecast, by Rehabilitation Devices, 2015–2025
Figure 09: Global Digital Therapeutic Devices Market Revenue (US$ Mn) and Y-o-Y Growth (%) Forecast, by Respiratory Therapy Devices, 2015–2025
Figure 10: Global Digital Therapeutic Devices Market Revenue (US$ Mn) and Y-o-Y Growth (%) Forecast, by Insulin Pumps, 2015–2025
Figure 11: Global Wearable Devices Market Attractiveness Analysis, by Digital Therapeutic Devices, 2017–2025
Figure 12: Global Digital Therapeutic Devices Market Value Share Analysis, by Application, 2017 and 2025
Figure 13: Global Digital Therapeutic Devices Market Revenue (US$ Mn) and Y-o-Y Growth (%) Forecast, by Preventive, 2015–2025
Figure 14: Global Digital Therapeutic Devices Market Revenue (US$ Mn) and Y-o-Y Growth (%) Forecast, by Treatment/Care, 2015–2025
Figure 15: Global Digital Therapeutic Devices Market Value Share Analysis, by Preventive, 2017 and 2025
Figure 16: Global Digital Therapeutic Devices Market Value Share Analysis, by Application (Treatment/Care), 2017 and 2025
Figure 17: Global Digital Therapeutic Devices Market Attractiveness Analysis, by Application, 2017–2025
Figure 18: Global Digital Therapeutic Devices Market Attractiveness Analysis, by Preventive, 2017–2025
Figure 19: Global Digital Therapeutic Devices Market Attractiveness Analysis, by Treatment/Care, 2017–2025
Figure 20: Global Digital Therapeutic Devices Market Value Share Analysis, by End-user, 2017 and 2025
Figure 21: Global Digital Therapeutic Devices Market Revenue (US$ Mn) and Y-o-Y Growth (%) Forecast, by B2C, 2015–2025
Figure 22: Global Digital Therapeutic Devices Market Revenue (US$ Mn) and Y-o-Y Growth (%) Forecast, by B2B, 2015–2025
Figure 23: Global B2C Market Value Share Analysis, by End-user, 2017 and 2025
Figure 24: Global B2B Market Value Share Analysis, by End-user, 2017 and 2025
Figure 25: Global Digital Therapeutic Devices Market Attractiveness Analysis, by End-user, 2017–2025
Figure 26: Global B2C Market Attractiveness Analysis, by End-user, 2017–025
Figure 27: Global B2B Market Attractiveness Analysis, by End-user, 2017–2025
Figure 28: Global Digital Therapeutic Devices Market Value Share Analysis, by Region, 2017 and 2025
Figure 29: Global Digital Therapeutic Devices Market Attractiveness Analysis, by Region, 2017–2025
Figure 30: North America Digital Therapeutic Devices Market Size
Figure 31: North America Market Attractiveness Analysis,
Figure 32: North America Market Value Share Analysis, by Country, 2017 and 2025
Figure 33: North America Digital Therapeutic Devices Market Value Share Analysis, by Product, 2017 and 2025
Figure 34: North America Digital Therapeutic Devices Market Value Share Analysis, by Application, 2017 and 2025
Figure 35: North America Digital Therapeutic Devices Application Market Value Share Analysis, by Treatment/Care, 2017 and 2025
Figure 36: North America Digital Therapeutic Devices Application Market Value Share Analysis, by Preventive, 2017 and 2025
Figure 37: North America Digital Therapeutic Devices Market Value Share Analysis, by End-user, 2017 and 2025
Figure 38: North America Digital Therapeutic Devices Market Value Share Analysis, by End-user (B2C), 2017 and 2025
Figure 39: North America Digital Therapeutic Devices Market Value Share Analysis, by End-user (B2B), 2017 and 2025
Figure 40: North America Digital Therapeutic Devices Market Attractiveness Analysis, by Product, 2017–2025
Figure 41: North America Digital Therapeutic Devices Market Attractiveness Analysis, by Application, 2017–2025
Figure 42: North America Digital Therapeutic Devices Market Attractiveness Analysis, by End User, 2017–2025
Figure 43: Europe Digital Therapeutic Devices Market Size (US$ Mn) Forecast, 2015–2025
Figure 44: Europe Digital Therapeutic Devices Market Attractiveness Analysis, by Country, 2017–2025
Figure 45: Europe Digital Therapeutic Devices Market Value Share Analysis by Country, 2017 and 2025
Figure 46: Europe Digital Therapeutic Devices Market Value Share Analysis, by Product, 2017 and 2025
Figure 47: Europe Digital Therapeutic Devices Market Value Share Analysis, by Application, 2017 and 2025
Figure 48: Europe Digital Therapeutic Devices Application Market Value Share Analysis, by Treatment/Care, 2017 and 2025
Figure 49: Europe Digital Therapeutic Devices Application Market Value Share Analysis, by Preventive, 2017 and 2025
Figure 50: Europe Digital Therapeutic Devices Market Value Share Analysis, by End-user, 2017 and 2025
Figure 51: Europe Digital Therapeutic Devices Market Value Share Analysis, by End-user (B2C), 2017 and 2025
Figure 52: Europe Digital Therapeutic Devices Market Value Share Analysis, by End-user (B2B), 2017 and 2025
Figure 53: Europe Digital Therapeutic Devices Market Attractiveness Analysis, by Product, 2017–2025
Figure 54: Europe Digital Therapeutic Devices Market Attractiveness Analysis, by Application, 2017–2025
Figure 55: Europe Digital Therapeutic Devices Market Attractiveness Analysis, by End User, 2017–2025
Figure 56: Asia Pacific Digital Therapeutic Devices Market Size (US$ Mn) Forecast, 2015–2025
Figure 57: Asia Pacific Market Attractiveness Analysis, by Country, 2017–2025
Figure 58: Asia Pacific Digital Therapeutic Devices Market Value Share Analysis, by Country, 2017 and 2025
Figure 59: Asia Pacific Digital Therapeutic Devices Market Value Share Analysis, by Product, 2017 and 2025
Figure 60: Asia Pacific Digital Therapeutic Devices Market Value Share Analysis, by Application, 2017 and 2025
Figure 61: Asia Pacific Digital Therapeutic Devices Application Market Value Share Analysis, by Treatment/Care, 2017 and 2025
Figure 62: Asia Pacific Digital Therapeutic Devices Application Market Value Share Analysis, by Preventive, 2017 and 2025
Figure 63: Asia Pacific Digital Therapeutic Devices Market Value Share Analysis, by End-user, 2017 and 2025
Figure 64: Asia Pacific Digital Therapeutic Devices Market Value Share Analysis, by End-user (B2C), 2017 and 2025
Figure 65: Asia Pacific Digital Therapeutic Devices Market Value Share Analysis, by End-user (B2B), 2017 and 2025
Figure 66: Asia Pacific Digital Therapeutic Devices Market Attractiveness Analysis, by Product, 2017–2025
Figure 67: Asia Pacific Digital Therapeutic Devices Market Attractiveness Analysis, by Application, 2017–2025
Figure 68: Asia Pacific Digital Therapeutic Devices Market Attractiveness Analysis, by End User, 2017–2025
Figure 69: Latin America Digital Therapeutic Devices Market Size
Figure 70: Latin America Digital Therapeutic Devices Market Value Share Analysis, by Product, 2017 and 2025
Figure 71: Latin America Digital Therapeutic Devices Market Value Share Analysis, by Application, 2017 and 2025
Figure 72: Latin America Digital Therapeutic Devices Application Market Value Share Analysis, by Treatment/Care, 2017 and 2025
Figure 73: Latin America Digital Therapeutic Devices Application Market Value Share Analysis, by Preventive, 2017 and 2025
Figure 74: Latin America Digital Therapeutic Devices Market Value Share Analysis, by End-user, 2017 and 2025
Figure 75: Latin America Digital Therapeutic Devices Market Value Share Analysis, by End-user (B2C), 2017 and 2025
Figure 76: Latin America Digital Therapeutic Devices Market Value Share Analysis, by End-user (B2B), 2017 and 2025
Figure 77: Latin America Digital Therapeutic Devices Market Attractiveness Analysis, by Product, 2017–2025
Figure 78: Latin America Digital Therapeutic Devices Market Attractiveness Analysis, by Application, 2017–2025
Figure 79: Latin America Digital Therapeutic Devices Market Attractiveness Analysis, by End User, 2017–2025
Figure 80: Middle East & Africa Digital Therapeutic Devices Market Size (US$ Mn) Forecast, 2015–2025
Figure 81: Middle East & Africa Digital Therapeutic Devices Market Value Share Analysis, by Product, 2017 and 2025
Figure 82: Middle East & Africa Digital Therapeutic Devices Market Value Share Analysis, by Application, 2017 and 2025
Figure 83: Middle East & Africa Digital Therapeutic Devices Application Market Value Share Analysis, by Treatment/Care, 2017 and 2025
Figure 84: Middle East & Africa Digital Therapeutic Devices Application Market Value Share Analysis, by Preventive, 2017 and 2025
Figure 85: Middle East & Africa Digital Therapeutic Devices Market Value Share Analysis, by End-user, 2017 and 2025
Figure 86: Middle East & Africa Digital Therapeutic Devices Market Value Share Analysis, by End-user (B2C), 2017 and 2025
Figure 87: Middle East & Africa Digital Therapeutic Devices Market Value Share Analysis, by End-user (B2B), 2017 and 2025
Figure 88: Middle East & Africa Digital Therapeutic Devices Market Attractiveness Analysis, by Product, 2017–2025
Figure 89: Middle East & Africa Digital Therapeutic Devices Market Attractiveness Analysis, by Application, 2017–2025
Figure 90: Middle East & Africa Digital Therapeutic Devices Market Attractiveness Analysis, by End User, 2017–2025
Copyright © Transparency Market Research, Inc. All Rights reserved
Trust Online

Digital Therapeutic Devices Market