
Reports
Reports
Analysts’ Viewpoint on Laboratory Gas Generators Market Scenario
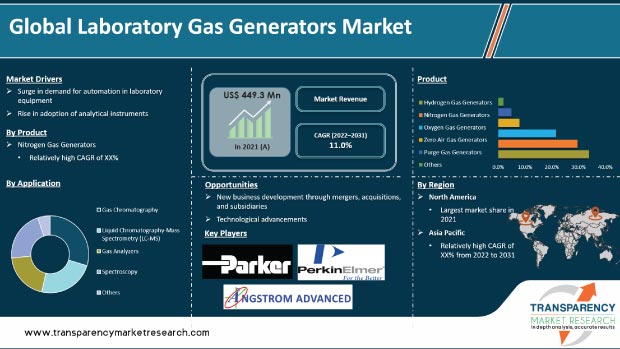
Rise in demand for automation in laboratory equipment is a key factor expected to drive the global laboratory gas generators market in the next few years. Usage of laboratory gas generators has increased in the past few years. This can be ascribed to advantages of these equipment over conventional gas cylinders, rise in food safety concerns, increase in demand for hydrogen gas as a helium substitute, surge in R&D spending in the laboratory gas generators market, and growth in relevance of analytical methods in drug and food approval processes. Additionally, the laboratory gas generators market growth can be ascribed to the development of life sciences, infrastructure, and healthcare facilities during the forecast period. Companies operating in the global laboratory gas generators market are concentrating on acquisitions to broaden their revenue streams. Rise in replacement of conventional gas cylinders with laboratory gas generators due to safety concerns is projected to augment the global market in the next few years.
Laboratory gas generator provides continuous supply of purified gas to equipment, such as gas chromatography, ion mobility spectrometers, gas analyzers, GC-MS, FTIR, environmental chambers, or clean, dry gas devices, which require a specific gas. Laboratory gas generators eliminate the hazards of working with high-pressure cylinders. Most laboratory gas generators are fully automated. The equipment includes a spark plug that ignites the gasoline, a piston that is pushed down, and a crankshaft that rotates. The crankshaft spins the generator's rotor in an electromagnetic field, generating an electric current. Lab gas generators are more efficient and cost-effective than compressed gas cylinders and bulk gas storage laboratories. These on-demand gas generators are trustworthy and easy-to-use options. They are also considered long-term replacements, as these are safe, stable, and can be used indefinitely. Laboratory gas generators are used for chromatography and mass spectroscopy in various industries such as pharmaceutical and chemical. Furthermore, these generators are used in food & beverages industry; and industrial and electrical & electronic sectors.
Demand for analytical instruments, systems, and methods is high in healthcare and associated industries. These instruments are used for chromatography and mass spectroscopy for research, diagnosis, detection, and other analytical purposes. These technologies necessitate the usage of various gases such as nitrogen, hydrogen, oxygen, and zero air. Internal gas generation by laboratory equipment or generators simplifies and expedites analytical procedures. Gas generation equipment manufacturers are striving to increase the production of hydrogen generators. This is creating lucrative opportunities for instrument firms. Thus, the global laboratory gas generators market forecast appears positive led by the increase in adoption of these analytical instruments and systems.
Shortage of helium is leading to a rise in demand for laboratory hydrogen gas generators, thereby driving the global laboratory gas generators market size. According to an IEA analysis published in October 2021, demand for hydrogen is projected to reach 88.48 metric tons in 2020 and 210.56 metric tons by 2021.
Demand for cannabis analytical testing has increased in the past few years, as medical cannabis has been legalized in several countries/states around the world. This test helps ensure the safety of medical cannabis prior to human consumption. Gas and liquid chromatography are two of the most powerful and widely used cannabis analysis techniques. These require a near-constant supply of highly pure nitrogen or hydrogen gas. Switching to a gas generator can reduce the cost and inconvenience of compressed gas cylinders, while also allowing for cannabis testing using gas and liquid chromatography techniques. Moreover, medical cannabis has been shown to be effective in various medical applications, including alleviating nausea caused by chemotherapy, stimulating appetite in AIDS patients, controlling muscular spasms in multiple sclerosis patients, and lowering intraocular pressure in glaucoma patients. Governments in various countries are legalizing the use of medical cannabis due to its health benefits. Medical cannabis has been legalized in Australia (2016), Canada (2015), South Korea (2018), Portugal (2001), the U.K. (2006), Germany (2017), Italy (2013), the Netherlands (2003), and Brazil (2017).
Companies in the global laboratory gas generators market are focusing on acquisitions to expand their operations. In 2018, Messer Group GmbH formed a joint venture called Messer Industries GmbH to acquire the majority of Linde AG's gases business in North America, as well as certain Linde and Praxair business activities in South America, effective March 1, 2019. Thus, companies are increasingly entering into acquisition and joint venture strategies to grow their laboratory gas generators market share.
In terms of product, the global laboratory gas generators market has been classified into hydrogen gas generators, nitrogen gas generators, oxygen gas generators, zero air generators, purge gas generators, and others. The hydrogen gas generators segment is projected to dominate the global market during the forecast period due to the increase in safety regulations for research & development and high regulatory compliance. Hydrogen gas generator uses various processes such as steam reforming and electrolysis to produce hydrogen from water and fossil fuels. It employs a proton exchange membrane to generate high purity hydrogen gas from water. End-use applications of hydrogen generators include chemical processing, fuel cells, refining, and petroleum recovery.
Based on application, the global laboratory gas generators market has been segmented into gas chromatography, liquid chromatography-mass spectrometry (LC-MS), gas analyzers, spectroscopy, and others. The gas chromatography segment held major share of the global market in 2021. High usage of gas chromatography for the analysis and separation of various experimental compounds even at low concentration is expected to drive the segment during the forecast period. Various gas generators, such as hydrogen gas generators, are used in gas chromatography in different lab applications.
Increase in application of gas chromatography in industries such as pharmaceutical, chemical & food, environmental testing laboratories, and forensic science; and rise in adoption of gas chromatography techniques in drug discovery processes are also driving the gas chromatography segment. Additionally, growth in popularity of hyphenated chromatography techniques such as GC-MS is augmenting the gas chromatography segment.
In terms of end-user, the global laboratory gas generators market has been divided into chem/petrochemical companies, pharmaceutical & biotechnology companies, environmental companies, food & beverage companies, and others. The pharmaceutical & biotechnology companies segment is projected to dominate the global market during the forecast period. Laboratory gas generators play a vital role in pharmaceutical and biotechnology companies by providing high level of purity for various applications from manufacturing to packaging of drugs. For instance, nitrogen gas is used for blanketing, handling, and packaging of drugs. Furthermore, in-house gas generators help in removal of contamination during drug production.
North America accounted for major share of around 40.0% of the global laboratory gas generators market in 2021. The trend is expected to continue during the forecast period owing to the increase in number of biotechnology centers in the U.S. Eli Lilly and Company expanded biotechnology centers in San Diego, California, in 2017. This is projected to accelerate the production of various medicines, thus propelling the demand for laboratory gas for product protection and improvement (drug).
The market in Asia Pacific is anticipated to grow at a rapid pace in the next few years. Expansion of the laboratory gas generators market in the region can be ascribed to the rise in demand for laboratory gas generators in pharmaceutical, biotechnology, and related industries; presence of emerging economies with high potential for research & development activities; and government initiatives for research funding & collaboration with companies.
The global laboratory gas generators market is consolidated, with the presence of small number of leading players. Majority of the companies are investing significantly in research & development activities, primarily to introduce advanced laboratory gas generators such as Parker Zero Air Generators. Strategic alliances among key players to increase revenue and market share is augmenting the global market. Furthermore, diversification of product portfolios and mergers & acquisitions are the key strategies adopted by the leading players. Parker Hannifin Corp, Angstrom Advanced, Inc., PerkinElemer, Inc., Peak Scientific Instruments Ltd., Nel ASA, Erre Due s.p.a., Nitrogenium, F-DGSi, and Airgas, Inc. are the prominent players operating in the global laboratory gas generators market.
Each of these players has been profiled in the laboratory gas generators market report based on parameters such as company overview, financial overview, business strategies, product portfolio, business segments, and recent developments.
|
Attribute |
Detail |
|
Market Size Value in 2021 |
US$ 449.3 Mn |
|
Market Forecast Value in 2031 |
More than US$ 1.27 Bn |
|
Growth Rate (CAGR) |
11% |
|
Forecast Period |
2022–2031 |
|
Historical Data Available for |
2017–2021 |
|
Quantitative Units |
US$ Mn/Bn for Value |
|
Market Analysis |
It includes segment analysis as well as regional level analysis. Moreover, qualitative analysis includes drivers, restraints, opportunities, key trends, and key trend analysis. |
|
Competition Landscape |
|
|
Format |
Electronic (PDF) + Excel |
|
Market Segmentation |
|
|
Regions Covered |
|
|
Countries Covered |
|
|
Companies Profiled |
|
|
Customization Scope |
Available upon request |
|
Pricing |
Available upon request |
The global laboratory gas generators market was valued at US$ 449.3 Mn in 2021
The global laboratory gas generators market is projected to reach more than US$ 1.27 Bn by 2031
The global laboratory gas generators market is anticipated to grow at a CAGR of 11% from 2022 to 2031
Surge in demand for automation in laboratory equipment
The pharmaceutical & biotechnology companies segment held more than 32% share of the global laboratory gas generators market in 2021
Parker Hannifin Corp, Angstrom Advanced, Inc., PerkinElemer, Inc., Peak Scientific Instruments Ltd., Nel ASA, Erre Due s.p.a., Nitrogenium, F-DGSi, and Airgas, Inc.
1. Preface
1.1. Market Definition and Scope
1.2. Market Segmentation
1.3. Key Research Objectives
1.4. Research Highlights
2. Assumptions and Research Methodology
3. Executive Summary: Global Laboratory Gas Generators Market
4. Market Overview
4.1. Introduction
4.1.1. Product Definition
4.1.2. Industry Evolution / Developments
4.2. Overview
4.3. Market Dynamics
4.3.1. Drivers
4.3.2. Restraints
4.3.3. Opportunities
4.4. Global Laboratory Gas Generators Market Analysis and Forecast, 2017–2031
4.4.1. Market Revenue Projections (US$ Mn)
4.5. Porter’s Five Force Analysis
5. Market Outlook
5.1. Market Strategies Adopted by Top Players
5.2. Key Product/Brand Analysis
6. Global Laboratory Gas Generators Market Analysis and Forecast, by Product Type
6.1. Introduction & Definition
6.2. Key Findings / Developments
6.3. Global Laboratory Gas Generators Market Value Forecast, by Product Type, 2017–2031
6.3.1. Hydrogen Gas Generators
6.3.2. Nitrogen Gas Generators
6.3.3. Oxygen Gas Generators
6.3.4. Zero Air Gas Generators
6.3.5. Purge Gas Generators
6.3.6. Others
6.4. Global Laboratory Gas Generators Market Attractiveness Analysis, by Product Type
7. Global Laboratory Gas Generators Market Analysis and Forecast, by Application
7.1. Introduction & Definition
7.2. Key Findings / Developments
7.3. Global Laboratory Gas Generators Market Value Forecast, by Application, 2017–2031
7.3.1. Gas Chromatography
7.3.2. Liquid Chromatography-Mass Spectrometry (LC-MS)
7.3.3. Gas Analyzers
7.3.4. Spectroscopy
7.3.5. Others
7.4. Global Laboratory Gas Generators Market Attractiveness Analysis, by Application;
8. Global Laboratory Gas Generators Market Analysis and Forecast, by End-user
8.1. Introduction & Definition
8.2. Key Findings / Developments
8.3. Global Laboratory Gas Generators Market Value Forecast, by End-user, 2017–2031
8.3.1. Chem/Petrochemical Companies
8.3.2. Pharmaceutical & Biotechnology Companies
8.3.3. Environmental Companies
8.3.4. Food and beverage Companies
8.3.5. Others
8.4. Global Laboratory Gas Generators Market Attractiveness Analysis, by End-user
9. Global Laboratory Gas Generators Market Analysis and Forecast, by Region
9.1. Key Findings
9.2. Global Laboratory Gas Generators Market Value Forecast, by Region
9.2.1. North America
9.2.2. Europe
9.2.3. Asia Pacific
9.2.4. Latin America
9.2.5. Middle East & Africa
9.3. Global Laboratory Gas Generators Market Attractiveness Analysis, by Country
10. North America Laboratory Gas Generators Market Analysis and Forecast
10.1. Introduction
10.2. North America Laboratory Gas Generators Market Value Forecast, by Product Type, 2017–2031
10.2.1. Hydrogen Gas Generators
10.2.2. Nitrogen Gas Generators
10.2.3. Oxygen Gas Generators
10.2.4. Zero Air Gas Generators
10.2.5. Purge Gas Generators
10.2.6. Others
10.3. North America Laboratory Gas Generators Market Value Forecast, by Application, 2017–2031
10.3.1. Gas Chromatography
10.3.2. Liquid Chromatography-Mass Spectrometry (LC-MS)
10.3.3. Gas Analyzers
10.3.4. Spectroscopy
10.3.5. Others
10.4. North America Laboratory Gas Generators Market Value Forecast, by End-user, 2017–2031
10.4.1. Chem/Petrochemical Companies
10.4.2. Pharmaceutical & Biotechnology Companies
10.4.3. Environmental Companies
10.4.4. Food and beverage Companies
10.4.5.Others
10.5. North America Laboratory Gas Generators Market Value Forecast, by Country, 2017–2031
10.5.1. U.S.
10.5.2. Canada
10.6. North America Laboratory Gas Generators Market Attractiveness Analysis
10.6.1. By Product
10.6.2. By Application
10.6.3. By End-user
10.6.4. By Country
11. Europe Laboratory Gas Generators Market Analysis and Forecast
11.1. Introduction
11.2. Europe Laboratory Gas Generators Market Value Forecast, by Product Type, 2017–2031
11.2.1. Hydrogen Gas Generators
11.2.2. Nitrogen Gas Generators
11.2.3. Oxygen Gas Generators
11.2.4. Zero Air Gas Generators
11.2.5. Purge Gas Generators
11.2.6. Others
11.3. Europe Laboratory Gas Generators Market Value Forecast, by Application, 2017–2031
11.3.1. Gas Chromatography
11.3.2. Liquid Chromatography-Mass Spectrometry (LC-MS)
11.3.3. Gas Analyzers
11.3.4. Spectroscopy
11.3.5. Others
11.4. Europe Laboratory Gas Generators Market Value Forecast, by End-user, 2017–2031
11.4.1. Chem/Petrochemical Companies
11.4.2. Pharmaceutical & Biotechnology Companies
11.4.3. Environmental Companies
11.4.4. Food and beverage Companies
11.4.5. Others
11.5. Europe Laboratory Gas Generators Market Value Forecast, by Country/Sub-region, 2017–2031
11.5.1. Germany
11.5.2. U.K.
11.5.3. France
11.5.4. Spain
11.5.5. Italy
11.5.6. Rest of Europe
11.6. Europe Laboratory Gas Generators Market Attractiveness Analysis
11.6.1. By Product
11.6.2. By Application
11.6.3. By End-user
11.6.4. By Country/Sub-region
12. Asia Pacific Laboratory Gas Generators Market Analysis and Forecast
12.1. Introduction
12.2. Asia Pacific Laboratory Gas Generators Market Value Forecast, by Product Type, 2017–2031
12.2.1. Hydrogen Gas Generators
12.2.2. Nitrogen Gas Generators
12.2.3. Oxygen Gas Generators
12.2.4. Zero Air Gas Generators
12.2.5. Purge Gas Generators
12.2.6. Others
12.3. Asia Pacific Laboratory Gas Generators Market Value Forecast, by Application, 2017–2031
12.3.1. Gas Chromatography
12.3.2. Liquid Chromatography-Mass Spectrometry (LC-MS)
12.3.3. Gas Analyzers
12.3.4. Spectroscopy
12.3.5. Others
12.4. Asia Pacific Laboratory Gas Generators Market Value Forecast, by End-user, 2017–2031
12.4.1. Chem/Petrochemical Companies
12.4.2. Pharmaceutical & Biotechnology Companies
12.4.3. Environmental Companies
12.4.4. Food and beverage Companies
12.4.5. Others
12.5. Asia Pacific Laboratory Gas Generators Market Value Forecast, by Country/Sub-region, 2017–2031
12.5.1. China
12.5.2. Japan
12.5.3. India
12.5.4. Australia & New Zealand
12.5.5. Rest of Asia Pacific
12.6. Asia Pacific Laboratory Gas Generators Market Attractiveness Analysis
12.6.1. By Product
12.6.2. By Application
12.6.3. By End-user
12.6.4. By Country/Sub-region
13. Latin America Laboratory Gas Generators Market Analysis and Forecast
13.1. Introduction
13.2. Latin America Laboratory Gas Generators Market Value Forecast, by Product Type, 2017–2031
13.2.1. Hydrogen Gas Generators
13.2.2. Nitrogen Gas Generators
13.2.3. Oxygen Gas Generators
13.2.4. Zero Air Gas Generators
13.2.5. Purge Gas Generators
13.2.6. Others
13.3. Latin America Laboratory Gas Generators Market Value Forecast, by Application, 2017–2031
13.3.1. Gas Chromatography
13.3.2. Liquid Chromatography-Mass Spectrometry (LC-MS)
13.3.3. Gas Analyzers
13.3.4. Spectroscopy
13.3.5. Others
13.4. Latin America Laboratory Gas Generators Market Value Forecast, by End-user, 2017–2031
13.4.1. Chem/Petrochemical Companies
13.4.2. Pharmaceutical & Biotechnology Companies
13.4.3. Environmental Companies
13.4.4. Food and beverage Companies
13.4.5. Others
13.5. Latin America Laboratory Gas Generators Market Value Forecast, by Country/Sub-region, 2017–2031
13.5.1. Brazil
13.5.2. Mexico
13.5.3. Rest of Latin America
13.6. Latin America Laboratory Gas Generators Market Attractiveness Analysis
13.6.1. By Product
13.6.2. By Application
13.6.3. By End-user
13.6.4. By Country/Sub-region
14. Middle East & Africa Laboratory Gas Generators Market Analysis and Forecast
14.1. Introduction
14.2. Middle East & Africa Laboratory Gas Generators Market Value Forecast, by Product Type, 2017–2031
14.2.1. Hydrogen Gas Generators
14.2.2. Nitrogen Gas Generators
14.2.3. Oxygen Gas Generators
14.2.4. Zero Air Gas Generators
14.2.5. Purge Gas Generators
14.2.6. Others
14.3. Middle East & Africa Laboratory Gas Generators Market Value Forecast, by Application, 2017–2031
14.3.1. Gas Chromatography
14.3.2. Liquid Chromatography-Mass Spectrometry (LC-MS)
14.3.3. Gas Analyzers
14.3.4. Spectroscopy
14.3.5. Others
14.4. Middle East & Africa Laboratory Gas Generators Market Value Forecast, by End-user, 2017–2031
14.4.1. Chem/Petrochemical Companies
14.4.2. Pharmaceutical & Biotechnology Companies
14.4.3. Environmental Companies
14.4.4. Food and beverage Companies
14.4.5. Others
14.5. Middle East & Africa Laboratory Gas Generators Market Value Forecast, by Country/Sub-region, 2017–2031
14.5.1. GCC Countries
14.5.2. South Africa
14.5.3. Rest of Middle East & Africa
14.6. Middle East & Africa Laboratory Gas Generators Market Attractiveness Analysis
14.6.1. By Product
14.6.2. By Application
14.6.3. By End-user
14.6.4. By Country/Sub-region
15. Competition Landscape
15.1. Market Share Analysis, by Company, 2021
15.2. Company Profiles
15.2.1. Parker Hannifin Corp
15.2.1.1. Company Overview (HQ, Business Segments, Employee Strength)
15.2.1.2. Financial Overview
15.2.1.3. Product Portfolio
15.2.1.4. SWOT Analysis
15.2.1.5. Strategic Overview
15.2.2. Angstrom Advanced, Inc.
15.2.2.1. Company Overview (HQ, Business Segments, Employee Strength)
15.2.2.2. Financial Overview
15.2.2.3. Product Portfolio
15.2.2.4. SWOT Analysis
15.2.2.5. Strategic Overview
15.2.3. PerkinElmer, Inc.
15.2.3.1. Company Overview (HQ, Business Segments, Employee Strength)
15.2.3.2. Financial Overview
15.2.3.3. Product Portfolio
15.2.3.4. SWOT Analysis
15.2.3.5. Strategic Overview
15.2.4. Peak Scientific Instruments Ltd.
15.2.4.1. Company Overview (HQ, Business Segments, Employee Strength)
15.2.4.2. Financial Overview
15.2.4.3. Product Portfolio
15.2.4.4. SWOT Analysis
15.2.4.5. Strategic Overview
15.2.5. Nel ASA
15.2.5.1. Company Overview (HQ, Business Segments, Employee Strength)
15.2.5.2. Financial Overview
15.2.5.3. Product Portfolio
15.2.5.4. SWOT Analysis
15.2.5.5. Strategic Overview
15.2.6. Erre Due s.p.a.
15.2.6.1. Company Overview (HQ, Business Segments, Employee Strength)
15.2.6.2. Financial Overview
15.2.6.3. Product Portfolio
15.2.6.4. SWOT Analysis
15.2.6.5. Strategic Overview
15.2.7. Nitrogenium
15.2.7.1. Company Overview (HQ, Business Segments, Employee Strength)
15.2.7.2. Product Portfolio
15.2.7.3. SWOT Analysis
15.2.7.4. Strategic Overview
15.2.8. F-DGSi
15.2.8.1. Company Overview (HQ, Business Segments, Employee Strength)
15.2.8.2. Financial Overview
15.2.8.3. Product Portfolio
15.2.8.4. SWOT Analysis
15.2.8.5. Strategic Overview
15.2.9. Airgas, Inc.
15.2.9.1. Company Overview (HQ, Business Segments, Employee Strength)
15.2.9.2. Financial Overview
15.2.9.3. Product Portfolio
15.2.9.4. SWOT Analysis
15.2.9.5. Strategic Overview
List of Tables
Table 01: Brand Comparison
Table 02: Global Laboratory Gas Generators Market Value (US$ Mn) Forecast, by Product Type, 2017–2031
Table 03: Global Laboratory Gas Generators Market Value (US$ Mn) Forecast, by Application, 2017–2031
Table 04: Global Laboratory Gas Generators Market Value (US$ Mn) Forecast, by End-user, 2017–2031
Table 05: Global Laboratory Gas Generators Market Value (US$ Mn) Forecast, by Region, 2017–2031
Table 06: North America Laboratory Gas Generators Market Value (US$ Mn) Forecast, by Country, 2017–2031
Table 07: North America Laboratory Gas Generators Market Value (US$ Mn) Forecast, by Product Type, 2017–2031
Table 08: North America Laboratory Gas Generators Market Value (US$ Mn) Forecast, by Application, 2017–2031
Table 09: North America Laboratory Gas Generators Market Value (US$ Mn) Forecast, by End-user, 2017–2031
Table 10: Europe Laboratory Gas Generators Market Value (US$ Mn) Forecast, by Country/Sub-region, 2017–2031
Table 11: Europe Laboratory Gas Generators Market Value (US$ Mn) Forecast, by Product Type, 2017–2031
Table 12: Europe Laboratory Gas Generators Market Value (US$ Mn) Forecast, by Application, 2017–2031
Table 13: Europe Laboratory Gas Generators Market Value (US$ Mn) Forecast, by End-user, 2017–2031
Table 14: Asia Pacific Laboratory Gas Generators Market Value (US$ Mn) Forecast, by Country/Sub-region, 2017–2031
Table 15: Asia Pacific Laboratory Gas Generators Market Value (US$ Mn) Forecast, by Product Type, 2017–2031
Table 16: Asia Pacific Laboratory Gas Generators Market Value (US$ Mn) Forecast, by Application, 2017–2031
Table 17: Asia Pacific Laboratory Gas Generators Market Value (US$ Mn) Forecast, by End-user, 2017–2031
Table 18: Latin America Laboratory Gas Generators Market Value (US$ Mn) Forecast, by Country/Sub-region, 2017–2031
Table 19: Latin America Laboratory Gas Generators Market Value (US$ Mn) Forecast, by Product Type, 2017–2031
Table 20: Latin America Laboratory Gas Generators Market Value (US$ Mn) Forecast, by Application, 2017–2031
Table 21: Latin America Laboratory Gas Generators Market Value (US$ Mn) Forecast, by End-user, 2017–2031
Table 22: Middle East & Africa Laboratory Gas Generators Market Value (US$ Mn) Forecast, by Country/Sub-region, 2017–2031
Table 23: Middle East & Africa Laboratory Gas Generators Market Value (US$ Mn) Forecast, by Product Type, 2017–2031
Table 24: Middle East & Africa Laboratory Gas Generators Market Value (US$ Mn) Forecast, by Application, 2017–2031
Table 25: Middle East & Africa Laboratory Gas Generators Market Value (US$ Mn) Forecast, by End-user, 2017–2031
List of Figures
Figure 01: Global Laboratory Gas Generators Market Value (US$ Mn) and Distribution, by Region, 2017 and 2031
Figure 02: Market Snapshot of Global Laboratory Gas Generators Market
Figure 03: Nitrogen (N400M) Generators (NEL), Brand Analysis
Figure 04: H Series Hydrogen Generators (NEL), Brand Analysis
Figure 05: Global Laboratory Gas Generators Market Value (US$ Mn) Forecast, 2022–2031
Figure 06: Global Laboratory Gas Generators Market Value Share, by Product Type, 2021
Figure 07: Global Laboratory Gas Generators Market Value Share, by Application, 2021
Figure 08: Global Laboratory Gas Generators Market Value Share, by End-user, 2021
Figure 09: Global Laboratory Gas Generators Market Value Share, by Region, 2021
Figure 10: Global Laboratory Gas Generators Market Value Share Analysis, by Product Type, 2021 and 2031
Figure 11: Global Laboratory Gas Generators Market Attractiveness Analysis, by Product Type, 2022–2031
Figure 12: Global Laboratory Gas Generators Market Value (US$ Mn) Forecast and Y-o-Y Growth (%) Projection, by Hydrogen Gas Generators, 2017–2031
Figure 13: Global Laboratory Gas Generators Market Value (US$ Mn) Forecast and Y-o-Y Growth (%) Projection, by Nitrogen Gas Generators, 2017–2031
Figure 14: Global Laboratory Gas Generators Market Value (US$ Mn) Forecast and Y-o-Y Growth (%) Projection, by Oxygen Gas Generators, 2017–2031
Figure 15: Global Laboratory Gas Generators Market Value (US$ Mn) Forecast and Y-o-Y Growth (%) Projection, by Zero Air Gas Generators, 2017–2031
Figure 16: Global Laboratory Gas Generators Market Value (US$ Mn) Forecast and Y-o-Y Growth (%) Projection, by Purge Gas Generators, 2017–2031
Figure 17: Global Laboratory Gas Generators Market Value (US$ Mn) Forecast and Y-o-Y Growth (%) Projection, by Others, 2017–2031
Figure 18: Global Laboratory Gas Generators Market Value Share Analysis, by Application, 2017 and 2031
Figure 19: Global Laboratory Gas Generators Market Attractiveness Analysis, by Application, 2022–2031
Figure 20: Global Laboratory Gas Generators Market Value (US$ Mn) Forecast and Y-o-Y Growth (%) Projection, by Gas Chromatography, 2017–2031
Figure 21: Global Laboratory Gas Generators Market Value (US$ Mn) Forecast and Y-o-Y Growth (%) Projection, by LC-MS, 2017–2031
Figure 22: Global Laboratory Gas Generators Market Value (US$ Mn) Forecast and Y-o-Y Growth (%) Projection, by Gas Analyzers, 2017–2031
Figure 23: Global Laboratory Gas Generators Market Value (US$ Mn) Forecast and Y-o-Y Growth (%) Projection, by Spectroscopy, 2017–2031
Figure 24: Global Laboratory Gas Generators Market Value (US$ Mn) Forecast and Y-o-Y Growth (%) Projection, by Others, 2017–2031
Figure 25: Global Laboratory Gas Generators Market Value Share Analysis, by End-user, 2021 and 2031
Figure 26: Global Laboratory Gas Generators Market Attractiveness Analysis, by End-user, 2022–2026
Figure 27: Global Laboratory Gas Generators Market Value (US$ Mn) Forecast and Y-o-Y Growth (%) Projection, by Chem/Petrochemical Companies, 2017–2031
Figure 28: Global Laboratory Gas Generators Market Value (US$ Mn) Forecast and Y-o-Y Growth (%) Projection, by Pharmaceutical & Biotechnology Companies, 2017–2031
Figure 29: Global Laboratory Gas Generators Market Value (US$ Mn) Forecast and Y-o-Y Growth (%) Projection, by Environmental Companies, 2017–2031
Figure 30: Global Laboratory Gas Generators Market Value (US$ Mn) Forecast and Y-o-Y Growth (%) Projection, by Food and Beverage Companies, 2017–2031
Figure 31: Global Laboratory Gas Generators Market Value (US$ Mn) Forecast and Y-o-Y Growth (%) Projection, by Others, 2017–2031
Figure 32: Global Laboratory Gas Generators Market Value Share (%), by Region, 2017 and 2031
Figure 33: Global Laboratory Gas Generators Market Attractiveness Analysis, by Region, 2022–2031
Figure 34: North America Laboratory Gas Generators Market Value (US$ Mn) Forecast, 2017–2031
Figure 35: North America Laboratory Gas Generators Market Value Share (%), by Country, 2017 and 2031
Figure 36: North America Laboratory Gas Generators Market Attractiveness Analysis, by Country, 2022–2031
Figure 37: North America Laboratory Gas Generators Market Value Share Analysis, by Product Type, 2017 and 2031
Figure 38: North America Laboratory Gas Generators Market Attractiveness Analysis, by Product Type, 2022–2031
Figure 39: North America Laboratory Gas Generators Market Value Share Analysis, by Application, 2017 and 2031
Figure 40: North America Laboratory Gas Generators Market Attractiveness Analysis, by Application, 2022–2031
Figure 41: North America Laboratory Gas Generators Market Value Share Analysis, by End-user, 2021 and 2031
Figure 42: North America Laboratory Gas Generators Market Attractiveness Analysis, by End-user, 2022–2031
Figure 43: Europe Laboratory Gas Generators Market Value (US$ Mn) Forecast, 2017–2031
Figure 44: Europe Laboratory Gas Generators Market Value Share (%), by Country/Sub-region, 2017 and 2031
Figure 45: Europe Laboratory Gas Generators Market Attractiveness Analysis, by Country/Sub-region, 2022–2031
Figure 46: Europe Laboratory Gas Generators Market Value Share Analysis, by Product Type, 2017 and 2031
Figure 47: Europe Laboratory Gas Generators Market Attractiveness Analysis, by Product Type, 2022–2031
Figure 48: Europe Laboratory Gas Generators Market Value Share Analysis, by Application, 2017 and 2031
Figure 49: Europe Laboratory Gas Generators Market Attractiveness Analysis, by Application, 2022–2031
Figure 50: Europe Laboratory Gas Generators Market Value Share Analysis, by End-user, 2021 and 2031
Figure 51: Europe Laboratory Gas Generators Market Attractiveness Analysis, by End-user, 2022–2031
Figure 52: Asia Pacific Laboratory Gas Generators Market Value (US$ Mn) Forecast, 2017–2031
Figure 53: Asia Pacific Laboratory Gas Generators Market Value Share (%), by Country/Sub-region, 2017 and 2031
Figure 54: Asia Pacific Laboratory Gas Generators Market Attractiveness Analysis, by Country/Sub-region, 2022–2031
Figure 55: Asia Pacific Laboratory Gas Generators Market Value Share Analysis, by Product Type, 2017 and 2031
Figure 56: Asia Pacific Laboratory Gas Generators Market Attractiveness Analysis, by Product Type, 2022–2031
Figure 57: Asia Pacific Laboratory Gas Generators Market Value Share Analysis, by Application, 2017 and 2031
Figure 58: Asia Pacific Laboratory Gas Generators Market Attractiveness Analysis, by Application, 2022–2031
Figure 59: Asia Pacific Laboratory Gas Generators Market Value Share Analysis, by End-user, 2021 and 2031
Figure 60: Asia Pacific Laboratory Gas Generators Market Attractiveness Analysis, by End-user, 2022–2031
Figure 61: Latin America Laboratory Gas Generators Market Value (US$ Mn) Forecast, 2017–2031
Figure 62: Latin America Laboratory Gas Generators Market Value Share (%), by Country/Sub-region, 2017 and 2031
Figure 63: Latin America Laboratory Gas Generators Market Attractiveness Analysis, by Country/Sub-region, 2022–2031
Figure 64: Latin America Laboratory Gas Generators Market Value Share Analysis, by Product Type, 2017 and 2031
Figure 65: Latin America Laboratory Gas Generators Market Attractiveness Analysis, by Product Type, 2022–2031
Figure 66: Latin America Laboratory Gas Generators Market Value Share Analysis, by Application, 2017 and 2031
Figure 67: Latin America Laboratory Gas Generators Market Attractiveness Analysis, by Application, 2022–2031
Figure 68: Latin America Laboratory Gas Generators Market Value Share Analysis, by End-user, 2021 and 2031
Figure 69: Latin America Laboratory Gas Generators Market Attractiveness Analysis, by End-user, 2022–2031
Figure 70: Middle East & Africa Laboratory Gas Generators Market Value (US$ Mn) Forecast, 2017–2031
Figure 71: Middle East & Africa Laboratory Gas Generators Market Value Share (%), by Country/Sub-region, 2017 and 2027
Figure 72: Middle East & Africa Laboratory Gas Generators Market Attractiveness Analysis, by Country/Sub-region, 2022–2031
Figure 73: Middle East & Africa Laboratory Gas Generators Market Value Share Analysis, by Product Type, 2017 and 2031
Figure 74: Middle East & Africa Laboratory Gas Generators Market Attractiveness Analysis, by Product Type, 2022–2031
Figure 75: Middle East & Africa Laboratory Gas Generators Market Value Share Analysis, by Application, 2017 and 2031
Figure 76: Middle East & Africa Laboratory Gas Generators Market Attractiveness Analysis, by Application, 2022–2031
Figure 77: Middle East & Africa Laboratory Gas Generators Market Value Share Analysis, by End-user, 2021 and 2031
Figure 78: Middle East & Africa Laboratory Gas Generators Market Attractiveness Analysis, by End-user, 2022–2031
Figure 79: Global Laboratory Gas Generators Market Share, by Company, 2021
Copyright © Transparency Market Research, Inc. All Rights reserved
Trust Online

Laboratory Gas Generators Market