
Reports
Reports
Touchscreen displays act as an interaction point between various service providers and their end-users and help in enhancing and simplifying user experience while reducing labor costs for service providers. Touchscreen displays use resistive touch, capacitive touch, surface acoustic wave, and infrared technology to act as an interface between service providers and end-users. The industrial touchscreen display market is witnessing significant growth, due to rapid changes in technologies in the industrial PC sector. The automotive manufacturing industry requires highly reliable touchscreen panels, as the industry needs displays with better durability, reliability, and ruggedness. The global industrial touchscreen display market is projected to reach value of US$ 1,462.5 Mn by 2026, expanding at a significant growth rate of 6.5% during the forecast period.
Advancements in technology and growing need to enhance end-user experience have prompted various industry verticals to deploy industrial touchscreen terminals. This deployment aims to improve end-user interaction through superior engagement platforms. Additionally, with rising labor costs, need for employing cost-effective solutions to cut labor costs is increasing. These factors are likely to drive the global industrial touchscreen display market during the forecast period. However, low availability of raw materials and their increasing costs are affecting prices of industrial touchscreen displays. This is acting as a hurdle in the adoption of the touchscreen display technology.
The industrial touchscreen display market has been segmented based on touchscreen type, component, end-use industry, and geography. Based on touchscreen type, the market has been divided into resistive, capacitive, surface acoustic wave, infrared, and others (including optical imaging and near-field imaging). In 2017, the resistive segment accounted for the maximum market share. This is because the resistive touchscreen technology is designed for rugged industrial applications and it can detect touch through materials such as gloves. However, the capacitive segment is expected to expand at a significant growth rate during the forecast period, owing to numerous advantages such as scratch resistance, high durability, and multi-touch function offered by the capacitive touchscreen technology over its counterparts.
In terms of component, the market has been classified into hardware and software. The hardware segment has been sub-categorized into display, touch sensor, and controller. In 2017, the display sub-segment accounted for nearly 54% share of the hardware segment of the market. This is primarily attributable to rising demand for next-generation display technologies such as LCD, LED, OLED, and others. The cost of display plays a key role in determining the cost of a panel.
Based on end-use industry, the industrial touchscreen display market has been segmented into oil & gas, chemical, food & beverages, mining & metal, automotive, and others. In 2017, the automotive segment accounted for the maximum market share. The food & beverages segment is projected to expand at a significant CAGR during the forecast period. This is primarily attributable to high demand for next-generation advanced touchscreen panels from the food & beverages industry for use in food processing applications.
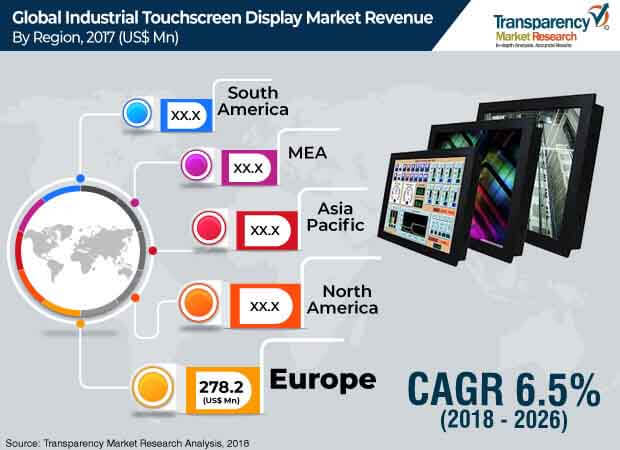
In terms of geography, the global industrial touchscreen display market has been classified into North America, Europe, Asia Pacific, Middle East & Africa, and South America. Europe holds a major share of the global market, followed by North America and Asia Pacific. Being a technologically advanced region, Europe is projected to continue its dominance from 2018 to 2026. Furthermore, the market in Asia Pacific is expected to expand rapidly between 2018 and 2026, due to ongoing technological innovations in the region. The market in Middle East & Africa is estimated to witness growth at a moderate rate during the forecast period. The industrial touchscreen display market in South America is expected to witness sluggish growth from 2018 to 2026.
The global industrial touchscreen display market is dominated by players such as Advantech Co., Ltd, Cypress Semiconductor Corporation, Dell, Inc., B&R Industrial Automation GmbH, Elo Touch Solutions, Inc., Fujitsu Ltd., Hewlett Packard Enterprise, LG Electronics, Panasonic Corporation, Planar Systems, Kontron AG, Schneider Electric S.E., Siemens AG, Beckhoff Automation GmbH & Co. KG, Captec Ltd., and American Industrial Systems.
Industrial Touchscreen Display Market to Gather Huge Revenues from Automobile Industries
The automotive industry requires exceptionally reliable touchscreen boards, as the business needs displays with dependability, roughness, and better strength. Touchscreen displays go about as a cooperation point between different specialist co-ops and their end-clients and help in upgrading and working on client experience while diminishing work costs for specialist organizations. Touchscreen displays utilize resistive touch, capacitive touch, surface acoustic wave, and infrared innovation to go about as a connection between specialist organizations and end-clients. Rapid changes in innovations in the industrial PC area will further add impetus to the overall growth of the market.
Development of the industrial touchscreen display market is fundamentally inferable from headways in innovation and expansion in the need to upgrade end-client experience. Also, the popularity of such displays across enterprises like car assembling and food and drinks is required to move the global market in the future years.
Headways in innovation and developing need to upgrade end-client experience have incited different industry verticals to convey industrial touchscreen terminals. This organization means to improve end-client association through predominant commitment stages. Also, with rising work costs, need for utilizing financially savvy answers for cut work costs is expanding. These components are probably going to drive this market. In any case, low accessibility of crude materials and their expanding costs are influencing costs of industrial touchscreen displays. This may be considered as an obstacle in the reception of the touchscreen display innovation.
Regarding topography, the worldwide industrial touchscreen display market is overwhelmed by Europe, trailed by North America and Asia Pacific. This is essentially because of innovative progressions in the area. Besides, presence of countless producers of display boards in North America has made it a noticeable district of the worldwide industrial touchscreen display market. Besides this, change of registering stages and digitalization is an expanding pattern that this market is probably going to observer in the following not many years.
1. Preface
1.1. Market Definition and Scope
1.2. Market Segmentation
1.3. Key Research Objectives
1.4. Research Highlights
2. Assumptions and Research Methodology
3. Executive Summary: Global Industrial Touchscreen Display Market
4. Market Overview
4.1. Introduction
4.2. Market Dynamics
4.2.1. Drivers
4.2.2. Restraints
4.2.3. Opportunities
4.3. Key Market Indicators
4.4. Key Technological Trends
4.5. Price Trend Analysis
4.6. Global Industrial Touchscreen Display Market Analysis and Forecast, 2016–2026
4.6.1. Market Revenue Analysis (US$ Mn)
4.6.2. Market Volume Analysis (Thousand Units)
4.7. Porter’s Five Forces Analysis
4.8. Value Chain Analysis
4.9. Market Outlook
5. Global Industrial Touchscreen Display Market Analysis and Forecast, by Touchscreen Type
5.1. Overview
5.2. Global Industrial Touchscreen Display Market Size (US$ Mn and Thousand Units) Forecast, by Touchscreen Type, 2016–2026
5.2.1. Resistive
5.2.2. Capacitive
5.2.3. Surface Acoustic Wave
5.2.4. Infrared
5.2.5. Others (Including Optical Imaging and NFI)
5.3. Global Industrial Touchscreen Display Market Attractiveness, by Touchscreen Type
6. Global Industrial Touchscreen Display Market Analysis and Forecast, By Component
6.1. Overview
6.2. Global Industrial Touchscreen Display Market Value (US$ Mn) Forecast, by Component, 2016–2026
6.2.1. Hardware
6.2.1.1. Display
6.2.1.2. Touch Sensor
6.2.1.3. Controller
6.2.2. Software
6.3. Global Industrial Touchscreen Display Market Attractiveness, by Component
7. Global Industrial Touchscreen Display Market Analysis and Forecast, by End-use Industry
7.1. Overview & Definition
7.2. Global Industrial Touchscreen Display Market Size (US$ Mn and Thousand Units) Forecast, by End-use Industry, 2016–2026
7.2.1. Oil & Gas
7.2.2. Chemical
7.2.3. Food & Beverages
7.2.4. Mining & Metal
7.2.5. Automotive
7.2.6. Others (Including Rubber, Plastics, and Paper & Pulp)
7.3. Global Industrial Touchscreen Display Market Attractiveness, by End-use Industry
8. Global Industrial Touchscreen Display Market Analysis and Forecast, by Region
8.1. Key Findings
8.2. Global Industrial Touchscreen Display Market Value (US$ Mn) Forecast, by Region, 2016–2026
8.2.1. North America
8.2.2. Europe
8.2.3. Asia Pacific
8.2.4. Middle East & Africa
8.2.5. South America
8.3. Global Industrial Touchscreen Display Market Attractiveness, by Region/Country
9. North America Industrial Touchscreen Display Market Analysis and Forecast
9.1. Key Finding
9.2. Key Trends Impact Analysis
9.3. Price Trend Analysis
9.4. North America Industrial Touchscreen Display Market Size (US$ Mn and Thousand Units) Forecast, by Touchscreen Type, 2016–2026
9.4.1. Resistive
9.4.2. Capacitive
9.4.3. Surface Acoustic Wave
9.4.4. Infrared
9.4.5. Others (Including Optical Imaging and NFI)
9.5. North America Industrial Touchscreen Display Market Value (US$ Mn) Forecast, by Component, 2016–2026
9.5.1. Hardware
9.5.1.1. Display
9.5.1.2. Touch Sensor
9.5.1.3. Controller
9.5.2. Software
9.6. North America Industrial Touchscreen Display Market Size (US$ Mn and Thousand Units) Forecast, by End-use Industry, 2016–2026
9.6.1. Oil & Gas
9.6.2. Chemical
9.6.3. Food & Beverages
9.6.4. Mining & Metal
9.6.5. Automotive
9.6.6. Others (Including Rubber, Plastics, and Paper & Pulp)
9.7. North America Industrial Touchscreen Display Market Size (US$ Mn and Thousand Units) Forecast, by Country/Sub-region, 2016–2026
9.7.1. U.S.
9.7.2. Canada
9.7.3. Rest of North America
9.8. North America Industrial Touchscreen Display Market Attractiveness Analysis
9.8.1. by Touchscreen Type
9.8.2. by Component
9.8.3. by End-use Industry
9.8.4. by Country/Sub-region
10. Europe Industrial Touchscreen Display Market Analysis and Forecast
10.1. Key Finding
10.2. Key Trends Impact Analysis
10.3. Price Trend Analysis
10.4. Europe Industrial Touchscreen Display Market Size (US$ Mn and Thousand Units) Forecast, by Touchscreen Type, 2016–2026
10.4.1. Resistive
10.4.2. Capacitive
10.4.3. Surface Acoustic Wave
10.4.4. Infrared
10.4.5. Others (Including Optical Imaging and NFI)
10.5. Europe Industrial Touchscreen Display Market Value (US$ Mn) Forecast, by Component, 2016–2026
10.5.1. Hardware
10.5.1.1. Display
10.5.1.2. Touch Sensor
10.5.1.3. Controller
10.5.2. Software
10.6. Europe Industrial Touchscreen Display Market Size (US$ Mn and Thousand Units) Forecast, by End-use Industry, 2016–2026
10.6.1. Oil & Gas
10.6.2. Chemical
10.6.3. Food & Beverages
10.6.4. Mining & Metal
10.6.5. Automotive
10.6.6. Others (Including Rubber, Plastics, and Paper & Pulp)
10.7. Europe Industrial Touchscreen Display Market Size (US$ Mn and Thousand Units) Forecast, by Country/Sub-region, 2016–2026
10.7.1. U.K.
10.7.2. France
10.7.3. Germany
10.7.4. Rest of Europe
10.8. Europe Industrial Touchscreen Display Market Attractiveness Analysis
10.8.1. by Touchscreen Type
10.8.2. by Component
10.8.3. by End-use Industry
10.8.4. by Country/Sub-region
11. Asia Pacific Industrial Touchscreen Display Market Analysis and Forecast
11.1. Key Finding
11.2. Key Trends Impact Analysis
11.3. Price Trend Analysis
11.4. Asia Pacific Industrial Touchscreen Display Market Size (US$ Mn and Thousand Units) Forecast, by Touchscreen Type, 2016–2026
11.4.1. Resistive
11.4.2. Capacitive
11.4.3. Surface Acoustic Wave
11.4.4. Infrared
11.4.5. Others (Including Optical Imaging and NFI)
11.5. Asia Pacific Industrial Touchscreen Display Market Value (US$ Mn) Forecast, by Component, 2016–2026
11.5.1. Hardware
11.5.1.1. Display
11.5.1.2. Touch Sensor
11.5.1.3. Controller
11.5.2. Software
11.6. Asia Pacific Industrial Touchscreen Display Market Size (US$ Mn and Thousand Units) Forecast, by End-use Industry, 2016–2026
11.6.1. Oil & Gas
11.6.2. Chemical
11.6.3. Food & Beverages
11.6.4. Mining & Metal
11.6.5. Automotive
11.6.6. Others (Including Rubber, Plastics, and Paper & Pulp)
11.7. Asia Pacific Industrial Touchscreen Display Market Size (US$ Mn and Thousand Units) Forecast, by Country/Sub-region, 2016–2026
11.7.1. China
11.7.2. India
11.7.3. Japan
11.7.4. South Korea
11.7.5. Rest of Asia Pacific
11.8. Asia Pacific Industrial Touchscreen Display Market Attractiveness Analysis
11.8.1. by Touchscreen Type
11.8.2. by Component
11.8.3. by End-use Industry
11.8.4. by Country/Sub-region
12. Middle East & Africa Industrial Touchscreen Display Market Analysis and Forecast
12.1. Key Finding
12.2. Key Trends Impact Analysis
12.3. Price Trend Analysis
12.4. Middle East & Africa Industrial Touchscreen Display Market Size (US$ Mn and Thousand Units) Forecast, by Touchscreen Type, 2016–2026
12.4.1. Resistive
12.4.2. Capacitive
12.4.3. Surface Acoustic Wave
12.4.4. Infrared
12.4.5. Others (Including Optical Imaging and NFI)
12.5. Middle East & Africa Industrial Touchscreen Display Market Value (US$ Mn) Forecast, by Component, 2016–2026
12.5.1. Hardware
12.5.1.1. Display
12.5.1.2. Touch Sensor
12.5.1.3. Controller
12.5.2. Software
12.6. Middle East & Africa Industrial Touchscreen Display Market Size (US$ Mn and Thousand Units) Forecast, by End-use Industry, 2016–2026
12.6.1. Oil & Gas
12.6.2. Chemical
12.6.3. Food & Beverages
12.6.4. Mining & Metal
12.6.5. Automotive
12.6.6. Others (Including Rubber, Plastics, and Paper & Pulp)
12.7. Middle East & Africa Industrial Touchscreen Display Market Size (US$ Mn and Thousand Units) Forecast, by Country/Sub-region, 2016–2026
12.7.1. GCC
12.7.2. South Africa
12.7.3. Rest of Middle East & Africa
12.8. Middle East & Africa Industrial Touchscreen Display Market Attractiveness Analysis
12.8.1. by Touchscreen Type
12.8.2. by Component
12.8.3. by End-use Industry
12.8.4. by Country/Sub-region
13. South America Industrial Touchscreen Display Market Analysis and Forecast
13.1. Key Finding
13.2. Key Trends Impact Analysis
13.3. Price Trend Analysis
13.4. South America Industrial Touchscreen Display Market Size (US$ Mn and Thousand Units) Forecast, by Touchscreen Type, 2016–2026
13.4.1. Resistive
13.4.2. Capacitive
13.4.3. Surface Acoustic Wave
13.4.4. Infrared
13.4.5. Others (Including Optical Imaging and NFI)
13.5. South America Industrial Touchscreen Display Market Value (US$ Mn) Forecast, by Component, 2016–2026
13.5.1. Hardware
13.5.1.1. Display
13.5.1.2. Touch Sensor
13.5.1.3. Controller
13.5.2. Software
13.6. South America Industrial Touchscreen Display Market Size (US$ Mn and Thousand Units) Forecast, by End-use Industry, 2016–2026
13.6.1. Oil & Gas
13.6.2. Chemical
13.6.3. Food & Beverages
13.6.4. Mining & Metal
13.6.5. Automotive
13.6.6. Others (Including Rubber, Plastics, and Paper & Pulp)
13.7. South America Industrial Touchscreen Display Market Size (US$ Mn and Thousand Units) Forecast, by Region/Country, 2016–2026
13.7.1. Brazil
13.7.2. Rest of South America
13.8. South America Industrial Touchscreen Display Market Attractiveness Analysis
13.8.1. by Touchscreen Type
13.8.2. by Component
13.8.3. by End-use Industry
13.8.4. by Country/Sub-region
14. Competition Landscape
14.1. Market Players – Competition Matrix
14.2. Global Industrial Touchscreen Display Market Revenue Share Analysis (%), by Company (2017)
14.3. Company Profiles (Details – Basic Overview, Manufacturing Base, Sales Area/Geographical Presence, Key Competitors, Revenue, SWOT Analysis, Strategy)
14.3.1. Advantech Co., Ltd.
14.3.2. Cypress Semiconductor Corporation
14.3.3. Dell Inc.
14.3.4. B&R Industrial Automation GmbH
14.3.5. Elo Touch Solutions, Inc.
14.3.6. Fujitsu Ltd.
14.3.7. Hewlett Packard Enterprise
14.3.8. LG Electronics
14.3.9. Panasonic Corporation
14.3.10. Planar Systems
14.3.11. Kontron AG
14.3.12. Schneider Electric S.E.
14.3.13. Siemens AG
14.3.14. Beckhoff Automation GmbH & Co. KG
14.3.15. Captec Ltd.
14.3.16. American Industrial Systems
15. Key Takeaways
List of Tables
Table 1: Global Industrial Touchscreen Display Market Value (US$ Mn) Forecast, by Touchscreen Type, 2016–2026
Table 2: Global Industrial Touchscreen Display Market Volume (Thousand Units) Forecast, by Touchscreen Type, 2016–2026
Table 3: Short-term and Long-term CAGR Analysis
Table 4: Global Industrial Touchscreen Display Market Value (US$ Mn) Forecast, by Component, 2016–2026
Table 5: Short-term and Long-term CAGR Analysis
Table 6: Global Industrial Touchscreen Display Market Value (US$ Mn) Forecast, by End-use Industry, 2016–2026
Table 7: Global Industrial Touchscreen Display Market Volume (Thousand Units) Forecast, by End-use Industry, 2016–2026
Table 8: Short-term and Long-term CAGR Analysis
Table 9: Global Industrial Touchscreen Display Market Value (US$ Mn) Forecast, by Country/Sub-region, 2016–2026
Table 10: Global Industrial Touchscreen Display Market Volume (Thousand Units) Forecast, by Country/Sub-region, 2016–2026
Table 11: North America Industrial Touchscreen Display Market Value (US$ Mn) Forecast, by Touchscreen Type, 2016–2026
Table 12: North America Industrial Touchscreen Display Market Volume (Thousand Units) Forecast, by Touchscreen Type, 2016–2026
Table 13: Short-term and Long-term CAGR Analysis
Table 14: North America Industrial Touchscreen Display Market Value (US$ Mn) Forecast, by Component, 2016–2026
Table 15: Short-term and Long-term CAGR Analysis
Table 16: North America Industrial Touchscreen Display Market Value (US$ Mn) Forecast, by End-use Industry, 2016–2026
Table 17: North America Industrial Touchscreen Display Market Volume (Thousand Units) Forecast, by End-use Industry, 2016–2026
Table 18: Short-term and Long-term CAGR Analysis
Table 19: North America Industrial Touchscreen Display Market Value (US$ Mn) Forecast, by Country/Sub-region, 2016–2026
Table 20: North America Industrial Touchscreen Display Market Volume (Thousand Units) Forecast, by Country/Sub-region, 2016–2026
Table 21: Short-term and Long-term CAGR Analysis
Table 22: Europe Industrial Touchscreen Display Market Value (US$ Mn) Forecast, by Touchscreen Type, 2016–2026
Table 23: Europe Industrial Touchscreen Display Market Volume (Thousand Units) Forecast, by Touchscreen Type, 2016–2026
Table 24: Short-term and Long-term CAGR Analysis
Table 25: Europe Industrial Touchscreen Display Market Value (US$ Mn) Forecast, by Component, 2016–2026
Table 26: Short-term and Long-term CAGR Analysis
Table 27: Europe Industrial Touchscreen Display Market Value (US$ Mn) Forecast, by End-use Industry, 2016–2026
Table 28: Europe Industrial Touchscreen Display Market Volume (Thousand Units) Forecast, by End-use Industry, 2016–2026
Table 29: Short-term and Long-term CAGR Analysis
Table 30: Europe Industrial Touchscreen Display Market Value (US$ Mn) Forecast, by Country/Sub-region, 2016–2026
Table 31: Europe Industrial Touchscreen Display Market Volume (Thousand Units) Forecast, by Country/Sub-region, 2016–2026
Table 32: Short-term and Long-term CAGR Analysis
Table 33: Asia Pacific Industrial Touchscreen Display Market Value (US$ Mn) Forecast, by Touchscreen Type, 2016–2026
Table 34: Asia Pacific Industrial Touchscreen Display Market Volume (Thousand Units) Forecast, by Touchscreen Type, 2016–2026
Table 35: Short-term and Long-term CAGR Analysis
Table 36: Asia Pacific Industrial Touchscreen Display Market Value (US$ Mn) Forecast, by Component, 2016–2026
Table 37: Short-term and Long-term CAGR Analysis
Table 38: Asia Pacific Industrial Touchscreen Display Market Value (US$ Mn) Forecast, by End-use Industry, 2016–2026
Table 39: Asia Pacific Industrial Touchscreen Display Market Volume (Thousand Units) Forecast, by End-use Industry, 2016–2026
Table 40: Short-term and Long-term CAGR Analysis
Table 41: Asia Pacific Industrial Touchscreen Display Market Value (US$ Mn) Forecast, by Country/Sub-region, 2016–2026
Table 42: Asia Pacific Industrial Touchscreen Display Market Volume (Thousand Units) Forecast, by Country/Sub-region, 2016–2026
Table 43: Short-term and Long-term CAGR Analysis
Table 44: MEA Industrial Touchscreen Display Market Value (US$ Mn) Forecast, by Touchscreen Type, 2016–2026
Table 45: MEA Industrial Touchscreen Display Market Volume (Thousand Units) Forecast, by Touchscreen Type, 2016–2026
Table 46: Short-term and Long-term CAGR Analysis
Table 47: MEA Industrial Touchscreen Display Market Value (US$ Mn) Forecast, by Component, 2016–2026
Table 48: Short-term and Long-term CAGR Analysis
Table 49: MEA Industrial Touchscreen Display Market Value (US$ Mn) Forecast, by End-use Industry, 2016–2026
Table 50: MEA Industrial Touchscreen Display Market Volume (Thousand Units) Forecast, by End-use Industry, 2016–2026
Table 51: Short-term and Long-term CAGR Analysis
Table 52: MEA Industrial Touchscreen Display Market Value (US$ Mn) Forecast, by Country/Sub-region, 2016–2026
Table 53: MEA Industrial Touchscreen Display Market Volume (Thousand Units) Forecast, by Country/Sub-region, 2016–2026
Table 54: Short-term and Long-term CAGR Analysis
Table 55: South America Industrial Touchscreen Display Market Value (US$ Mn) Forecast, by Touchscreen Type, 2016–2026
Table 56: South America Industrial Touchscreen Display Market Volume (Thousand Units) Forecast, by Touchscreen Type, 2016–2026
Table 57: Short-term and Long-term CAGR Analysis
Table 58: South America Industrial Touchscreen Display Market Value (US$ Mn) Forecast, by Component, 2016–2026
Table 59: Short-term and Long-term CAGR Analysis
Table 60: South America Industrial Touchscreen Display Market Value (US$ Mn) Forecast, by End-use Industry, 2016–2026
Table 61: South America Industrial Touchscreen Display Market Volume (Thousand Units) Forecast, by End-use Industry, 2016–2026
Table 62: Short-term and Long-term CAGR Analysis
Table 63: South America Industrial Touchscreen Display Market Value (US$ Mn) Forecast, by Country/Sub-region, 2016–2026
Table 64: South America Industrial Touchscreen Display Market Volume (Thousand Units) Forecast, by Country/Sub-region, 2016–2026
Table 65: Short-term and Long-term CAGR Analysis
List of Figures
Figure 1: Executive Summary
Figure 2: Industrial PC Market Value (US$ Mn) Forecast, 2016–2026
Figure 3: Global Industrial Touchscreen Display Price Trend Analysis, by Touchscreen Type, 2017–2026
Figure 4: Global Industrial Touchscreen Display Market Revenue (US$ Mn) and Volume (Thousand Units) Forecast and Y-o-Y Growth Projection, 2016–2026
Figure 5: Porter’s Five Forces Analysis
Figure 6: Value Chain Analysis
Figure 7: Global Industrial Touchscreen Display Market Outlook
Figure 8: Global Industrial Touchscreen Display Market Value Share Analysis, by Touchscreen Type, 2018 and 2026
Figure 9: Global Industrial Touchscreen Display Market Comparison Matrix, by Touchscreen Type
Figure 10: Global Industrial Touchscreen Display Market Attractiveness Analysis, by Touchscreen Type
Figure 11: Global Industrial Touchscreen Display Market Value Share Analysis, by Component, 2018 and 2026
Figure 12: Global Industrial Touchscreen Display Market Comparison Matrix, by Component
Figure 13: Global Industrial Touchscreen Display Market Attractiveness Analysis, by Component
Figure 14: Global Industrial Touchscreen Display Market Value Share Analysis, by End-use Industry, 2018 and 2026
Figure 15: Global Industrial Touchscreen Display Market Comparison Matrix, by End-use Industry
Figure 16: Global Industrial Touchscreen Display Market Attractiveness Analysis, by End-use Industry
Figure 17: Global Industrial Touchscreen Display Market, by Region: Snapshot (2018E)
Figure 18: Global Industrial Touchscreen Display Market Attractiveness Analysis, by Region
Figure 19: North America Industrial Touchscreen Display Price Trend Analysis, by Touchscreen Type, 2017–2026
Figure 20: North America Industrial Touchscreen Display Market Value Share Analysis, by Touchscreen Type, 2018 and 2026
Figure 21: North America Industrial Touchscreen Display Market Value Share Analysis, by Component, 2018 and 2026
Figure 22: North America Industrial Touchscreen Display Market Value Share Analysis, by End-use Industry, 2018 and 2026
Figure 23: North America Industrial Touchscreen Display Market Value Share Analysis, by Country/Sub-region, 2018 and 2026
Figure 24: North America Industrial Touchscreen Display Market Attractiveness Analysis, by Touchscreen Type
Figure 25: North America Industrial Touchscreen Display Market Attractiveness Analysis, by Component
Figure 26: North America Industrial Touchscreen Display Market Attractiveness Analysis, by Country/Sub-region
Figure 27: North America Industrial Touchscreen Display Market Attractiveness Analysis, by End-use Industry
Figure 28: Europe Industrial Touchscreen Display Price Trend Analysis, by Touchscreen Type, 2017–2026
Figure 29: Europe Industrial Touchscreen Display Market Value Share Analysis, by Touchscreen Type, 2018 and 2026
Figure 30: Europe Industrial Touchscreen Display Market Value Share Analysis, by Component, 2018 and 2026
Figure 31: Europe Industrial Touchscreen Display Market Value Share Analysis, by End-use Industry, 2018 and 2026
Figure 32: Europe Industrial Touchscreen Display Market Value Share Analysis, by Country/Sub-region, 2018 and 2026
Figure 33: Europe Industrial Touchscreen Display Market Attractiveness Analysis, by Touchscreen Type
Figure 34: Europe Industrial Touchscreen Display Market Attractiveness Analysis, by Component
Figure 35: Europe Industrial Touchscreen Display Market Attractiveness Analysis, by Country/Sub-region
Figure 36: Europe Industrial Touchscreen Display Market Attractiveness Analysis, by End-use Industry
Figure 37: Asia Pacific Industrial Touchscreen Display Price Trend Analysis, by Touchscreen Type, 2017–2026
Figure 37: Asia Pacific Industrial Touchscreen Display Market Value Share Analysis, by Touchscreen Type, 2018 and 2026
Figure 38: Asia Pacific Industrial Touchscreen Display Market Value Share Analysis, by Component, 2018 and 2026
Figure 39: Asia Pacific Industrial Touchscreen Display Market Value Share Analysis, by End-use Industry, 2018 and 2026
Figure 40: Asia Pacific Industrial Touchscreen Display Market Value Share Analysis, by Country/Sub-region, 2018 and 2026
Figure 41: Asia Pacific Industrial Touchscreen Display Market Attractiveness Analysis, by Touchscreen Type
Figure 42: Asia Pacific Industrial Touchscreen Display Market Attractiveness Analysis, by Component
Figure 43: Asia Pacific Industrial Touchscreen Display Market Attractiveness Analysis, by Country/Sub-region
Figure 44: Asia Pacific Industrial Touchscreen Display Market Attractiveness Analysis, by End-use Industry
Figure 45: MEA Industrial Touchscreen Display Price Trend Analysis, by Touchscreen Type, 2017–2026
Figure 46: MEA Industrial Touchscreen Display Market Value Share Analysis, by Touchscreen Type, 2018 and 2026
Figure 47: MEA Industrial Touchscreen Display Market Value Share Analysis, by Component, 2018 and 2026
Figure 48: MEA Industrial Touchscreen Display Market Value Share Analysis, by End-use Industry, 2018 and 2026
Figure 49: MEA Industrial Touchscreen Display Market Value Share Analysis, by Country/Sub-region, 2018 and 2026
Figure 50: MEA Industrial Touchscreen Display Market Attractiveness Analysis, by Touchscreen Type
Figure 51: MEA Industrial Touchscreen Display Market Attractiveness Analysis, by Component
Figure 52: MEA Industrial Touchscreen Display Market Attractiveness Analysis, by Country/Sub-region
Figure 53: MEA Industrial Touchscreen Display Market Attractiveness Analysis, by End-use Industry
Figure 54: South America Industrial Touchscreen Display Price Trend Analysis, by Touchscreen Type, 2017–2026
Figure 55: South America Industrial Touchscreen Display Market Value Share Analysis, by Touchscreen Type, 2018 and 2026
Figure 56: South America Industrial Touchscreen Display Market Value Share Analysis, by Component, 2018 and 2026
Figure 57: South America Industrial Touchscreen Display Market Value Share Analysis, by End-use Industry, 2018 and 2026
Figure 58: South America Industrial Touchscreen Display Market Value Share Analysis, by Country/Sub-region, 2018 and 2026
Figure 59: South America Industrial Touchscreen Display Market Attractiveness Analysis, by Touchscreen Type
Figure 60: South America Industrial Touchscreen Display Market Attractiveness Analysis, by Component
Figure 61: South America Industrial Touchscreen Display Market Attractiveness Analysis, by Country/Sub-region
Figure 62: South America Industrial Touchscreen Display Market Attractiveness Analysis, by End-use Industry
Figure 63: Global Industrial Touchscreen Display Market Share Analysis, by Company (2017)
Copyright © Transparency Market Research, Inc. All Rights reserved
Trust Online

Industrial Touchscreen Display Market