
Reports
Reports
The increasing focus of fitness conscious consumers on changing lifestyles to live healthy has created a significant demand for hygienic and aseptic valves. These valves are predominantly being used for eliminating preservatives that are used on making several food items and beverages. The growing awareness about the negative impact preservatives is expected encourage the uptake of these valves in the food and beverages industry. According to the research report, the global hygienic and aseptic valve market was worth US$6.0 bn in 2015 and is expected to reach US$9.0 bn by the end of 2025. During the forecast period of 2016 and 2025, the market is expected to witness an expansion at a CAGR of 4.8%.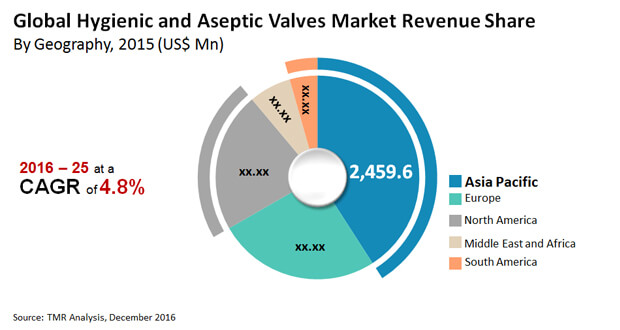
The global hygienic and aseptic valves market’s growth will also be supported by the increasing emphasis on sanitary regulations established by the food and beverage industry. The growing awareness amongst manufacturers to ensure food safety practices is also projected to boost the demand for these valves. The rising compliance of small-and medium-sized businesses towards these food safety regulations has also augmented the demand for hygienic and aseptic valves. Efforts to automate and modernize manufacturing plants to meet the ever-increasing needs of consumers has bolstered the uptake of hygienic and aseptic valves across the world.
On the basis of application, the global hygienic and aseptic valve market is segmented into dairy processing, food processing, beverage, pharmaceuticals, and biotechnology. Out of these applications, the beverage application segment held a lion’s share in the global market in 2015. In terms of revenue, the market held a share of 32%. Analysts anticipate that the pharmaceuticals application segment is poised to witness a remarkable growth rate in the coming years as several nations grapple to satisfy the medical needs of patients. Owing to this reason, the pharmaceutical application segment will show a sustained demand for hygienic and aseptic valves for the purpose of sanitation that is required in drug manufacturing processes.
In terms of geography, the global market is segmented into North America, Asia Pacific, Europe, the Middle East and Africa, and South America. Analysts project that Asia Pacific will be the dominant user of hygienic and aseptic valves throughout the forecast period. In 2015, the region held a whopping share of 40% in the overall market, which was followed by Europe and the U.S., which held 26% and 22% of the global market revenue respectively. The demand for hygienic and aseptic valve in Asia Pacific will be driven by the booming manufacturing activities that are focused on achieving operational excellence and energy efficiency.
Some of the leading players operating in the global hygienic and aseptic valves market are ITT Corporation, SPX Flow, Inc., Cipriani Harrison Valves Corporation, Pentair Plc, GEA Group AG, Alfa Laval AB, Evoguard GmbH, M&S Armaturen GmbH, Zhejiang Yuanan Liquid Equipment Co., Ltd., Nocado GmbH, Kieselmann Fluid Process Group, INOXPA S.A., Definox SAS, Burkert Fluid Control Systems, Bardiani Valvole SpA, Gebr. Rieger GmbH & Co. KG, GEMU Gebr. Muller Apparatebau GmbH & Co. KG, and Armaturenwerk Hotensleben GmbH. The competitive landscape of the global hygienic and aseptic valve market is fragmented due the presence of several players in the market. These players are expected to focus on strengthening their presence in emerging economies as a means to ensure sustainable returns in the near future.
The global hygienic and aseptic valves market was worth US$6.0 bn and is projected to reach a value of US$9.0 bn by the end of 2025
Hygienic and aseptic valves market is anticipated to grow at a CAGR of 4.8% during the forecast period
North America accounted for a major share of the global hygienic and aseptic valves market
The global hygienic and aseptic valves market’s growth will be supported by the increasing emphasis on sanitary regulations established by the food and beverage industry
Key players in the global hygienic and aseptic valves market include ITT Corporation, SPX Flow, Inc., Cipriani Harrison Valves Corporation, Pentair Plc, GEA Group AG, Alfa Laval AB, Evoguard GmbH, M&S Armaturen GmbH, Zhejiang Yuanan Liquid Equipment Co., Ltd., Nocado GmbH, Kieselmann Fluid Process Group, INOXPA S.A., Definox SAS, Burkert Fluid Control Systems, Bardiani Valvole SpA, Gebr. Rieger GmbH & Co. KG, GEMU Gebr. Muller Apparatebau GmbH & Co. KG, and Armaturenwerk Hotensleben GmbH
1. Preface
1.1. Market Definition & Scope
1.2. Market Segmentation
1.3. Key Research Objectives
1.4. Research Highlights
2. Assumptions & Research Methodology
3. Executive Summary
3.1. Global Hygienic Valve Market Snapshot
3.2. Global Hygienic Valve Market Revenue and Volume, 2015 – 2025 (US$ Mn and Million Units) and Year-on-Year Growth (%)
4. Global Hygienic Valve Market Analysis, 2015 – 2025 (US$ Mn and Million Units)
4.1. Overview
4.2. Key Trends Analysis
4.2.1. Consumer Preference Analysis: Price Focus Vs Western Standard Valve Types
4.2.2. Acceptance of Valve Types: Chinese vs European Suppliers/Manufacturers
4.2.3. Emerging Applications of Hygienic Valves
4.3. Market Dynamics
4.3.1. Drivers
4.3.2. Restraints
4.3.3. Opportunity
4.4. Price Trends Analysis: Global Hygienic Valve Market
4.5. Global Hygienic Valve Market Analysis, By Valve Type, 2015 – 2025 (US$ Mn and Million Units)
4.5.1. Hygienic Single Seat Valves
4.5.2. Hygienic Double Seat Valves (Mixproof valves)
4.5.3. Hygienic Butterfly Valves
4.5.4. Hygienic Control Valves
4.5.5. Aseptic Valves
4.6. Global Hygienic Valve Market Analysis, By Application, 2015 – 2025 (US$ Mn and Million Units)
4.6.1. Dairy Processing
4.6.1.1. Hygienic Single Seat Valves
4.6.1.2. Hygienic Double Seat Valves (Mixproof valves)
4.6.1.3. Hygienic Butterfly Valves
4.6.1.4. Hygienic Control Valves
4.6.1.5. Aseptic Valves
4.6.2. Food Processing
4.6.2.1. Hygienic Single Seat Valves
4.6.2.2. Hygienic Double Seat Valves (Mixproof valves)
4.6.2.3. Hygienic Butterfly Valves
4.6.2.4. Hygienic Control Valves
4.6.2.5. Aseptic Valves
4.6.3. Beverage
4.6.3.1. Hygienic Single Seat Valves
4.6.3.2. Hygienic Double Seat Valves (Mixproof valves)
4.6.3.3. Hygienic Butterfly Valves
4.6.3.4. Hygienic Control Valves
4.6.3.5. Aseptic Valves
4.6.4. Pharmaceuticals
4.6.4.1. Hygienic Single Seat Valves
4.6.4.2. Hygienic Double Seat Valves (Mixproof valves)
4.6.4.3. Hygienic Butterfly Valves
4.6.4.4. Hygienic Control Valves
4.6.4.5. Aseptic Valves
4.6.5. Biotechnology
4.6.5.1. Hygienic Single Seat Valves
4.6.5.2. Hygienic Double Seat Valves (Mixproof valves)
4.6.5.3. Hygienic Butterfly Valves
4.6.5.4. Hygienic Control Valves
4.6.5.5. Aseptic Valves
4.7. Competitive Landscape
4.7.1. Market Positioning of Key Players, 2015
4.7.2. Competitive Strategies Adopted by Leading Players
4.7.3. Recommendations
5. North America Hygienic Valve Market Analysis & Forecast
5.1. Key Trends
5.2. Price Trend Analysis
5.3. Market Size (US$ Mn & Million Units) Forecast By Valve Type, 2015 – 2025
5.3.1. Hygienic Single Seat Valves
5.3.2. Hygienic Double Seat Valves (Mixproof valves)
5.3.3. Hygienic Butterfly Valves
5.3.4. Hygienic Control Valves
5.3.5. Aseptic Valves
5.4. Market Size (US$ Mn & Million Units) Forecast By Application, 2015 – 2025
5.4.1. Dairy Processing
5.4.2. Food Processing
5.4.3. Beverage
5.4.4. Pharmaceuticals
5.4.5. Biotechnology
5.5. Market Size (US$ Mn & Million Units) Forecast By Country, 2015 – 2025
5.5.1. The U.S.
5.5.2. Canada
5.5.3. Rest of North America
6. Europe Hygienic Valve Market Analysis & Forecast
6.1. Key Trends
6.2. Price Trend Analysis
6.3. Market Size (US$ Mn & Million Units) Forecast By Valve Type, 2015 – 2025
6.3.1. Hygienic Single Seat Valves
6.3.2. Hygienic Double Seat Valves (Mixproof valves)
6.3.3. Hygienic Butterfly Valves
6.3.4. Hygienic Control Valves
6.3.5. Aseptic Valves
6.4. Market Size (US$ Mn & Million Units) Forecast By Application, 2015 – 2025
6.4.1. Dairy Processing
6.4.2. Food Processing
6.4.3. Beverage
6.4.4. Pharmaceuticals
6.4.5. Biotechnology
6.5. Market Size (US$ Mn & Million Units) Forecast By Country, 2015 – 2025
6.5.1. U.K.
6.5.2. Germany
6.5.3. France
6.5.4. Spain
6.5.5. Italy
6.5.6. Rest of Europe
7. Asia Pacific Hygienic Valve Market Analysis & Forecast
7.1. Key Trends
7.2. Price Trend Analysis
7.3. Market Size (US$ Mn & Million Units) Forecast By Valve Type, 2015 – 2025
7.3.1. Hygienic Single Seat Valves
7.3.2. Hygienic Double Seat Valves (Mixproof valves)
7.3.3. Hygienic Butterfly Valves
7.3.4. Hygienic Control Valves
7.3.5. Aseptic Valves
7.4. Market Size (US$ Mn & Million Units) Forecast By Application, 2015 – 2025
7.4.1. Dairy Processing
7.4.2. Food Processing
7.4.3. Beverage
7.4.4. Pharmaceuticals
7.4.5. Biotechnology
7.5. Market Size (US$ Mn & Million Units) Forecast By Country, 2015 – 2025
7.5.1. China
7.5.2. Japan
7.5.3. India
7.5.4. Australia
7.5.5. Rest of Asia Pacific
8. Middle East & Africa (MEA) Hygienic Valve Market Analysis & Forecast
8.1. Key Trends
8.2. Price Trend Analysis
8.3. Market Size (US$ Mn & Million Units) Forecast By Valve Type, 2015 – 2025
8.3.1. Hygienic Single Seat Valves
8.3.2. Hygienic Double Seat Valves (Mixproof valves)
8.3.3. Hygienic Butterfly Valves
8.3.4. Hygienic Control Valves
8.3.5. Aseptic Valves
8.4. Market Size (US$ Mn & Million Units) Forecast By Application, 2015 – 2025
8.4.1. Dairy Processing
8.4.2. Food Processing
8.4.3. Beverage
8.4.4. Pharmaceuticals
8.4.5. Biotechnology
8.5. Market Size (US$ Mn & Million Units) Forecast By Country, 2015 – 2025
8.5.1. UAE
8.5.2. Saudi Arabia
8.5.3. South Africa
8.5.4. Rest of MEA
9. South America Hygienic Valve Market Analysis & Forecast
9.1. Key Trends
9.2. Price Trend Analysis
9.3. Market Size (US$ Mn & Million Units) Forecast By Valve Type, 2015 – 2025
9.3.1. Hygienic Single Seat Valves
9.3.2. Hygienic Double Seat Valves (Mixproof valves)
9.3.3. Hygienic Butterfly Valves
9.3.4. Hygienic Control Valves
9.3.5. Aseptic Valves
9.4. Market Size (US$ Mn & Million Units) Forecast By Application, 2015 – 2025
9.4.1. Dairy Processing
9.4.2. Food Processing
9.4.3. Beverage
9.4.4. Pharmaceuticals
9.4.5. Biotechnology
9.5. Market Size (US$ Mn & Million Units) Forecast By Country, 2015 – 2025
9.5.1. Brazil
9.5.2. Rest of South America
10. Company Profiles
10.1. ITT Corporation
10.1.1. Company Details
10.1.2. Company Description
10.1.3. Business Overview
10.1.4. Financial Overview
10.1.5. Regional Share
10.1.6. Strategic Overview
10.1.7. SWOT Analysis
10.2. SPX Flow, Inc.
10.2.1. Company Details
10.2.2. Company Description
10.2.3. Business Overview
10.2.4. Financial Overview
10.2.5. Regional Share
10.2.6. Strategic Overview
10.2.7. SWOT Analysis
10.3. Pentair Plc
10.3.1. Company Details
10.3.2. Company Description
10.3.3. Business Overview
10.3.4. Financial Overview
10.3.5. Regional Share
10.3.6. Strategic Overview
10.3.7. SWOT Analysis
10.4. GEA Group AG
10.4.1. Company Details
10.4.2. Company Description
10.4.3. Business Overview
10.4.4. Financial Overview
10.4.5. Regional Share
10.4.6. Strategic Overview
10.4.7. SWOT Analysis
10.5. Alfa Laval AB
10.5.1. Company Details
10.5.2. Company Description
10.5.3. Business Overview
10.5.4. Financial Overview
10.5.5. Regional Share
10.5.6. Strategic Overview
10.5.7. SWOT Analysis
10.6. Evoguard GmbH
10.6.1. Company Details
10.6.2. Company Description
10.6.3. Business Overview
10.6.4. Financial Overview
10.6.5. Regional Share
10.6.6. Strategic Overview
10.6.7. SWOT Analysis
10.7. M&S Armaturen GmbH
10.7.1. Company Details
10.7.2. Company Description
10.7.3. Business Overview
10.7.4. Financial Overview
10.7.5. Regional Share
10.7.6. Strategic Overview
10.7.7. SWOT Analysis
10.8. Nocado GmbH
10.8.1. Company Details
10.8.2. Company Description
10.8.3. Business Overview
10.8.4. Financial Overview
10.8.5. Regional Share
10.8.6. Strategic Overview
10.8.7. SWOT Analysis
10.9. Zhejiang Yuanan Liquid Equipment Co., Ltd.
10.9.1. Company Details
10.9.2. Company Description
10.9.3. Business Overview
10.9.4. Financial Overview
10.9.5. Regional Share
10.9.6. Strategic Overview
10.9.7. SWOT Analysis
10.10. Keiselmann Fluid Process Group
10.10.1. Company Details
10.10.2. Company Description
10.10.3. Business Overview
10.10.4. Financial Overview
10.10.5. Regional Share
10.10.6. Strategic Overview
10.10.7. SWOT Analysis
10.11. INOXPA S.A.
10.11.1. Company Details
10.11.2. Company Description
10.11.3. Business Overview
10.11.4. Financial Overview
10.11.5. Regional Share
10.11.6. Strategic Overview
10.11.7. SWOT Analysis
10.12. Definox SAS
10.12.1. Company Details
10.12.2. Company Description
10.12.3. Business Overview
10.12.4. Financial Overview
10.12.5. Regional Share
10.12.6. Strategic Overview
10.12.7. SWOT Analysis
10.13. Burkert Fluid Control Systems
10.13.1. Company Details
10.13.2. Company Description
10.13.3. Business Overview
10.13.4. Financial Overview
10.13.5. Regional Share
10.13.6. Strategic Overview
10.13.7. SWOT Analysis
10.14. Cipriani Harrison Valves Corporation
10.14.1. Company Details
10.14.2. Company Description
10.14.3. Business Overview
10.14.4. Financial Overview
10.14.5. Regional Share
10.14.6. Strategic Overview
10.14.7. SWOT Analysis
10.15. Bardiani Valvole SpA
10.15.1. Company Details
10.15.2. Company Description
10.15.3. Business Overview
10.15.4. Financial Overview
10.15.5. Regional Share
10.15.6. Strategic Overview
10.15.7. SWOT Analysis
10.16. Gebr. Rieger GmbH & Co. KG
10.16.1. Company Details
10.16.2. Company Description
10.16.3. Business Overview
10.16.4. Financial Overview
10.16.5. Regional Share
10.16.6. Strategic Overview
10.16.7. SWOT Analysis
10.17. GEMU Gebr. Muller Apparatebau GmbH & Co. KG
10.17.1. Company Details
10.17.2. Company Description
10.17.3. Business Overview
10.17.4. Financial Overview
10.17.5. Regional Share
10.17.6. Strategic Overview
10.17.7. SWOT Analysis
10.18. Armaturenwerk Hotensleben GmbH
10.18.1. Company Details
10.18.2. Company Description
10.18.3. Business Overview
10.18.4. Financial Overview
10.18.5. Regional Share
10.18.6. Strategic Overview
10.18.7. SWOT Analysis
List of Tables
Table 01: Global Hygienic and Aseptic Valve Market Price Trend Analysis (US$) Forecast, By Valve Type, 2015–2025
Table 02: Global Hygienic and Aseptic Valve Market Size (US$ Mn) and Volume (Thousand Units) Forecast, By Valve Type, 2015–2025
Table 03: Global Hygienic and Aseptic Valve Market Size (US$ Mn) and Volume (Thousand Units) Forecast, By Valve Type, 2015–2025
Table 04: Global Hygienic and Aseptic Valve Market Size (US$ Mn) and Volume (Thousand Units) Forecast, By Application, 2015–2025
Table 05: Global Hygienic and Aseptic Valve Market Size (US$ Mn) and Volume (Thousand Units) Forecast, By Application, 2015–2025
Table 06: Global Hygienic and Aseptic Valves Dairy Processing Market Size (US$ Mn) and Volume (Thousand Units) Forecast, By Valve Type, 2015–2025
Table 07: Global Hygienic and Aseptic Valves Dairy Processing Market Size (US$ Mn) and Volume (Thousand Units) Forecast, By Valve Type, 2015–2025
Table 08: Global Hygienic and Aseptic Valves Food Processing Market Size (US$ Mn) and Volume (Thousand Units) Forecast, By Valve Type, 2015–2025
Table 09: Global Hygienic and Aseptic Valves Food Processing Market Size (US$ Mn) and Volume (Thousand Units) Forecast, By Valve Type, 2015–2025
Table 10: Global Hygienic and Aseptic Valves Beverage Market Size (US$ Mn) and Volume (Thousand Units) Forecast, By Valve Type, 2015–2025
Table 11: Global Hygienic and Aseptic Valves Beverage Market Size (US$ Mn) and Volume (Thousand Units) Forecast, By Valve Type, 2015–2025
Table 12: Global Hygienic and Aseptic Valves Pharmaceuticals Market Size (US$ Mn) and Volume (Thousand Units) Forecast, By Valve Type, 2015–2025
Table 13: Global Hygienic and Aseptic Valves Pharmaceuticals Market Size (US$ Mn) and Volume (Thousand Units) Forecast, By Valve Type, 2015–2025
Table 14: Global Hygienic and Aseptic Valves Biotechnology Market Size (US$ Mn) and Volume (Thousand Units) Forecast, By Valve Type, 2015–2025
Table 15: Global Hygienic and Aseptic Valves Biotechnology Market Size (US$ Mn) and Volume (Thousand Units) Forecast, By Valve Type, 2015–2025
Table 16: North America Hygienic and Aseptic Valve Market Price Trend Analysis (US$) Forecast, By Valve Type, 2015–2025
Table 17: North America Hygienic and Aseptic Valve Market Size (US$ Mn) and Volume (Thousand Units) Forecast, By Valve Type, 2015 – 2025
Table 18: North America Hygienic and Aseptic Valve Market Size (US$ Mn) and Volume (Thousand Units) Forecast, By Valve Type, 2015 – 2025
Table 19: North America Hygienic and Aseptic Valve Market Size (US$ Mn) and Volume (Thousand Units) Forecast, By Application, 2015 – 2025
Table 20: North America Hygienic and Aseptic Valve Market Size (US$ Mn) and Volume (Thousand Units) Forecast, By Application, 2015– 2025
Table 21: North America Hygienic and Aseptic Valve Market Size (US$ Mn) and Volume (Thousand Units) Forecast, By Country/Region, 2015 – 2025
Table 22: Europe Hygienic and Aseptic Valve Market Price Trend Analysis (US$) Forecast, By Valve Type, 2015–2025
Table 23: Europe Hygienic and Aseptic Valve Market Size (US$ Mn) and Volume (Thousand Units) Forecast, By Valve Type, 2015 – 2025
Table 24: Europe Hygienic and Aseptic Valve Market Size (US$ Mn) and Volume (Thousand Units) Forecast, By Valve Type, 2015 – 2025
Table 25: Europe Hygienic and Aseptic Valve Market Size (US$ Mn) and Volume (Thousand Units) Forecast, By Application, 2015 – 2025
Table 26: Europe Hygienic and Aseptic Valve Market Size (US$ Mn) and Volume (Thousand Units) Forecast, By Application, 2015– 2025
Table 27: Europe Hygienic and Aseptic Valve Market Size (US$ Mn) and Volume (Thousand Units) Forecast, By Country/Region, 2015 – 2025
Table 28: Europe Hygienic and Aseptic Valve Market Size (US$ Mn) and Volume (Thousand Units) Forecast, By Country/Region, 2015 – 2025
Table 29: Asia Pacific Hygienic and Aseptic Valve Market Price Trend Analysis (US$) Forecast, By Valve Type, 2015–2025
Table 30: Asia Pacific Hygienic and Aseptic Valve Market Size (US$ Mn) and Volume (Thousand Units) Forecast, By Valve Type, 2015 – 2025
Table 31: Asia Pacific Hygienic and Aseptic Valve Market Size (US$ Mn) and Volume (Thousand Units) Forecast, By Valve Type, 2015 – 2025
Table 32: Asia Pacific Hygienic and Aseptic Valve Market Size (US$ Mn) and Volume (Thousand Units) Forecast, By Application, 2015 – 2025
Table 33: Asia Pacific Hygienic and Aseptic Valve Market Size (US$ Mn) and Volume (Thousand Units) Forecast, By Application, 2015– 2025
Table 34: Asia Pacific Hygienic and Aseptic Valve Market Size (US$ Mn) and Volume (Thousand Units) Forecast, By Country/Region, 2015 – 2025
Table 35: Asia Pacific Hygienic and Aseptic Valve Market Size (US$ Mn) and Volume (Thousand Units) Forecast, By Country/Region, 2015 – 2025
Table 36: Middle East and Africa Hygienic and Aseptic Valve Market Price Trend Analysis (US$) Forecast, By Valve Type, 2015–2025
Table 37: Middle East & Africa Hygienic and Aseptic Valve Market Size (US$ Mn) and Volume (Thousand Units) Forecast, By Valve Type, 2015 – 2025
Table 38: Middle East & Africa Hygienic and Aseptic Valve Market Size (US$ Mn) and Volume (Thousand Units) Forecast, By Valve Type, 2015 – 2025
Table 39: Middle East & Africa Hygienic and Aseptic Valve Market Size (US$ Mn) and Volume (Thousand Units) Forecast, By Application, 2015 – 2025
Table 40: Middle East & Africa Hygienic and Aseptic Valve Market Size (US$ Mn) and Volume (Thousand Units) Forecast, By Application, 2015– 2025
Table 41: Middle East & Africa Hygienic and Aseptic Valve Market Size (US$ Mn) and Volume (Thousand Units) Forecast, By Country/Region, 2015 – 2025
Table 42: Middle East & Africa Hygienic and Aseptic Valve Market Size (US$ Mn) and Volume (Thousand Units) Forecast, By Country/Region, 2015 – 2025
Table 43: South America Hygienic and Aseptic Valve Market Price Trend Analysis (US$) Forecast, By Valve Type, 2015–2025
Table 44: South America Hygienic and Aseptic Valve Market Size (US$ Mn) and Volume (Thousand Units) Forecast, By Valve Type, 2015 – 2025
Table 45: South America Hygienic and Aseptic Valve Market Size (US$ Mn) and Volume (Thousand Units) Forecast, By Valve Type, 2015 – 2025
Table 46: South America Hygienic and Aseptic Valve Market Size (US$ Mn) and Volume (Thousand Units) Forecast, By Application, 2015 – 2025
Table 47: South America Hygienic and Aseptic Valve Market Size (US$ Mn) and Volume (Thousand Units) Forecast, By Application, 2015– 2025
Table 48: South America Hygienic and Aseptic Valve Market Size (US$ Mn) and Volume (Thousand Units) Forecast, By Country/Region, 2015 – 2025
List of Figures
Figure 01: Global Hygienic and Aseptic Valve Market Size (US$ Mn) and Volume (Thousand Units) Forecast, 2015–2025
Figure 02: Global Hygienic and Aseptic Valve Market Size and Volume Y-o-Y Growth Projections, 2016–2025
Figure 03: Global Market Revenue Share Analysis, By Valve Type, 2015 and 2025
Figure 04: Global Market Revenue Share Analysis, By Application, 2015 and 2025
Figure 05: Global Dairy Processing Market Revenue Share Analysis, By Valve Type, 2015 and 2025
Figure 06: Global Food Processing Market Revenue Share Analysis, By Valve Type, 2015 and 2025
Figure 07: Global Beverage Market Revenue Share Analysis, By Valve Type, 2015 and 2025
Figure 08: Global Pharmaceuticals Market Revenue Share Analysis, By Valve Type, 2015 and 2025
Figure 09: Global Biotechnology Market Revenue Share Analysis, By Valve Type, 2015 and 2025
Figure 10: North America Hygienic and Aseptic Valve Market Size (US$ Mn) and Volume (Thousand Units) Forecast, 2015–2025
Figure 11: North America Hygienic and Aseptic Valve Market Size and Volume Y-o-Y Growth Projections,2016–2025
Figure 12: North America Market Revenue Share Analysis, By Valve Type, 2015 and 2025
Figure 13: North America Market Revenue Share Analysis By Application, 2015 and 2025
Figure 14: North America Market Revenue Share Analysis By Country/Region, 2015 and 2025
Figure 15: Europe Hygienic and Aseptic Valve Market Size (US$ Mn) and Volume (Thousand Units) Forecast, 2015–2025
Figure 16: Europe Hygienic and Aseptic Valve Market Size and Volume Y-o-Y Growth Projections,2016–2025
Figure 17: Europe Market Revenue Share Analysis, By Valve Type, 2015 and 2025
Figure 18: Europe Market Revenue Share Analysis By Application, 2015 and 2025
Figure 19: Europe Market Revenue Share Analysis By Country/Region, 2015 and 2025
Figure 20: Asia Pacific Hygienic and Aseptic Valve Market Size (US$ Mn) and Volume (Thousand Units)Forecast, 2015–2025
Figure 21: Asia Pacific Hygienic and Aseptic Valve Market Size and Volume Y-o-Y Growth Projections,2016–2025
Figure 22: Asia Pacific Market Revenue Share Analysis, By Valve Type, 2015 and 2025
Figure 23: Asia Pacific Market Revenue Share Analysis By Application, 2015 and 2025
Figure 24: Asia Pacific Market Revenue Share Analysis By Country/Region, 2015 and 2025
Figure 25: Middle East & Africa Hygienic and Aseptic Valve Market Size (US$ Mn) and Volume (Thousand Units) Forecast, 2015–2025
Figure 26: Middle East & Africa Hygienic and Aseptic Valve Market Size and Volume Y-o-Y Growth Projections, 2016–2025
Figure 27: Middle East & Africa Market Revenue Share Analysis, By Valve Type, 2015 and 2025
Figure 28: Middle East & Africa Market Revenue Share Analysis By Application, 2015 and 2025
Figure 29: Middle East & Africa Market Revenue Share Analysis By Country/Region, 2015 and 2025
Figure 30: South America Hygienic and Aseptic Valve Market Size (US$ Mn) and Volume (Thousand Units) Forecast, 2015–2025
Figure 31: South America Hygienic and Aseptic Valve Market Size and Volume Y-o-Y Growth Projections, 2016–2025
Figure 32: South America Market Revenue Share Analysis, By Valve Type, 2015 and 2025
Figure 33: South America Market Revenue Share Analysis, By Application, 2015 and 2025
Figure 34: South America Market Revenue Share Analysis By Country/Region, 2015 and 2025
Copyright © Transparency Market Research, Inc. All Rights reserved
Trust Online

Hygienic and Aseptic Valves Market