
Reports
Reports
Analysts’ Viewpoint on Market Scenario
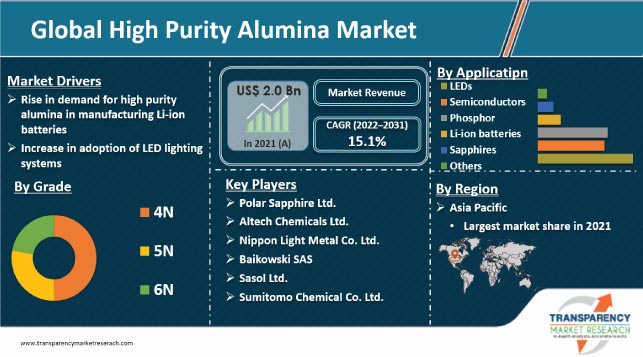
Rise in demand for display materials, automobiles, semiconductors, and computers is driving the global market for High Purity Alumina (HPA). There is no substitute for HPA in the manufacture of synthetic sapphire, which is used to make LEDs. HPA possesses various beneficial properties such as high brightness and resistance to high temperature, corrosion, and scratch.
Surge in adoption of lithium-ion batteries, smartphones, LED lighting, electric vehicles, solar panels, and various medical technologies is expected to boost the market progress during the forecast period. Companies are developing novel methods for the production of HPA and alumina trihydrate that use less energy to expand their manufacturing capacity.
Aluminum oxide in the purest phase is known HPA (Al2O3). It is generally manufactured by vapor-phase oxidation, undersea spark discharge with aluminium, hydrolysis of aluminium oxide, and leaching of hydrochloric acid. Major alumina resources include alumina hydrate, which encourages glazing adhesion and is frequently preferable to high purity calcined alumina.
The non-corrosive, brilliant, and non-metallurgical alumina product known as HPA is prized for its unique traits. In accordance with the degree of purity, it can be divided into 4N, 5N, and 6N categories. Manufacturing artificial sapphire substrates, LED lights, semiconductor wafers, ceramics, phosphors, synthetic gemstones, and smartphone parts are just a few applications for high purity alumina. Additionally, it is used to manufacture glass for TVs, optical windows, and wristwatches.
Complicated battery separators help tackle various safety issues in commercial Li-on batteries. These battery separators are manufactured with ceramic coating on traditional polyolefin membranes or inorganic composite membranes. High-purity aluminum oxide is one of the widely accepted ceramic materials used in separator enhancement due to its unique properties. Alumina is electrically nonconductive and inert to all the chemicals present in lithium battery components.
Alumina is thermally stable over a wide range of temperatures required for effective battery performance. This property makes it ideal as a coating and additive material for battery separator production. Ceramic particles, especially alumina, are used to coat a ceramic layer on PE/PP membranes to improve separator performance and reduce the chances of thermal run-away. Coated alumina layers prevent failure at an elevated temperature and hinder dendrite damage to the separator. HPA can significantly enhance the physical and chemical properties of battery separators, thus boosting their adoption in lithium-ion battery manufacturing.
Demand for HPA has been rising significantly across the globe. Surge in adoption of LED bulbs instead of traditional bulbs and technological advancements in LEDs are anticipated to double the demand for HPA in the next three years. HPA is integral in the production of LED lighting systems such as white LEDs, which are widely used in mobile phone backlights, advertisement lighting, displays, automobile headlights, and home illumination. Synthetic sapphire wafer substrates made from HPA are employed in LED lighting systems and displays due to their extraordinary thermal conductivity and ultra-pure surface.
According to the high purity alumina market size forecast, the 4N segment is anticipated to witness rapid growth in the next few years. The segment held prominent share of nearly 64.0% of the market in terms of grade in 2021. 4N grade HPA has purity level of 99.99%. Rise in demand for LEDs, lithium-ion batteries, and scratch-resistant glasses that are used in various consumer electronics and gadgets is driving the segment.
Asia Pacific held major share of the global HPA industry in terms of value in 2021 due to the increase in demand for alumina stems in the electronics sector in the region. China, South Korea, Taiwan, and Japan are key manufacturing hubs for electrical and electronics products in Asia Pacific. The North America high purity alumina industry expansion can be ascribed to the rise in presence of HPA producers in the region.
The global high purity alumina business is highly consolidated, with a small number of large-scale vendors controlling majority of the share. Most companies are investing significantly in comprehensive research and development activities, primarily to create environment-friendly products. Expansion of product portfolios and mergers & acquisitions are key strategies adopted by prominent players.
Sumitomo Chemical Co. Ltd., Sasol Ltd., Baikowski SAS, Nippon Light Metal Co. Ltd., HMR Co., Ltd., Dalian Hiland Photoelectric Material Co., Ltd., Hebei Hengbo New Material Technology Co. Ltd., Xuancheng Jing Rui New Material Co., Ltd., Polar Sapphire, and Altech Chemicals Ltd. are key entities operating in the market.
These market players have been profiled in the latest report based on parameters such as company overview, financial overview, business strategies, product portfolio, business segments, and recent developments.
|
Attribute |
Detail |
|
Market Size Value in 2021 |
US$ 2.0 Bn |
|
Market Forecast Value in 2031 |
US$ 8.2 Bn |
|
Growth Rate (CAGR) |
15.1% |
|
Forecast Period |
2022–2031 |
|
Historical Data Available for |
2020 |
|
Quantitative Units |
US$ Bn for Value & Kilo Tons for Volume |
|
Market Analysis |
It includes cross-segment analysis at the global as well as regional level. Furthermore, the qualitative analysis includes drivers, restraints, opportunities, key trends, Porter’s Five Forces analysis, value chain analysis, and key trend analysis. |
|
Competition Landscape |
|
|
Format |
Electronic (PDF) + Excel |
|
Market Segmentation |
|
|
Regions Covered |
|
|
Countries Covered |
|
|
Companies Profiled |
|
|
Customization Scope |
Available upon request |
|
Pricing |
Available upon request |
The market was valued at US$ 2.0 Bn in 2021
It is expected to advance at a CAGR of 15.1% from 2022 to 2031
Rise in demand for high-purity alumina in manufacture of Li-ion batteries and increase in adoption of LED lighting systems
4N was the largest grade segment that held 69.3% share in 2021
Asia Pacific was the most lucrative region with 34.2% share in 2021
Sumitomo Chemical Co. Ltd., Sasol Ltd., Baikowski SAS, Nippon Light Metal Co. Ltd., HMR Co., Ltd., Dalian Hiland Photoelectric Material Co., Ltd., Hebei Hengbo New Material Technology Co. Ltd., Xuancheng Jing Rui New Material Co., Ltd., Polar Sapphire, and Altech Chemicals Ltd.
1. Executive Summary
1.1. High Purity Alumina Market Snapshot
1.2. Current Market and Future Potential
2. Market Overview
2.1. Market Segmentation
2.2. Market Trends
2.3. Market Dynamics
2.3.1. Drivers
2.3.2. Restraints
2.3.3. Opportunities
2.4. Porter’s Five Forces Analysis
2.5. Regulatory Analysis
2.6. Value Chain Analysis
2.6.1. List of Raw Material Providers
2.6.2. List of High Purity Alumina Manufacturers
2.6.3. List of Dealers/Distributors
2.6.4. List of Potential Customer
3. COVID-19 Impact Analysis
4. Global High Purity Alumina Market Analysis and Forecast, by Grade, 2022–2031
4.1. Introduction and Definitions
4.2. Global High Purity Alumina Market Volume (Kilo Tons) and Value (US$ Bn) Forecast, by Grade, 2022–2031
4.2.1. 4N
4.2.2. 5N
4.2.3. 6N
4.3. Global High Purity Alumina Market Attractiveness, by Grade
5. Global High Purity Alumina Market Analysis and Forecast, by Application, 2022–2031
5.1. Introduction and Definitions
5.2. Global High Purity Alumina Market Volume (Kilo Tons) and Value (US$ Bn) Forecast, by Application, 2022–2031
5.2.1. LEDs
5.2.2. Semiconductors
5.2.3. Phosphor
5.2.4. Li-ion batteries
5.2.5. Sapphires
5.2.6. Others
5.3. Global High Purity Alumina Market Attractiveness, by Application
6. Global High Purity Alumina Market Analysis and Forecast, by Region, 2022–2031
6.1. Key Findings
6.2. Global High Purity Alumina Market Volume (Kilo Tons) and Value (US$ Bn) Forecast, by Region, 2022–2031
6.2.1. North America
6.2.2. Europe
6.2.3. Asia Pacific
6.2.4. Latin America
6.2.5. Middle East & Africa
6.3. Global High Purity Alumina Market Attractiveness, by Region
7. North America High Purity Alumina Market Analysis and Forecast, 2022–2031
7.1. Key Findings
7.2. North America High Purity Alumina Market Volume (Kilo Tons) and Value (US$ Bn) Forecast, by Grade, 2022–2031
7.3. North America High Purity Alumina Market Volume (Kilo Tons) and Value (US$ Bn) Forecast, by Application, 2022–2031
7.4. North America High Purity Alumina Market Volume (Kilo Tons) and Value (US$ Bn) Forecast, by Country, 2022–2031
7.4.1. U.S. High Purity Alumina Market Volume (Kilo Tons) and Value (US$ Bn) Forecast, by Grade, 2022–2031
7.4.2. U.S. High Purity Alumina Market Volume (Kilo Tons) and Value (US$ Bn) Forecast, by Application, 2022–2031
7.4.3. Canada High Purity Alumina Market Volume (Kilo Tons) and Value (US$ Bn) Forecast, by Grade, 2022–2031
7.4.4. Canada High Purity Alumina Market Volume (Kilo Tons) and Value (US$ Bn) Forecast, by Application, 2022–2031
7.5. North America High Purity Alumina Market Attractiveness Analysis
8. Europe High Purity Alumina Market Analysis and Forecast, 2022–2031
8.1. Key Findings
8.2. Europe High Purity Alumina Market Volume (Kilo Tons) and Value (US$ Bn) Forecast, by Grade, 2022–2031
8.3. Europe High Purity Alumina Market Volume (Kilo Tons) and Value (US$ Bn) Forecast, by Application, 2022–2031
8.4. Europe High Purity Alumina Market Volume (Kilo Tons) and Value (US$ Bn) Forecast, by Country and Sub-region, 2021-2031
8.4.1. Germany High Purity Alumina Market Volume (Kilo Tons) and Value (US$ Bn) Forecast, by Grade, 2022–2031
8.4.2. Germany High Purity Alumina Market Volume (Kilo Tons) and Value (US$ Bn) Forecast, by Application, 2022–2031
8.4.3. France High Purity Alumina Market Volume (Kilo Tons) and Value (US$ Bn) Forecast, by Grade, 2022–2031
8.4.4. France High Purity Alumina Market Volume (Kilo Tons) and Value (US$ Bn) Forecast, by Application, 2022–2031
8.4.5. U.K. High Purity Alumina Market Volume (Kilo Tons) and Value (US$ Bn) Forecast, by Grade, 2022–2031
8.4.6. U.K. High Purity Alumina Market Volume (Kilo Tons) and Value (US$ Bn) Forecast, by Application, 2022–2031
8.4.7. Italy High Purity Alumina Market Volume (Kilo Tons) and Value (US$ Bn) Forecast, by Grade, 2022–2031
8.4.8. Italy High Purity Alumina Market Volume (Kilo Tons) and Value (US$ Bn) Forecast, by Application, 2022–2031
8.4.9. Russia & CIS High Purity Alumina Market Volume (Kilo Tons) and Value (US$ Bn) Forecast, by Grade, 2022–2031
8.4.10. Russia & CIS High Purity Alumina Market Volume (Kilo Tons) and Value (US$ Bn) Forecast, by Application, 2022–2031
8.4.11. Rest of Europe High Purity Alumina Market Volume (Kilo Tons) and Value (US$ Bn) Forecast, by Grade, 2022–2031
8.4.12. Rest of Europe High Purity Alumina Market Volume (Kilo Tons) and Value (US$ Bn) Forecast, by Application, 2022–2031
8.5. Europe High Purity Alumina Market Attractiveness Analysis
9. Asia Pacific High Purity Alumina Market Analysis and Forecast, 2022–2031
9.1. Key Findings
9.2. Asia Pacific High Purity Alumina Market Volume (Kilo Tons) and Value (US$ Bn) Forecast, by Grade
9.3. Asia Pacific High Purity Alumina Market Volume (Kilo Tons) and Value (US$ Bn) Forecast, by Application, 2022–2031
9.4. Asia Pacific High Purity Alumina Market Volume (Kilo Tons) and Value (US$ Bn) Forecast, by Country and Sub-region, 2021-2031
9.4.1. China High Purity Alumina Market Volume (Kilo Tons) and Value (US$ Bn) Forecast, by Grade, 2022–2031
9.4.2. China High Purity Alumina Market Volume (Kilo Tons) and Value (US$ Bn) Forecast, by Application, 2022–2031
9.4.3. Japan High Purity Alumina Market Volume (Kilo Tons) and Value (US$ Bn) Forecast, by Grade, 2022–2031
9.4.4. Japan High Purity Alumina Market Volume (Kilo Tons) and Value (US$ Bn) Forecast, by Application, 2022–2031
9.4.5. India High Purity Alumina Market Volume (Kilo Tons) and Value (US$ Bn) Forecast, by Grade, 2022–2031
9.4.6. India High Purity Alumina Market Volume (Kilo Tons) and Value (US$ Bn) Forecast, by Application, 2022–2031
9.4.7. ASEAN High Purity Alumina Market Volume (Kilo Tons) and Value (US$ Bn) Forecast, by Grade, 2022–2031
9.4.8. ASEAN High Purity Alumina Market Volume (Kilo Tons) and Value (US$ Bn) Forecast, by Application, 2022–2031
9.4.9. Rest of Asia Pacific High Purity Alumina Market Volume (Kilo Tons) and Value (US$ Bn) Forecast, by Grade, 2022–2031
9.4.10. Rest of Asia Pacific High Purity Alumina Market Volume (Kilo Tons) and Value (US$ Bn) Forecast, by Application, 2022–2031
9.5. Asia Pacific High Purity Alumina Market Attractiveness Analysis
10. Latin America High Purity Alumina Market Analysis and Forecast, 2022–2031
10.1. Key Findings
10.2. Latin America High Purity Alumina Market Volume (Kilo Tons) and Value (US$ Bn) Forecast, by Grade, 2022–2031
10.3. Latin America High Purity Alumina Market Volume (Kilo Tons) and Value (US$ Bn) Forecast, by Application, 2022–2031
10.4. Latin America High Purity Alumina Market Volume (Kilo Tons) and Value (US$ Bn) Forecast, by Country and Sub-region, 2021-2031
10.4.1. Brazil High Purity Alumina Market Volume (Kilo Tons) and Value (US$ Bn) Forecast, by Grade, 2022–2031
10.4.2. Brazil High Purity Alumina Market Volume (Kilo Tons) and Value (US$ Bn) Forecast, by Application, 2022–2031
10.4.3. Mexico High Purity Alumina Market Volume (Kilo Tons) and Value (US$ Bn) Forecast, by Grade, 2022–2031
10.4.4. Mexico High Purity Alumina Market Volume (Kilo Tons) and Value (US$ Bn) Forecast, by Application, 2022–2031
10.4.5. Rest of Latin America High Purity Alumina Market Volume (Kilo Tons) and Value (US$ Bn) Forecast, by Grade, 2022–2031
10.4.6. Rest of Latin America High Purity Alumina Market Volume (Kilo Tons) and Value (US$ Bn) Forecast, by Application, 2022–2031
10.5. Latin America High Purity Alumina Market Attractiveness Analysis
11. Middle East & Africa High Purity Alumina Market Analysis and Forecast, 2022–2031
11.1. Key Findings
11.2. Middle East & Africa High Purity Alumina Market Volume (Kilo Tons) and Value (US$ Bn) Forecast, by Grade, 2022–2031
11.3. Middle East & Africa High Purity Alumina Market Volume (Kilo Tons) and Value (US$ Bn) Forecast, by Application, 2022–2031
11.4. Middle East & Africa High Purity Alumina Market Volume (Kilo Tons) and Value (US$ Bn) Forecast, by Country and Sub-region, 2021-2031
11.4.1. GCC High Purity Alumina Market Volume (Kilo Tons) and Value (US$ Bn) Forecast, by Grade, 2022–2031
11.4.2. GCC High Purity Alumina Market Volume (Kilo Tons) and Value (US$ Bn) Forecast, by Application, 2022–2031
11.4.3. South Africa High Purity Alumina Market Volume (Kilo Tons) and Value (US$ Bn) Forecast, by Grade, 2022–2031
11.4.4. South Africa High Purity Alumina Market Volume (Kilo Tons) and Value (US$ Bn) Forecast, by Application, 2022–2031
11.4.5. Rest of Middle East & Africa High Purity Alumina Market Volume (Kilo Tons) and Value (US$ Bn) Forecast, by Grade, 2022–2031
11.4.6. Rest of Middle East & Africa High Purity Alumina Market Volume (Kilo Tons) and Value (US$ Bn) Forecast, by Application, 2022–2031
11.5. Middle East & Africa High Purity Alumina Market Attractiveness Analysis
12. Competition Landscape
12.1. Global High Purity Alumina Company Market Share Analysis, 2021
12.2. Company Profiles (Details – Overview, Financials, Recent Developments, and Strategy)
12.2.1. Sumitomo Chemical Co. Ltd.
12.2.1.1. Company Description
12.2.1.2. Business Overview
12.2.1.3. Financial Overview
12.2.1.4. Strategic Overview
12.2.2. Sasol Ltd.
12.2.2.1. Company Description
12.2.2.2. Business Overview
12.2.2.3. Financial Overview
12.2.2.4. Strategic Overview
12.2.3. Baikowski SAS
12.2.3.1. Company Description
12.2.3.2. Business Overview
12.2.3.3. Financial Overview
12.2.3.4. Strategic Overview
12.2.4. Nippon Light Metal Co. Ltd.
12.2.4.1. Business Overview
12.2.4.2. Financial Overview
12.2.4.3. Strategic Overview
12.2.5. HMR Co., Ltd.
12.2.5.1. Company Description
12.2.5.2. Business Overview
12.2.5.3. Financial Overview
12.2.5.4. Strategic Overview
12.2.6. Dalian Hiland Photoelectric Material Co., Ltd.
12.2.6.1. Company Description
12.2.6.2. Business Overview
12.2.6.3. Financial Overview
12.2.6.4. Strategic Overview
12.2.7. Hebei Hengbo New Material Technology Co. Ltd.
12.2.7.1. Company Description
12.2.7.2. Business Overview
12.2.7.3. Financial Overview
12.2.8. Xuancheng Jing Rui New Material Co., Ltd.
12.2.8.1. Company Description
12.2.8.2. Business Overview
12.2.8.3. Financial Overview
12.2.9. Polar Sapphire
12.2.9.1. Company Description
12.2.9.2. Business Overview
12.2.9.3. Financial Overview
12.2.10. Altech Chemicals Ltd.
12.2.10.1. Company Description
12.2.10.2. Business Overview
12.2.10.3. Financial Overview
13. Primary Research: Key Insights
14. Appendix
List of Tables
Table 1: Global High Purity Alumina Market Volume (Kilo Tons) Forecast, by Grade, 2022–2031
Table 2: Global High Purity Alumina Market Value (US$ Bn) Forecast, by Grade, 2022–2031
Table 3: Global High Purity Alumina Market Volume (Kilo Tons) Forecast, by Application, 2022–2031
Table 4: Global High Purity Alumina Market Value (US$ Bn) Forecast, by Application, 2022–2031
Table 5: Global High Purity Alumina Market Volume (Kilo Tons) Forecast, by Region, 2022–2031
Table 6: Global High Purity Alumina Market Value (US$ Bn) Forecast, by Region, 2022–2031
Table 7: North America High Purity Alumina Market Volume (Kilo Tons) Forecast, by Grade, 2022–2031
Table 8: North America High Purity Alumina Market Value (US$ Bn) Forecast, by Grade, 2022–2031
Table 9: North America High Purity Alumina Market Volume (Kilo Tons) Forecast, by Application, 2022–2031
Table 10: North America High Purity Alumina Market Value (US$ Bn) Forecast, by Application, 2022–2031
Table 11: North America High Purity Alumina Market Volume (Kilo Tons) Forecast, by Country, 2022–2031
Table 12: North America High Purity Alumina Market Value (US$ Bn) Forecast, by Country, 2022–2031
Table 13: U.S. High Purity Alumina Market Volume (Kilo Tons) Forecast, by Grade, 2022–2031
Table 14: U.S. High Purity Alumina Market Value (US$ Bn) Forecast, by Grade, 2022–2031
Table 15: U.S. High Purity Alumina Market Volume (Kilo Tons) Forecast, by Application, 2022–2031
Table 16: U.S. High Purity Alumina Market Value (US$ Bn) Forecast, by Application, 2022–2031
Table 17: Canada High Purity Alumina Market Volume (Kilo Tons) Forecast, by Grade, 2022–2031
Table 18: Canada High Purity Alumina Market Value (US$ Bn) Forecast, by Grade, 2022–2031
Table 19: Canada High Purity Alumina Market Volume (Kilo Tons) Forecast, by Application, 2022–2031
Table 20: Canada High Purity Alumina Market Value (US$ Bn) Forecast, by Application 2022–2031
Table 21: Europe High Purity Alumina Market Volume (Kilo Tons) Forecast, by Grade, 2022–2031
Table 22: Europe High Purity Alumina Market Value (US$ Bn) Forecast, by Grade, 2022–2031
Table 23: Europe High Purity Alumina Market Volume (Kilo Tons) Forecast, by Application, 2022–2031
Table 24: Europe High Purity Alumina Market Value (US$ Bn) Forecast, by Application 2022–2031
Table 25: Europe High Purity Alumina Market Volume (Kilo Tons) Forecast, by Country and Sub-region, 2022–2031
Table 26: Europe High Purity Alumina Market Value (US$ Bn) Forecast, by Country and Sub-region, 2022–2031
Table 27: Germany High Purity Alumina Market Volume (Kilo Tons) Forecast, by Grade, 2022–2031
Table 28: Germany High Purity Alumina Market Value (US$ Bn) Forecast, by Grade, 2022–2031
Table 29: Germany High Purity Alumina Market Volume (Kilo Tons) Forecast, by Application, 2022–2031
Table 30: Germany High Purity Alumina Market Value (US$ Bn) Forecast, by Application 2022–2031
Table 31: France High Purity Alumina Market Volume (Kilo Tons) Forecast, by Grade, 2022–2031
Table 32: France High Purity Alumina Market Value (US$ Bn) Forecast, by Grade, 2022–2031
Table 33: France High Purity Alumina Market Volume (Kilo Tons) Forecast, by Application, 2022–2031
Table 34: France High Purity Alumina Market Value (US$ Bn) Forecast, by Application 2022–2031
Table 35: U.K. High Purity Alumina Market Volume (Kilo Tons) Forecast, by Grade, 2022–2031
Table 36: U.K. High Purity Alumina Market Value (US$ Bn) Forecast, by Grade, 2022–2031
Table 37: U.K. High Purity Alumina Market Volume (Kilo Tons) Forecast, by Application, 2022–2031
Table 38: U.K. High Purity Alumina Market Value (US$ Bn) Forecast, by Application 2022–2031
Table 39: Italy High Purity Alumina Market Volume (Kilo Tons) Forecast, by Grade, 2022–2031
Table 40: Italy High Purity Alumina Market Value (US$ Bn) Forecast, by Grade, 2022–2031
Table 41: Italy High Purity Alumina Market Volume (Kilo Tons) Forecast, by Application, 2022–2031
Table 42: Italy High Purity Alumina Market Value (US$ Bn) Forecast, by Application 2022–2031
Table 43: Spain High Purity Alumina Market Volume (Kilo Tons) Forecast, by Grade, 2022–2031
Table 44: Spain High Purity Alumina Market Value (US$ Bn) Forecast, by Grade, 2022–2031
Table 45: Spain High Purity Alumina Market Volume (Kilo Tons) Forecast, by Application, 2022–2031
Table 46: Spain High Purity Alumina Market Value (US$ Bn) Forecast, by Application 2022–2031
Table 47: Russia & CIS High Purity Alumina Market Volume (Kilo Tons) Forecast, by Grade, 2022–2031
Table 48: Russia & CIS High Purity Alumina Market Value (US$ Bn) Forecast, by Grade, 2022–2031
Table 49: Russia & CIS High Purity Alumina Market Volume (Kilo Tons) Forecast, by Application, 2022–2031
Table 50: Russia & CIS High Purity Alumina Market Value (US$ Bn) Forecast, by Application 2022–2031
Table 51: Rest of Europe High Purity Alumina Market Volume (Kilo Tons) Forecast, by Grade, 2022–2031
Table 52: Rest of Europe High Purity Alumina Market Value (US$ Bn) Forecast, by Grade, 2022–2031
Table 53: Rest of Europe High Purity Alumina Market Volume (Kilo Tons) Forecast, by Application, 2022–2031
Table 54: Rest of Europe High Purity Alumina Market Value (US$ Bn) Forecast, by Application 2022–2031
Table 55: Asia Pacific High Purity Alumina Market Volume (Kilo Tons) Forecast, by Grade, 2022–2031
Table 56: Asia Pacific High Purity Alumina Market Value (US$ Bn) Forecast, by Grade, 2022–2031
Table 57: Asia Pacific High Purity Alumina Market Volume (Kilo Tons) Forecast, by Application, 2022–2031
Table 58: Asia Pacific High Purity Alumina Market Value (US$ Bn) Forecast, by Application 2022–2031
Table 59: Asia Pacific High Purity Alumina Market Volume (Kilo Tons) Forecast, by Country and Sub-region, 2022–2031
Table 60: Asia Pacific High Purity Alumina Market Value (US$ Bn) Forecast, by Country and Sub-region, 2022–2031
Table 61: China High Purity Alumina Market Volume (Kilo Tons) Forecast, by Grade, 2022–2031
Table 62: China High Purity Alumina Market Value (US$ Bn) Forecast, by Grade 2022–2031
Table 63: China High Purity Alumina Market Volume (Kilo Tons) Forecast, by Application, 2022–2031
Table 64: China High Purity Alumina Market Value (US$ Bn) Forecast, by Application 2022–2031
Table 65: Japan High Purity Alumina Market Volume (Kilo Tons) Forecast, by Grade, 2022–2031
Table 66: Japan High Purity Alumina Market Value (US$ Bn) Forecast, by Grade, 2022–2031
Table 67: Japan High Purity Alumina Market Volume (Kilo Tons) Forecast, by Application, 2022–2031
Table 68: Japan High Purity Alumina Market Value (US$ Bn) Forecast, by Application 2022–2031
Table 69: India High Purity Alumina Market Volume (Kilo Tons) Forecast, by Grade, 2022–2031
Table 70: India High Purity Alumina Market Value (US$ Bn) Forecast, by Grade, 2022–2031
Table 71: India High Purity Alumina Market Volume (Kilo Tons) Forecast, by Application, 2022–2031
Table 72: India High Purity Alumina Market Value (US$ Bn) Forecast, by Application 2022–2031
Table 73: ASEAN High Purity Alumina Market Volume (Kilo Tons) Forecast, by Grade, 2022–2031
Table 74: ASEAN High Purity Alumina Market Value (US$ Bn) Forecast, by Grade, 2022–2031
Table 75: ASEAN High Purity Alumina Market Volume (Kilo Tons) Forecast, by Application, 2022–2031
Table 76: ASEAN High Purity Alumina Market Value (US$ Bn) Forecast, by Application 2022–2031
Table 77: Rest of Asia Pacific High Purity Alumina Market Volume (Kilo Tons) Forecast, by Grade, 2022–2031
Table 78: Rest of Asia Pacific High Purity Alumina Market Value (US$ Bn) Forecast, by Grade, 2022–2031
Table 79: Rest of Asia Pacific High Purity Alumina Market Volume (Kilo Tons) Forecast, by Application, 2022–2031
Table 80: Rest of Asia Pacific High Purity Alumina Market Value (US$ Bn) Forecast, by Application 2022–2031
Table 81: Latin America High Purity Alumina Market Volume (Kilo Tons) Forecast, by Grade, 2022–2031
Table 82: Latin America High Purity Alumina Market Value (US$ Bn) Forecast, by Grade, 2022–2031
Table 83: Latin America High Purity Alumina Market Volume (Kilo Tons) Forecast, by Application, 2022–2031
Table 84: Latin America High Purity Alumina Market Value (US$ Bn) Forecast, by Application 2022–2031
Table 85: Latin America High Purity Alumina Market Volume (Kilo Tons) Forecast, by Country and Sub-region, 2022–2031
Table 86: Latin America High Purity Alumina Market Value (US$ Bn) Forecast, by Country and Sub-region, 2022–2031
Table 87: Brazil High Purity Alumina Market Volume (Kilo Tons) Forecast, by Grade, 2022–2031
Table 88: Brazil High Purity Alumina Market Value (US$ Bn) Forecast, by Grade, 2022–2031
Table 89: Brazil High Purity Alumina Market Volume (Kilo Tons) Forecast, by Application, 2022–2031
Table 90: Brazil High Purity Alumina Market Value (US$ Bn) Forecast, by Application 2022–2031
Table 91: Mexico High Purity Alumina Market Volume (Kilo Tons) Forecast, by Grade, 2022–2031
Table 92: Mexico High Purity Alumina Market Value (US$ Bn) Forecast, by Grade, 2022–2031
Table 93: Mexico High Purity Alumina Market Volume (Kilo Tons) Forecast, by Application, 2022–2031
Table 94: Mexico High Purity Alumina Market Value (US$ Bn) Forecast, by Application 2022–2031
Table 95: Rest of Latin America High Purity Alumina Market Volume (Kilo Tons) Forecast, by Grade, 2022–2031
Table 96: Rest of Latin America High Purity Alumina Market Value (US$ Bn) Forecast, by Grade, 2022–2031
Table 97: Rest of Latin America High Purity Alumina Market Volume (Kilo Tons) Forecast, by Application, 2022–2031
Table 98: Rest of Latin America High Purity Alumina Market Value (US$ Bn) Forecast, by Application 2022–2031
Table 99: Middle East & Africa High Purity Alumina Market Volume (Kilo Tons) Forecast, by Grade, 2022–2031
Table 100: Middle East & Africa High Purity Alumina Market Value (US$ Bn) Forecast, by Grade, 2022–2031
Table 101: Middle East & Africa High Purity Alumina Market Volume (Kilo Tons) Forecast, by Application, 2022–2031
Table 102: Middle East & Africa High Purity Alumina Market Value (US$ Bn) Forecast, by Application 2022–2031
Table 103: Middle East & Africa High Purity Alumina Market Volume (Kilo Tons) Forecast, by Country and Sub-region, 2022–2031
Table 104: Middle East & Africa High Purity Alumina Market Value (US$ Bn) Forecast, by Country and Sub-region, 2022–2031
Table 105: GCC High Purity Alumina Market Volume (Kilo Tons) Forecast, by Grade, 2022–2031
Table 106: GCC High Purity Alumina Market Value (US$ Bn) Forecast, by Grade, 2022–2031
Table 107: GCC High Purity Alumina Market Volume (Kilo Tons) Forecast, by Application, 2022–2031
Table 108: GCC High Purity Alumina Market Value (US$ Bn) Forecast, by Application 2022–2031
Table 109: South Africa High Purity Alumina Market Volume (Kilo Tons) Forecast, by Grade, 2022–2031
Table 110: South Africa High Purity Alumina Market Value (US$ Bn) Forecast, by Grade, 2022–2031
Table 111: South Africa High Purity Alumina Market Volume (Kilo Tons) Forecast, by Application, 2022–2031
Table 112: South Africa High Purity Alumina Market Value (US$ Bn) Forecast, by Application 2022–2031
Table 113: Rest of Middle East & Africa High Purity Alumina Market Volume (Kilo Tons) Forecast, by Grade, 2022–2031
Table 114: Rest of Middle East & Africa High Purity Alumina Market Value (US$ Bn) Forecast, by Grade, 2022–2031
Table 115: Rest of Middle East & Africa High Purity Alumina Market Volume (Kilo Tons) Forecast, by Application, 2022–2031
Table 116: Rest of Middle East & Africa High Purity Alumina Market Value (US$ Bn) Forecast, by Application 2022–2031
List of Figures
Figure 1: Global High Purity Alumina Market Volume Share Analysis, by Grade, 2021, 2025, and 2031
Figure 2: Global High Purity Alumina Market Attractiveness, by Grade
Figure 3: Global High Purity Alumina Market Volume Share Analysis, by Application, 2021, 2025, and 2031
Figure 4: Global High Purity Alumina Market Attractiveness, by Application
Figure 5: Global High Purity Alumina Market Volume Share Analysis, by Region, 2021, 2025, and 2031
Figure 6: Global High Purity Alumina Market Attractiveness, by Region
Figure 7: North America High Purity Alumina Market Volume Share Analysis, by Grade, 2021, 2025, and 2031
Figure 8: North America High Purity Alumina Market Attractiveness, by Grade
Figure 9: North America High Purity Alumina Market Attractiveness, by Grade
Figure 10: North America High Purity Alumina Market Volume Share Analysis, by Application, 2021, 2025, and 2031
Figure 11: North America High Purity Alumina Market Attractiveness, by Application
Figure 12: North America High Purity Alumina Market Attractiveness, by Country and Sub-region
Figure 13: Europe High Purity Alumina Market Volume Share Analysis, by Grade, 2021, 2025, and 2031
Figure 14: Europe High Purity Alumina Market Attractiveness, by Grade
Figure 15: Europe High Purity Alumina Market Volume Share Analysis, by Application, 2021, 2025, and 2031
Figure 16: Europe High Purity Alumina Market Attractiveness, by Application
Figure 17: Europe High Purity Alumina Market Volume Share Analysis, by Country and Sub-region, 2021, 2025, and 2031
Figure 18: Europe High Purity Alumina Market Attractiveness, by Country and Sub-region
Figure 19: Asia Pacific High Purity Alumina Market Volume Share Analysis, by Grade, 2021, 2025, and 2031
Figure 20: Asia Pacific High Purity Alumina Market Attractiveness, by Grade
Figure 21: Asia Pacific High Purity Alumina Market Volume Share Analysis, by Application, 2021, 2025, and 2031
Figure 22: Asia Pacific High Purity Alumina Market Attractiveness, by Application
Figure 23: Asia Pacific High Purity Alumina Market Volume Share Analysis, by Country and Sub-region, 2021, 2025, and 2031
Figure 24: Asia Pacific High Purity Alumina Market Attractiveness, by Country and Sub-region
Figure 25: Latin America High Purity Alumina Market Volume Share Analysis, by Grade, 2021, 2025, and 2031
Figure 26: Latin America High Purity Alumina Market Attractiveness, by Grade
Figure 27: Latin America High Purity Alumina Market Volume Share Analysis, by Application, 2021, 2025, and 2031
Figure 28: Latin America High Purity Alumina Market Attractiveness, by Application
Figure 29: Latin America High Purity Alumina Market Volume Share Analysis, by Country and Sub-region, 2021, 2025, and 2031
Figure 30: Latin America High Purity Alumina Market Attractiveness, by Country and Sub-region
Figure 31: Middle East & Africa High Purity Alumina Market Volume Share Analysis, by Grade, 2021, 2025, and 2031
Figure 32: Middle East & Africa High Purity Alumina Market Attractiveness, by Grade
Figure 33: Middle East & Africa High Purity Alumina Market Volume Share Analysis, by Application, 2021, 2025, and 2031
Figure 34: Middle East & Africa High Purity Alumina Market Attractiveness, by Application
Figure 35: Middle East & Africa High Purity Alumina Market Volume Share Analysis, by Country and Sub-region, 2021, 2025, and 2031
Figure 36: Middle East & Africa High Purity Alumina Market Attractiveness, by Country and Sub-region
Copyright © Transparency Market Research, Inc. All Rights reserved
Trust Online

High Purity Alumina Market