
Reports
Reports
The demand for minimally invasive surgical treatments is increasing as a result of benefits such as less discomfort, shorter recovery times, and smaller incisions. An increase in the geriatric population susceptible to chronic conditions including neurovascular disorders, urological disease, and cardiovascular disease is likely to play an important role in the expansion of the global guidewires market.
According to estimates from the World Health Organization (WHO), the global population of people aged 60 years and more is predicted to rise from 12% to 22% by 2050. The healthcare system is burdened by elderly population suffering from cardiovascular illnesses. As per World Bank data, about 27.04% of Japan's overall population was 65 years and older in 2017, up from about 25% in 2015. The prevalence of cardiovascular illnesses rises with age, which is predicted to increase the need for surgical guidewires. As a result, the growing elderly population is one of the major driving forces for the global guidewires market.
In addition to that, the increasing number of adult population is adopting unhealthy lifestyles such as a sedentary work life, lack of physical activity, high alcohol and cigarette intake, and a high diet of saturated fats and sweets. These factors raise the probability of chronic illnesses including heart disease, diabetes, and obesity, and which may necessitate surgical intervention as the condition progresses. As a result, the increased prevalence of chronic diseases is likely to drive the global guidewires market in the years to come.
The National Commission for the Evaluation of Medical Devices and Health Technologies (CNEDiMTS), France, approved Philips Volcano's Verrata and Verrata Plus guidewires for add-on compensation under section V of the List of Reimbursable Products and Services (LPPR) in May 2017. CNEDiMTS also assessed Boston Scientific’s fractional flow reserve guidewire, Comet, in June 2017 for inclusion in the LPPR category based on technical equivalence.
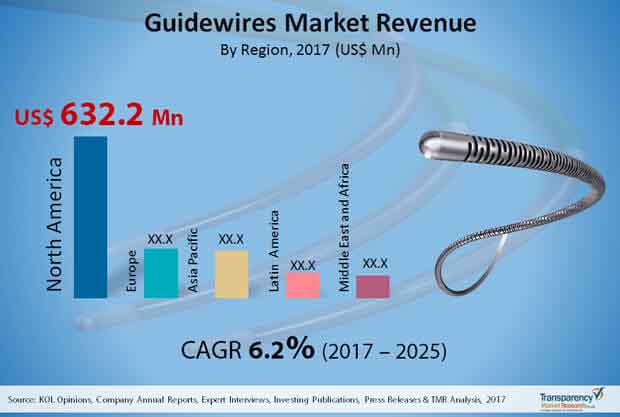
The guidewires market in North America is predicted to develop due to the rising prevalence of cardiovascular illnesses in both men and women in the US. As per the Journal of the American College of Cardiology, cardiovascular disease claims the lives of roughly 17 million people each year, with that figure anticipated to rise to almost 23 million by 2030. The danger of acute coronary syndrome is predicted to encourage the usage of pressure guidewire, fuelling expansion of the global guidewire market.
Due to the increasing demand for minimally invasive coronary operations, the coronary category has been one of the leading segments in the market. A substantial number of atherosclerosis patients are admitted to hospitals, and the incidence of cardiovascular disease is on the rise. In 2017, over 92.1 million American adults suffered from some sort of cardiovascular illness, according to the document Heart Disease and Stroke Statistics 2018.
The development of new technologies is likely to aid the segment's dominance during the forecast period. The availability of favorable reimbursement schemes for cardiovascular procedures is further likely to boosting the global market. Teleflex's Spectre guidewire and Galeo coronary guidewires (Biotronik) are two examples of coronary guidewires that have been introduced in the last four years.
Due to the high frequency of neurovascular illnesses, the neurovascular segment is expected to grow at rapid rate in the global guidewires market throughout the forecast period. The spinal cord and brain vascular system are affected by cavernoma, cerebral hemorrhage, arteriovenous malformations, aneurysms, and stroke. Due to the existence of important blood arteries, treating such illnesses is difficult. The growing use of these devices in extremely difficult neuro-vascular minimally invasive operations, on the other hand, is supporting the market growth.
The use of interventional radiology methods in image-guided diagnosis and treatment of illnesses has grown as guidewire tip technology has improved. Interventional radiology has led to substantial improvement in patient recovery.
As compared to open surgery, this is due to the fact that the technique carries a lower risk, produces less discomfort, and requires a shorter recovery period. pulmonary, hepatobiliary, gastrointestinal, vascular, and genitourinary disorders are all great choices for interventional radiology. The global guidewires market is expected to grow in the future, thanks to an increase in the use of minimally invasive operations and technical developments in surgical techniques.
The global market is likely to dominated by coronary guidewires. Incidences of coronary illnesses are expected to rise, propelling the industry ahead. To reach a lesion or vascular segment, these guidewires are straightforward to move across blood vessels. It serves as a guide for bigger catheters, making delivery to the treatment location easier. Coronary guidewires are expected to account for about half of the overall global market. This is due to the rising frequency of chronic renal disease and the usage of dialysis catheters, which is expected to fuel the expansion of the urology segment in the guidewires market. Furthermore, urology guidewires have an atraumatic hydrophilic tip that makes navigating narrow spaces easier. Urology guidewires are expected to account for a sizeable chunk of the guidewire market.
North America is expected to maintain its position as a leader in the global guidewires market. Key growth drivers include the high frequency of urological and cardiovascular disorders, as well as modern healthcare infrastructure and the existence of multiple guidewire producers. The North America guidewires market is expected to grow considerably during the forecast period.
The Asia-Pacific region is expected to develop at the rapid growth rate, with a considerable share of the market during the projection period. The growth of the Asia-Pacific guidewires market is likely to be aided by the growth of the business in developing markets, which is driven by increasing healthcare issues.
The use of high-quality guidewire brands imported from developed parts of the world has increased in these developing countries. Progress in the economy as well as favorable government policies have made it easier for significant market participants in the region to conduct business.
Guidewires market to climb to reach opportunities worth US$2.7 bn by 2025
Guidewires market is expected to garner a CAGR of 6.2% from 2017 to 2025
Guidewires market is driven by growing demand for minimally invasive interventional procedures
North America accounted for a major share of the global guidewires market
The coronary guidewires segment is expected to hold the leading revenue share in the global guidewires market
1. Preface
1.1. Market Definition and Scope
1.2. Market Segmentation
1.3. Key Research Objectives
1.4. Research Highlights
2. Assumptions and Research Methodology
3. Executive Summary: Global Guidewires Market
4. Market Overview
4.1. Introduction
4.1.1. Product Definition
4.1.2. Industry Evolution / Developments
4.2. Overview
4.3. Market Dynamics
4.3.1. Drivers
4.3.1.1 Increasing prevalence of cardiovascular and renal diseases
4.3.1.2 Rise in number of interventional diagnostic procedures performed
4.3.1.3 Growing demand for minimally invasive surgeries
4.3.1.4 Favorable reimbursement scenario
4.3.2. Restraints
4.3.2.1 High cost minimally invasive surgeries
4.3.2.2 Complications of guidewire use
4.3.3. Opportunity
4.3.3.1 Rising demand for technologically advanced guidewires considering patient comfort
4.3.3.2 Growing economies of emerging markets
4.4. Global Guidewires Market Analysis and Forecasts, 2015–2025
4.4.1. Market Revenue Projections (US$ Mn)
4.5. Porter’s Five Force Analysis
4.6. Market Outlook
4.7. Guidewire Contract Manufacturing Organizations (CMOs) (CMO Name & Type, Contact/Address, Services/Capabilities)
4.8. Guidewire Accessories Snapshot (Guidewire - Torque & Locking Device, Bowl, Straightener, Dispenser, Introducer Needles, Insertion Tool & Basin)
4.9. Guidewires Technology Trends (Automation of Guidewire Manufacturing Process, Coating & Use of Radiopaque Markers)
4.10. Key Metrics of New Generation Guidewires
4.11. Guidewires Core Material Snapshot (Nitinol & Stainless Steel)
5. Global Guidewires Market Analysis and Forecasts, By Product Type
5.1. Introduction & Definition
5.2. Key Findings / Developments
5.3. Market Value Forecast by Product Type, 2015–2025
5.3.1. Coronary Guidewires
5.3.2. Peripheral Guidewires
5.3.3. Neurovascular Guidewires
5.3.4. Urology Guidewires
5.3.5. Radiology Guidewires
5.3.6. Gastroenterology Guidewires
5.3.7. Other Guidewires (Otolaryngology & Oncology)
5.4. Market Attractiveness by Product Type
6. Global Guidewires Market Analysis and Forecasts, By End-user
6.1. Introduction & Definition
6.2. Key Findings / Developments
6.3. Market Value Forecast by End-user, 2015–2025
6.3.1. Hospitals
6.3.2. Clinics
6.3.3. Ambulatory Surgical Centers
6.3.4. Diagnostic Centers
6.4. Market Attractiveness by End-user
7. Global Guidewires Market Analysis and Forecasts, By Region
7.1. Key Findings
7.2. Market Value Forecast by Region
7.2.1. North America
7.2.2. Europe
7.2.3. Asia Pacific
7.2.4. Latin America
7.2.5. Middle East & Africa
7.3. Market Attractiveness by Country/Region
8. North America Guidewires Market Analysis and Forecast
8.1. Introduction
8.1.1. Key Findings
8.2. Market Value Forecast by Product Type, 2015–2025
8.2.1. Coronary Guidewires
8.2.2. Peripheral Guidewires
8.2.3. Neurovascular Guidewires
8.2.4. Urology Guidewires
8.2.5. Radiology Guidewires
8.2.6. Gastroenterology Guidewires
8.2.7. Other Guidewires (Otolaryngology & Oncology)
8.3. Market Value Forecast by End-user, 2015–2025
8.3.1. Hospitals
8.3.2. Clinics
8.3.3. Ambulatory Surgical Centers
8.3.4. Diagnostic Centers
8.4. Market Value Forecast by Country, 2015–2025
8.4.1. U.S.
8.4.2. Canada
8.5. Market Attractiveness Analysis
8.5.1. By Product Type
8.5.2. By End-user
8.5.3. By Country
9. Europe Guidewires Market Analysis and Forecast
9.1. Introduction
9.1.1. Key Findings
9.2. Market Value Forecast By Product Type, 2015–2025
9.2.1. Coronary Guidewires
9.2.2. Peripheral Guidewires
9.2.3. Neurovascular Guidewires
9.2.4. Urology Guidewires
9.2.5. Radiology Guidewires
9.2.6. Gastroenterology Guidewires
9.2.7. Other Guidewires (Otolaryngology & Oncology)
9.3. Market Value Forecast By End-user, 2015–2025
9.3.1. Hospitals
9.3.2. Clinics
9.3.3. Ambulatory Surgical Centers
9.3.4. Diagnostic Centers
9.4. Market Value Forecast By Country/Sub-Region, 2015–2025
9.4.1. Germany
9.4.2. U.K.
9.4.3. France
9.4.4. Spain
9.4.5. Italy
9.4.6. Russia
9.4.6. Rest of Europe
9.5. Market Attractiveness Analysis
9.5.1. By Product Type
9.5.2. By End-user
9.5.3. By Country/Sub-Region
10. Asia Pacific Guidewires Market Analysis and Forecast
10.1. Introduction
10.1.1. Key Findings
10.2. Market Value Forecast by Product Type, 2015–2025
10.2.1. Coronary Guidewires
10.2.2. Peripheral Guidewires
10.2.3. Neurovascular Guidewires
10.2.4. Urology Guidewires
10.2.5. Radiology Guidewires
10.2.6. Gastroenterology Guidewires
10.2.7. Other Guidewires (Otolaryngology & Oncology)
10.3. Market Value Forecast by End-user, 2015–2025
10.3.1. Hospitals
10.3.2. Clinics
10.3.3. Ambulatory Surgical Centers
10.3.4. Diagnostic Centers
10.4. Market Value Forecast by Country/Sub-Region, 2015–2025
10.4.1. China
10.4.2. Japan
10.4.3. India
10.4.4. Australia & New Zealand
10.4.5. Rest of Asia Pacific
10.5. Market Attractiveness Analysis
10.5.1. By Product Type
10.5.2. By End-user
10.5.3. By Country/Sub-Region
11. Latin America Guidewires Market Analysis and Forecast
11.1. Introduction
11.1.1. Key Findings
11.2. Market Value Forecast by Product Type, 2015–2025
11.2.1. Coronary Guidewires
11.2.2. Peripheral Guidewires
11.2.3. Neurovascular Guidewires
11.2.4. Urology Guidewires
11.2.5. Radiology Guidewires
11.2.6. Gastroenterology Guidewires
11.2.7. Other Guidewires (Otolaryngology & Oncology)
11.3. Market Value Forecast by End-user, 2015–2025
11.3.1. Hospitals
11.3.2. Clinics
11.3.3. Ambulatory Surgical Centers
11.3.4. Diagnostic Centers
11.4. Market Value Forecast by Country/Sub-Region, 2015–2025
11.4.1. Brazil
11.4.2. Mexico
11.4.3. Rest of Latin America
11.5. Market Attractiveness Analysis
11.5.1. By Product Type
11.5.2. By End-user
11.5.3. By Country/Sub-Region
12. Middle East & Africa Guidewires Market Analysis and Forecast
12.1. Introduction
12.1.1. Key Findings
12.2. Market Value Forecast by Product Type, 2015–2025
12.2.1. Coronary Guidewires
12.2.2. Peripheral Guidewires
12.2.3. Neurovascular Guidewires
12.2.4. Urology Guidewires
12.2.5. Radiology Guidewires
12.2.6. Gastroenterology Guidewires
12.2.7. Other Guidewires (Otolaryngology & Oncology)
12.3. Market Value Forecast by End-user, 2015–2025
12.3.1. Hospitals
12.3.2. Clinics
12.3.3. Ambulatory Surgical Centers
12.3.4. Diagnostic Centers
12.4. Market Value Forecast by Country/Sub-Region, 2015–2025
12.4.1. GCC Countries
12.4.2. South Africa
12.4.3. Israel
12.4.4. Rest of Middle East & Africa
12.5. Market Attractiveness Analysis
12.5.1. By Product
12.5.2. By End User
12.5.3. By Country/Sub-Region
13. Competition Landscape*
13.1. Market Player – Competition Matrix (By Tier and Size of companies)
13.2. Market Share Analysis by Company (2016)
13.3. Company Profiles (Details – Overview, Financials, Recent Developments, Strategy)
13.3.1. Abbott
13.3.1.1 Company Overview (HQ, Business Segments, Employee Strengths)
13.3.1.2 Financial Overview
13.3.1.3 Product Portfolio
13.3.1.4 SWOT Analysis
13.3.1.5 Strategic Overview
13.3.2. Terumo Medical Corporation
13.3.2.1 Company Overview (HQ, Business Segments, Employee Strengths)
13.3.2.2 Financial Overview
13.3.2.3 Product Portfolio
13.3.2.4 SWOT Analysis
13.3.2.5 Strategic Overview
13.3.3. Integer Holdings Corporation
13.3.3.1 Company Overview (HQ, Business Segments, Employee Strengths)
13.3.3.2 Financial Overview
13.3.3.3 Product Portfolio
13.3.3.4 SWOT Analysis
13.3.3.5 Strategic Overview
13.3.4. B. Braun Melsungen AG
13.3.4.1 Company Overview (HQ, Business Segments, Employee Strengths)
13.3.4.2 Financial Overview
13.3.4.3 Product Portfolio
13.3.4.4 SWOT Analysis
13.3.4.5 Strategic Overview
13.3.5. Olympus Corporation
13.3.5.1 Company Overview (HQ, Business Segments, Employee Strengths)
13.3.5.2 Financial Overview
13.3.5.3 Product Portfolio
13.3.5.4 SWOT Analysis
13.3.5.5 Strategic Overview
13.3.6. Stryker
13.3.6.1 Company Overview (HQ, Business Segments, Employee Strengths)
13.3.6.2 Financial Overview
13.3.6.3 Product Portfolio
13.3.6.4 SWOT Analysis
13.3.6.5 Strategic Overview
13.3.7. Cardinal Health, Inc.
13.3.7.1 Company Overview (HQ, Business Segments, Employee Strengths)
13.3.7.2 Financial Overview
13.3.7.3 Product Portfolio
13.3.7.4 SWOT Analysis
13.3.7.5 Strategic Overview
13.3.8. CONMED Corporation
13.3.8.1 Company Overview (HQ, Business Segments, Employee Strengths)
13.3.8.2 Financial Overview
13.3.8.3 Product Portfolio
13.3.8.4 SWOT Analysis
13.3.8.5 Strategic Overview
13.3.9. Cook
13.3.9.1 Company Overview (HQ, Business Segments, Employee Strengths)
13.3.9.2 Financial Overview
13.3.9.3 Product Portfolio
13.3.9.4 SWOT Analysis
13.3.9.5 Strategic Overview
13.3.10. Merit Medical Systems, Inc.
13.3.10.1 Company Overview (HQ, Business Segments, Employee Strengths)
13.3.10.2 Financial Overview
13.3.10.3 Product Portfolio
13.3.10.4 SWOT Analysis
13.3.10.5 Strategic Overview
13.3.11. Boston Scientific Corporation
13.3.11.1 Company Overview (HQ, Business Segments, Employee Strengths)
13.3.11.2 Financial Overview
13.3.11.3 Product Portfolio
13.3.11.4 SWOT Analysis
13.3.11.5 Strategic Overview
13.3.12. Medtronic
13.3.12.1 Company Overview (HQ, Business Segments, Employee Strengths)
13.3.12.2 Financial Overview
13.3.12.3 Product Portfolio
13.3.12.4 SWOT Analysis
13.3.12.5 Strategic Overview
13.3.13. Entellus Medical, Inc.
13.3.13.1 Company Overview (HQ, Business Segments, Employee Strengths)
13.3.13.2 Financial Overview
13.3.13.3 Product Portfolio
13.3.13.4 SWOT Analysis
13.3.13.5 Strategic Overview
13.3.14. SP Medical A/S.
13.3.14.1 Company Overview (HQ, Business Segments, Employee Strengths)
13.3.14.2 Financial Overview
13.3.14.3 Product Portfolio
13.3.14.4 SWOT Analysis
13.3.14.5 Strategic Overview
13.3.15. EPflex Feinwerktechnik GmbH
13.3.15.1 Company Overview (HQ, Business Segments, Employee Strengths)
13.3.15.2 Financial Overview
13.3.15.3 Product Portfolio
13.3.15.4 SWOT Analysis
13.3.15.5 Strategic Overview
14. Key Take Aways
List of Tables
Table 01 Guidewire Contract Manufacturing Organizations (CMOs)
Table 02 Guidewire Contract Manufacturing Organizations (CMOs)
Table 03 Guidewire Contract Manufacturing Organizations (CMOs)
Table 04 Guidewire Contract Manufacturing Organizations (CMOs)
Table 05 Global Guidewires Market Size (US$ Mn) Forecast, by Product, 2015–2025
Table 06 Global Guidewires Market Size (US$ Mn) Forecast, by End-user, 2015–2025
Table 07 Global Guidewires Market Size (US$ Mn) Forecast, by Region, 2015–2025
Table 08 North America Guidewires Market Size (US$ Mn) Forecast, by Country, 2015–2025
Table 09 North America Guidewires Market Size (US$ Mn) Forecast, by Product, 2015–2025
Table 10 North America Guidewires Market Size (US$ Mn) Forecast, by End-user, 2015–2025
Table 11 Europe Guidewires Market Size (US$ Mn) Forecast, by Country, 2015–2025
Table 12 Europe Guidewires Market Size (US$ Mn) Forecast, by Product, 2015–2025
Table 13 Europe Guidewires Market Size (US$ Mn) Forecast, by End-user, 2015–2025
Table 14 Asia Pacific Guidewires Market Size (US$ Mn) Forecast, by Country/Sub-region, 2015–2025
Table 15 Asia Pacific Guidewires Market Size (US$ Mn) Forecast, by Product Type, 2015–2025
Table 16 Asia Pacific Guidewires Market Size (US$ Mn) Forecast, by End-user, 2015–2025
Table 17 Latin America Guidewires Market Size (US$ Mn) Forecast, by Country/Sub-region, 2015–2025
Table 18 Latin America Guidewires Market Size (US$ Mn) Forecast, by Product, 2015–2025
Table 19 Latin America Guidewires Market Size (US$ Mn) Forecast, by End-user, 2015–2025
Table 20 Middle East & Africa Guidewires Market Size (US$ Mn) Forecast, by Country/Sub-region, 2015–2025
Table 21 Middle East & Africa Guidewires Market Size (US$ Mn) Forecast, by Product, 2015–2025
Table 22 Middle East & Africa Guidewires Market Size (US$ Mn) Forecast, by End-user, 2015–2025
List of Figures
Figure 01 Global Guidewires Market Size (US$ Mn) Forecast, 2015–2025
Figure 02 Market Value Share (%), by Product (2016)
Figure 03 Market Value Share (%), by End-user (2016)
Figure 04 Market Value Share (%), by Region (2016)
Figure 05 Global Guidewires Market Value Share (%), by Product, 2017 and 2025
Figure 06 Global Guidewires Market Revenue (US$ Mn) Forecast and Y-o-Y Growth (%) Projection, by Coronary Guidewires, 2015–2025
Figure 07 Global Guidewires Market Revenue (US$ Mn) Forecast and Y-o-Y Growth (%) Projection, by Peripheral Guidewires, 2015–2025
Figure 08 Global Guidewires Market Revenue (US$ Mn) Forecast and Y-o-Y Growth (%) Projection, by Neurovascular Guidewires, 2015–2025
Figure 09 Global Guidewires Market Revenue (US$ Mn) Forecast and Y-o-Y Growth (%) Projection, by Urology Guidewires, 2015–2025
Figure 10 Global Guidewires Market Revenue (US$ Mn) Forecast and Y-o-Y Growth (%) Projection, by Radiology Guidewires, 2015–2025
Figure 11 Global Guidewires Market Revenue (US$ Mn) Forecast and Y-o-Y Growth (%) Projection, by Gastroenterology Guidewires, 2015–2025
Figure 12 Global Guidewires Market Revenue (US$ Mn) Forecast and Y-o-Y Growth (%) Projection, by Other Guidewires, 2015–2025
Figure 13 Global Guidewires Market Attractiveness, by Product, 2017–2025
Figure 14 Global Guidewires Market Value Share (%), by End-user, 2017 and 2025
Figure 15 Global Guidewires Market Revenue (US$ Mn) Forecast and Y-o-Y Growth (%) Projection, by Hospitals, 2017–2025
Figure 16 Global Guidewires Market Revenue (US$ Mn) Forecast and Y-o-Y Growth (%) Projection, by Clinics, 2017–2025
Figure 17 Global Guidewires Market Revenue (US$ Mn) Forecast and Y-o-Y Growth (%) Projection, by Ambulatory Surgical Centers, 2017–2025
Figure 18 Global Guidewires Market Revenue (US$ Mn) Forecast and Y-o-Y Growth (%) Projection, Diagnostic Centers, 2017–2025
Figure 19 Global Guidewires Market Attractiveness, by End-user, 2017–2025
Figure 20 Global Guidewires Market Value Share (%), by Region, 2017 and 2025
Figure 21 Global Guidewires Market Attractiveness, by Region, 2017–2025
Figure 22 North America Guidewires Market Revenue (US$ Mn) Forecast and Y-o-Y Growth (%) Projection, 2017–2025
Figure 23 North America Market Attractiveness, by Country, 2017–2025
Figure 24 North America Guidewires Market Value Share (%), by Country, 2017 and 2025
Figure 25 North America Guidewires Market Value (%) Share, by Product, 2017 and 2025
Figure 26 North America Guidewires Market Value Share (%), by End-user, 2017 and 2025
Figure 27 North America Market Attractiveness, by Product, 2017–2025
Figure 28 North America Market Attractiveness, by End-user, 2017–2025
Figure 29 Europe Guidewires Market Revenue (US$ Mn) Forecast and Y-o-Y Growth (%) Projection, 2017–2025
Figure 30 Europe Market Attractiveness, by Country, 2017–2025
Figure 31 Europe Guidewires Market Value Share (%), by Country, 2017 and 2025
Figure 32 Europe Guidewires Market Value Share (%), by Product, 2017 and 2025
Figure 33 Europe Guidewires Market Value Share (%), by End-user, 2017 and 2025
Figure 34 Europe Market Attractiveness, by Product, 2017–2025
Figure 35 Europe Market Attractiveness, by End-user, 2017–2025
Figure 36 Asia Pacific Guidewires Market Revenue (US$ Mn) Forecast and Y-o-Y Growth (%) Projection, 2015–2025
Figure 37 Asia Pacific Guidewires Market Attractiveness, by Country/Sub-region, 2017–2025
Figure 38 Asia Pacific Guidewires Market Value Share (%), by Country/Sub-region, 2017 and 2025
Figure 39 Asia Pacific Guidewires Market Value Share (%), by Product type, 2017 and 2025
Figure 40 Asia Pacific Guidewires Market Value Share (%), by End-user, 2017 and 2025
Figure 41 Asia Pacific Guidewires Market Attractiveness, by Product, 2017–2025
Figure 42 Asia Pacific Guidewires Market Attractiveness, by End-user, 2017–2025
Figure 43 Latin America Guidewires Market Revenue (US$ Mn) Forecast and Y-o-Y Growth (%) Projection, 2015–2025
Figure 44 Latin America Guidewires Market Attractiveness, by Country/Sub-region, 2017–2025
Figure 45 Latin America Guidewires Market Value Share (%), by Country/Sub-region, 2017 and 2025
Figure 46 Latin America Guidewires Market Value Share, by Product, 2017 and 2025
Figure 47 Latin America Guidewires Market Value Share (%), by End-user, 2017 and 2025
Figure 48 Latin America Guidewires Market Attractiveness, by Product, 2017–2025
Figure 49 Latin America Guidewires Market Attractiveness, by End-user, 2017–2025
Figure 50 Middle East & Africa Guidewires Market Size (US$ Mn) Forecast, 2015–2025
Figure 51 Middle East & Africa Guidewires Market Attractiveness, by Country/Sub-region, 2017–2025
Figure 52 Middle East & Africa Guidewires Market Value Share (%), by Country/Sub-region, 2017 and 2025
Figure 53 Middle East & Africa Guidewires Market Value Share (%), by Product, 2017 and 2025
Figure 54 Middle East & Africa Guidewires Market Value Share (%), by End-user, 2017 and 2025
Figure 55 Middle East & Africa Guidewires Market Attractiveness, by Product, 2017–2025
Figure 56 Middle East & Africa Guidewires Market Attractiveness, by End-user, 2017–2025
Figure 57 Global Heart Valve Devices Market Share, by Company, 2016
Figure 58 Revenue (US$ Mn) and Y-o-Y Growth (%), 2013–2016Revenue (US$ Mn) and Y-o-Y Growth (%), 2013–2016
Figure 59 R&D Expenses (US$ Mn) and Y-o-Y Growth (%), 2013–2016
Figure 60 Breakdown of Net Sales (%), by Region, 2016
Figure 61 Breakdown of Net Sales (%), by Business Segment, 2016
Figure 62 Revenue (US$ Mn) and Y-o-Y Growth (%), 2013–2016
Figure 63 R&D Expenses (US$ Mn) and Y-o-Y Growth (%), 2013–2016
Figure 64 Breakdown of Net Sales (%), by Business Segment, 2016
Figure 65 Breakdown of Net Sales (%), by Country, 2016
Figure 66 Revenue (US$ Mn) & Y-o-Y Growth (%), 2013–2016
Figure 67 Breakdown of Net Sales (%), by Business Segment, 2016
Figure 68 Revenue (US$ Mn) & Y-o-Y Growth (%), 2013–2016
Figure 69 R&D Intensity and Sales & Marketing Intensity (%), 2015–2016
Figure 70 (SP Group A/S) Revenue (US$ Mn) & Y-o-Y Growth (%), 2013–2016
Figure 71 (SP Group A/S) Breakdown of Net Sales (%), by Business Segment, 2016
Figure 72 Revenue (US$ Mn) & Y-o-Y Growth (%), 2013–2016
Figure 73 Breakdown of Net Sales (%), by Business Segment, 2016
Figure 74 Revenue (US$ Mn) & Y-o-Y Growth (%), 2013–2016
Figure 75 Breakdown of Net Sales (%), by Business Segment, 2016
Figure 76 Breakdown of Net Sales (%), by Region, 2016
Figure 77 Revenue (US$ Mn) and Y-o-Y Growth (%), 2013–2016
Figure 78 Breakdown of Net Sales (%), by Business Segment, 2016
Figure 79 Breakdown of Net Sales (%), by Region, 2016
Figure 80 Revenue (US$ Mn) and Y-o-Y Growth (%), 2013–2016
Figure 81 Breakdown of Net Sales (%), by Business Segment, 2016
Figure 82 Revenue (US$ Mn) and Y-o-Y Growth (%), 2013–2016
Figure 83 "Breakdown of Net Sales (%), by Business Segment, 2016
Figure 84 Breakdown of Net Sales (%), by Region, 2016
Figure 85 Revenue (US$ Mn) and Y-o-Y Growth (%), 2013–2016
Figure 86 Breakdown of Net Sales (%), by Business Segment, 2016
Figure 87 Breakdown of Net Sales (%), by Medical Business Segment, 2016
Figure 88 Revenue (US$ Mn) and Y-o-Y Growth (%), 2013–2016
Figure 89 Breakdown of Net Sales (%), by Business Segment, 2016
Figure 90 Breakdown of Net Sales (%), by Neurotechnology & Spine Business Segment, 2016
Figure 91 Revenue (US$ Mn) and Y-o-Y Growth (%), 2013–2016
Figure 92 Breakdown of Net Sales (%), by Region, 2016
Copyright © Transparency Market Research, Inc. All Rights reserved
Trust Online

Guidewires Market Insights, 2017-2025